SILVER - HEALTHY CONSOLIDATION LONGSSilver doing a healthy consolidation - momentum intact.
very strong support for momentum to continue is $90, belov that momentum vill be lost.
small resistance at $93.50
major resistance at $95.50 - $96
above $96 v should likely test 3digits - $100.
above that vill be a price discovery one can trail at ST 1.5 on 75m chart.
MCX

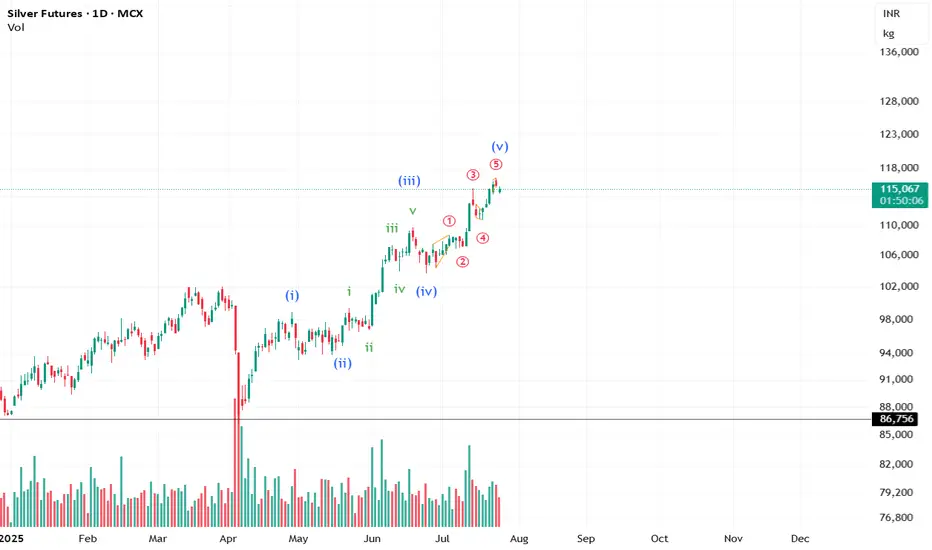
MCX Silver: Healthy Dip Before Next RallyMCX Silver is in a strong long-term uptrend on the daily chart. The market has already completed wave 1, 2, and a strong wave 3 upward. After this big rise, price is now expected to make a normal correction (wave 4). This pullback can come toward the 236,000 area, which is an important support zone. As long as price stays above this support, the overall trend remains bullish. After wave 4 is completed, Silver is expected to start wave 5, which can push prices to new highs. In short, the trend is up, and any dip is a healthy correction, not weakness.
Stay Tuned :)
@Money_Dictators

SILVER Triangle BreakoutSilver has given a breakout after forming a triangle pattern on 1h & 4h timeframe. Silver is also trading above 200 EMA on both the timeframes.

SELL SILVER - everyone says this, but i say only when i'm sureMarkets that run too far from their statistical/structural mean tend to revert back — especially after parabolic rallies. Classic studies show prices can overshoot by large factors before pulling back toward long-term averages.
arXiv
Silver in 2025 experienced extraordinary gains (~150–170%+), which is well beyond typical historical norms relative to commodities or industrial metals.
Trading Economics
When a rally of that magnitude climaxes, mean-reversion theory suggests:
Prices overshoot the “fair value band”
Sellers (especially momentum traders) begin taking profits
Volatility spikes increase backwardation/short squeezes
This is exactly what has been happening recently — sharp pullbacks, volatility, and aggressive liquidation.

Silver at a Critical Inflection Point [25% DOWNSIDE EXPECTED]Silver has delivered a powerful rally this year , but key Technical Milestones will now complete. in the 72-75 zone
🔹 Multiple Cup & Handle targets achieved on the log chart
🔹 ~300% Fibonacci extension of the post-COVID move reached
🔹 Decades-long $50 resistance broken — a major structural event
🔹 Using price symmetry, $75 now stands out as a heavy resistance zone
🔹Possible Retracement zone: 46 to 54
📉 With pattern completion and long-term resistance converging, risk-reward strongly favors caution at current levels.
Markets move in cycles — and Silver may be entering the next phase.
NOT SEBI REGISTERED. ⏐ ALL VIEWS ARE PERSONAL⏐ NOT AN INVESTMENT ADVICE

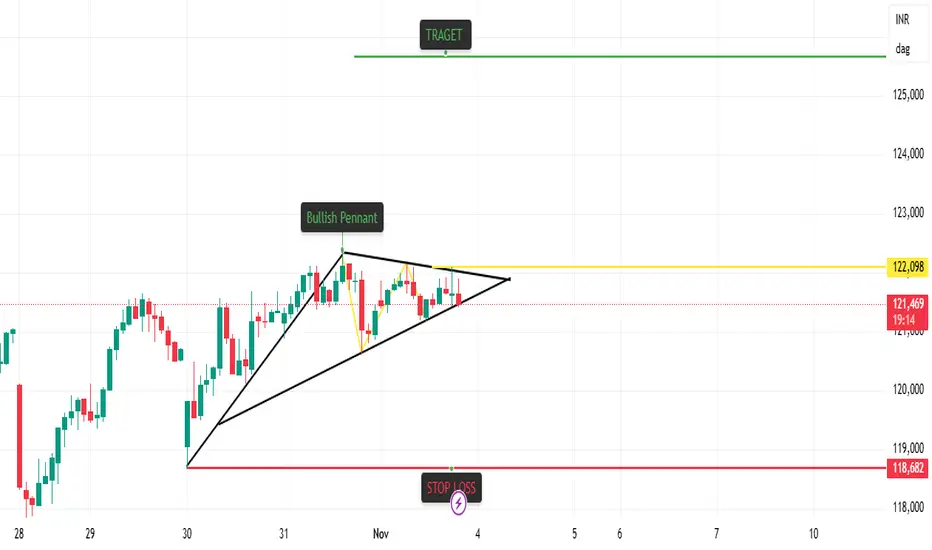
Bullish Pennant Breakout Strategy in GoldBullish Pennant Breakout in Gold MCX
📊 Pattern Overview:
A Bullish Pennant pattern has formed after a strong upward move, signaling a potential continuation of the trend. The pattern is characterized by converging trendlines during consolidation, followed by a breakout to the upside.
📈 Strategy Setup:
Pattern: Bullish Pennant
Breakout Confirmation: Price closing above pennant resistance line
Entry Zone: Near breakout candle close
Target (T1): ₹125,635
Stop Loss (SL): ₹118,682
Risk–Reward Ratio: Approximately 1:2
📊 Indicator Confluence:
T-K Cross: Bullish Cross
Price vs Kijun: Bullish
Cloud Trend: Up
VWMA: Up
RSI: Up
VWAP: Up
SuperTrend: Down (short-term resistance, to be monitored)
🧠 Trading Logic:
The Bullish Pennant indicates a temporary consolidation within an existing uptrend. A confirmed breakout with indicator support (Ichimoku, RSI, VWMA, and VWAP in alignment) strengthens the bullish momentum. Traders may look for sustained candles above the upper trendline with volume confirmation.
⚠️ Disclaimer:
This content is shared for educational purposes only and does not constitute investment or trading advice. Market conditions can change rapidly — always conduct your own analysis and use proper risk management before making any trading decisions.
Silver Triangle BreakoutSilver is attempting breakout forming a ascending triangle pattern on 1h and 4h timeframe. It is also trading above 200ema.

MCX | Strong Bullish Candle + VWAP Alignment + Swing Reversal Se📈 MCX | Strong Bullish Candle + VWAP Alignment + Swing Reversal Setup 🚀
🔹 Entry Zone: ₹9,305.50 – ₹9,335.00
🔹 Stop Loss: ₹8,962.50 (Risk ~343 pts)
🔹 Supports: 9,081 / 8,856.50 / 8,729.50
🔹 Resistances: 9,432.50 / 9,559.50 / 9,784.00
🔹 Swing Demand Zone: ₹7,880 – ₹7,725.50
🔹 Intraday Demand Zone: ₹9,052 – ₹8,975.50
🔑 Key Highlights
✅ Strong Bullish Candle signaling buyer dominance and swing reversal
✅ Bullish VWAP Alignment confirming upward control by buyers
✅ RSI improving from oversold region, supporting reversal momentum
✅ Bollinger Squeeze-Off indicating volatility expansion likely
✅ Volume near average levels – potential for fresh accumulation on breakout
🎯 STWP Trade View
📊 Momentum supports a bullish continuation if price sustains above ₹9,432. A breakout beyond ₹9,560 can extend the rally toward ₹9,784.
⚠️ The ₹9,052–₹8,975 zone offers intraday support, while ₹7,880–₹7,725 remains the long-term swing accumulation area for positional traders.
💡 Learning Note
This setup highlights how VWAP alignment with a strong bullish candle near demand zones acts as a multi-layer confirmation of trend reversal. Watching for volume pickup near resistances helps validate institutional buying strength.
Final Outlook: Momentum: Strong, Trend: Bullish, Risk: Low, Volume: High
________________________________________
________________________________________
⚠️ Disclosure & Disclaimer – Please Read Carefully
The information shared here is meant purely for learning and awareness. It is not a buy or sell recommendation and should not be taken as investment advice. I am not a SEBI-registered investment adviser, and all views expressed are based on personal study, chart patterns, and publicly available market data.
Trading—whether in stocks or options—carries risk. Markets can move unexpectedly, and losses can sometimes exceed the money you have invested. Past performance or past setups do not guarantee future results.
If you are a beginner, treat this as a guide to understand how the market works and practice on paper trades before risking real money. If you are experienced, always assess your own risk, position sizing, and strategy suitability before entering trades.
Consult a SEBI-registered financial adviser before making any real trading decision. By engaging with this content, you acknowledge full responsibility for your trades and investments.
Position Status: No active position in MCX at the time of analysis.
Data Source: TradingView & NSE India (Past Chart Reference) (Historical levels)
💬 Found this useful?
🔼 Give this post a Boost to help more traders discover clean, structured learning.
✍️ Drop your thoughts, questions, or setups in the comments — let’s grow together!
🔁 Share with fellow traders and beginners to spread awareness.
👉 “If you liked this breakdown, follow for more clean, structured setups with discipline at the core.”
🚀 Stay Calm. Stay Clean. Trade With Patience.
Trade Smart | Learn Zones | Be Self-Reliant 📊

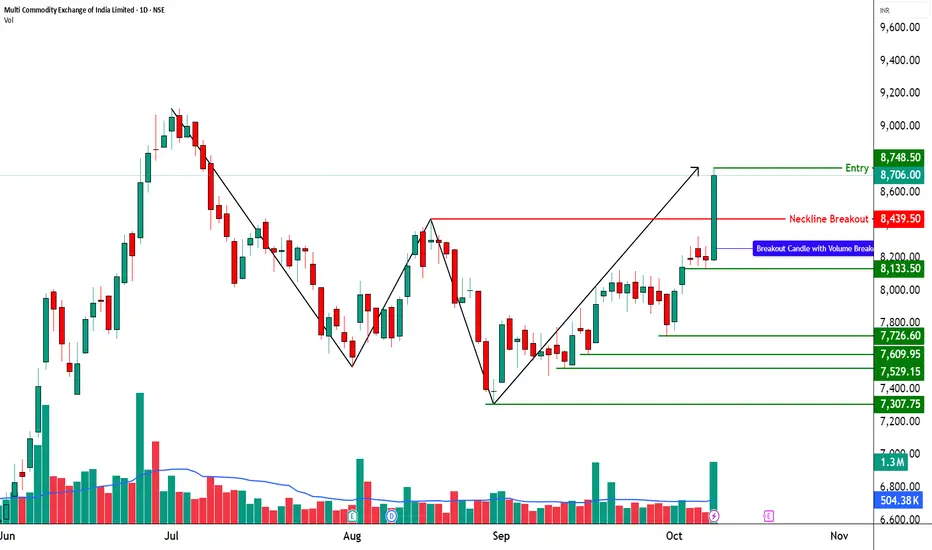
MCX - Bullish W-Pattern (Double Bottom Breakout)________________________________________
🚀 Multi Commodity Exchange of India Ltd (NSE: MCX) | Bullish W-Pattern (Double Bottom Breakout)
📊 Current Market Snapshot
CMP: ₹8,706.00
Sector: Financial Services / Commodity Exchange
Pattern Observed: 🟢 W-Pattern (Double Bottom Breakout)
Candlestick Signal: Strong Bullish Marubozu + Volume Breakout
Strength Rating: ⭐⭐⭐⭐☆ (High-Conviction Bullish Reversal)
________________________________________
🧭 Technical Indicators
The technical indicators on this chart are flashing strong bullish signals. Momentum is clearly positive, supported by a Bullish Marubozu candle, which reflects strong buying pressure and conviction. The chart also indicates a possible breakout formation, confirmed by a strong bullish candle backed by extremely high volume — a classic sign of institutional participation.
Multiple bullish confirmations like swing trade alignment, intraday signal, RSI breakout, and bullish engulfing pattern further add weight to the uptrend. The Bollinger Band breakout and Bullish VWAP suggest sustained price expansion, while the BB Squeeze-Off hints at volatility returning in favor of the bulls. Altogether, these indicators reinforce a buy-on-dip structure with potential for continuation toward higher resistance zones.
MCX is currently trading in the Progressive Zone, indicating a phase of steady upward momentum where buyers are actively accumulating positions. This zone reflects controlled bullish strength and sustained participation, suggesting that the stock is gearing up for a potential breakout continuation.
The KST (Know Sure Thing) indicator for MCX is in bullish territory, confirming the upward momentum seen in price action. With a strong positive crossover and supportive strength reading, the KST reinforces the ongoing uptrend — indicating that momentum remains firmly in favor of the bulls and the stock could continue its northward journey.
MCX is trading between its Swing High at ₹8,439.5 and Swing Low at ₹7,304. The Top Range near ₹9,115 acts as a major resistance zone, while the Bottom Range around ₹7,304 provides strong support, defining a clear bullish structure with room for further upside if momentum sustains.
________________________________________
📊 Trade Setup (Strong Momentum Entry)
Entry: ₹8,748.50
________________________________________
💡 Learning Note
This setup is a textbook example of a W-pattern (Double Bottom) breakout, where price reverses from a downtrend after forming two clear lows at similar levels. The neckline breakout with heavy volume confirms a shift in market sentiment from bearish to bullish. Such patterns highlight how volume expansion and strong breakout candles validate reversal strength and help traders identify early entry points in new uptrends.
________________________________________
⚠️ Disclosure & Disclaimer – Please Read Carefully
The information shared here is meant purely for learning and awareness. It is not a buy or sell recommendation and should not be taken as investment advice. I am not a SEBI-registered investment adviser, and all views expressed are based on personal study, chart patterns, and publicly available market data.
Position Status: No active position in MCX at the time of analysis.
Data Source: Past Chart reference(Historical levels)
Trading—whether in stocks or options—carries risk. Markets can move unexpectedly, and losses can sometimes exceed the money you have invested. Past performance or setups do not guarantee future results.
If you are a beginner, treat this as a learning guide and practice with paper trades before risking real money. If you are experienced, always assess your own risk, position sizing, and strategy suitability before entering trades.
Consult a SEBI-registered financial adviser before making any real trading decision. By engaging with this content, you acknowledge full responsibility for your trades and investments.
________________________________________
💬 Found this useful?
🔼 Give this post a Boost to help more traders discover clean, structured learning.
✍️ Drop your thoughts, questions, or setups in the comments — let’s grow together!
🔁 Share with fellow traders and beginners to spread awareness.
👉 “If you liked this breakdown, follow for more clean, structured setups with discipline at the core.”
🚀 Stay Calm. Stay Clean. Trade With Patience.
Trade Smart | Learn Zones | Be Self-Reliant 📊
________________________________________
Don’t Miss This Rare MCX Setup Breakout + Retest= Big Move AheadHello Traders!
Today’s analysis is on MCX Ltd., where we just spotted a powerful Descending Triangle Breakout . After weeks of consolidation, the price has finally broken the falling resistance and even retested the breakout zone. This setup often leads to a strong trending move.
Why this setup is special?
Price respected support multiple times, showing heavy demand from lower levels.
Breakout + Retest makes it one of the most reliable continuation patterns.
Risk–Reward is highly favorable for both short-term and positional traders.
Levels to Track:
Currently, the best accumulation zone lies between 8000–8155 , which gives a low-risk entry point. On the upside, the immediate short-term target is around 8446 , while the medium-term level aligns with the previous ATH near 9115 . If momentum sustains, the stock even has potential to reach the positional target of 9774 . For risk management, traders can keep a short to medium-term stop loss at 7788 , while positional traders may consider a wider SL at 7522 .
Rahul’s Tip:
Such breakouts don’t come often. Once the retest is done, the real rally usually begins. Traders who wait too long often end up chasing the move at much higher prices.
If you want to catch these setups before they take off, make sure you follow closely — (Analysis By @TraderRahulPal, TradingView Moderator). More analysis & educational content is shared regularly on my profile. Sometimes one breakout can change your trading month completely. If this helped you, don’t forget to like and follow for regular updates.
Disclaimer:
This analysis is for educational purposes only and should not be taken as financial advice. Please do your own research or consult your financial advisor before investing.

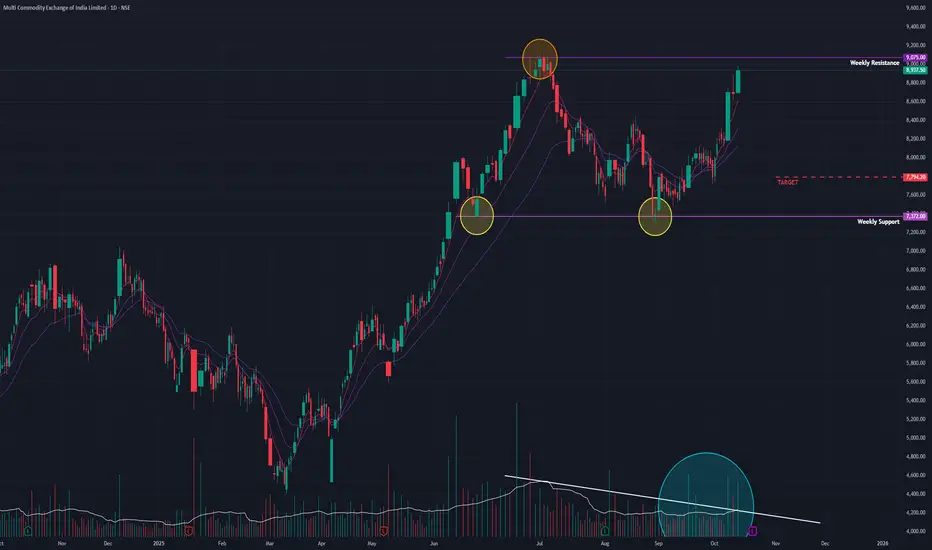
MCX (D) - Gathers Steam for All-Time High BreakoutMulti Commodity Exchange of India (MCX) is showing strong bullish momentum as it closes in on its all-time high. After a period of healthy consolidation, today's positive price action suggests the stock is preparing to challenge its key resistance level.
The Context: Consolidation Below the Peak
Following a strong bullish uptrend, MCX entered a sideways consolidation phase in June 2025. It registered a new All-Time High (ATH) in July 2025 , which established a formidable resistance level that has capped all subsequent rallies.
Today, the stock showed renewed strength with a solid gain of +2.87% on good volume. This move has pushed the price to less than 2% below its ATH resistance , placing it on high alert for an imminent breakout attempt.
Underlying Technical Strength
The potential for a breakout is strongly supported by key technical indicators across multiple timeframes (Monthly, Weekly, and Daily):
- EMA Crossover: The short-term Exponential Moving Averages (EMAs) are in a bullish positive crossover state.
- Rising RSI: The Relative Strength Index (RSI) is rising, confirming that momentum is building.
These indicators suggest a broad-based strength that could fuel a move to new highs.
Outlook and Key Levels
The immediate path for MCX will be determined by its interaction with the ATH resistance.
- Bullish Breakout Scenario: A decisive close above the all-time high on strong volume would confirm a breakout and signal a continuation of the primary uptrend. The next potential target in this scenario would be the ₹10,800 level.
- Potential Pullback Scenario: If the stock fails to breach the resistance and loses momentum, it could pull back to test the lower end of its consolidation range, with the primary support level at ₹7,800 .
In conclusion, MCX is coiled for a potentially significant move. The focus in the coming days should be squarely on the price and volume action at the all-time high resistance, as a breakout here would be a major bullish signal.
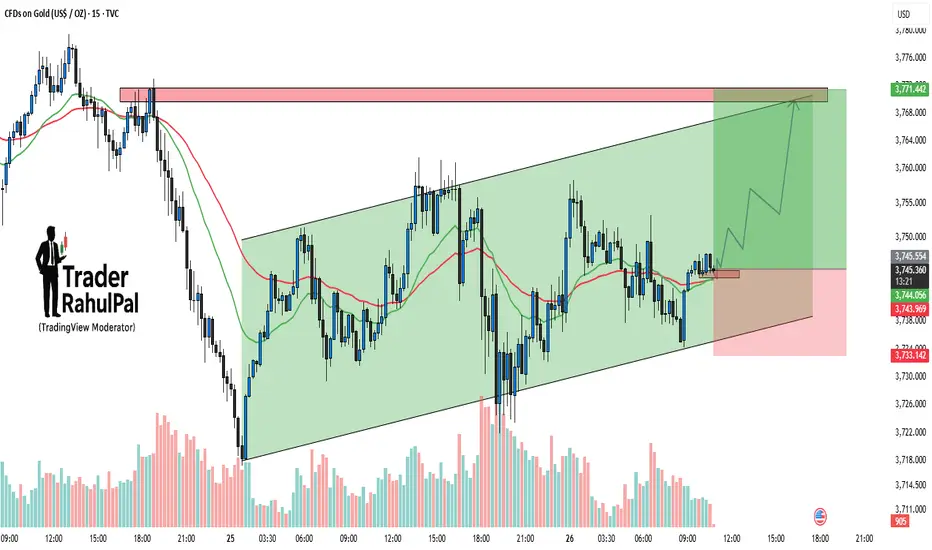
Gold – Channel Support Holding, Upside Target Towards 3770Gold is trading within a well-defined ascending channel on the 15-min chart. Price action has repeatedly respected both support and resistance lines, which makes this pattern highly reliable in the short term. Currently, the price is bouncing from the lower channel support and holding firmly above the 3740–3743 zone. As long as this support area is protected, the bullish momentum remains intact and the next upside target comes in around 3770, aligning with the channel resistance. A breakout above 3770 could trigger an even stronger rally, while a failure to hold below 3733 would invalidate the setup and shift the bias to the downside.
Disclaimer: This analysis is for educational purposes only and should not be taken as financial advice. Please do your own research or consult your financial advisor before investing.
Analysis By @TraderRahulPal (TradingView Moderator) | More analysis & educational content on my profile
👉 If you found this helpful, don’t forget to like and follow for regular updates.
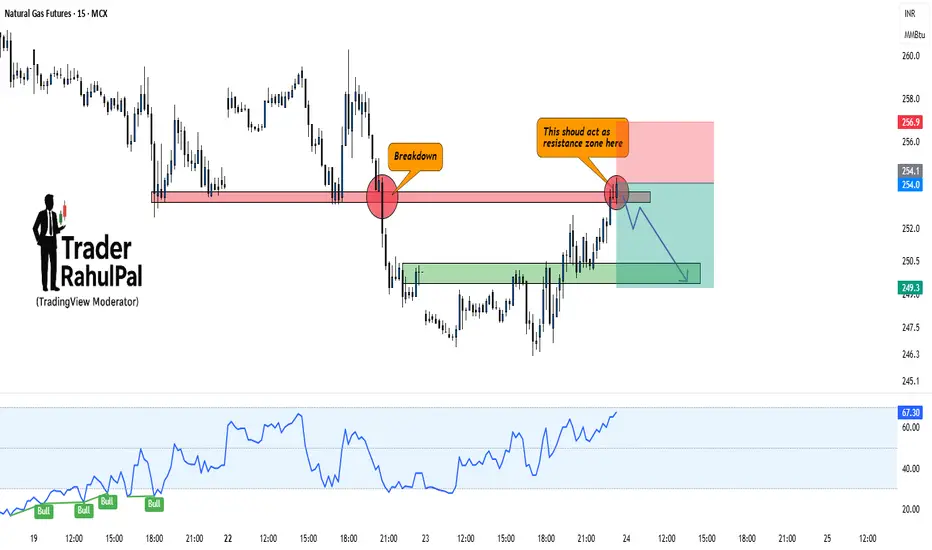
Natural Gas – Breakdown Retest Could Trigger Fresh FallHello everyone, Let's analyse Natural Gas and it has recently broken down from a key support level, turning it into resistance. The price is now retesting that zone, and unless bulls manage to reclaim it strongly, the downside remains the higher probability.
Current Setup:
Previous support around 254–256 has turned into a resistance zone.
Breakdown already confirmed with strong bearish candles.
RSI is still holding higher, but momentum may fade if resistance rejects.
Fresh downside targets can open toward 249–247 zone if rejection plays out.
Only a strong close above 257 will negate this bearish view.
Disclaimer: This analysis is for educational purposes only and should not be taken as financial advice. Please do your own research or consult your financial advisor before investing.
Analysis By @TraderRahulPal (TradingView Moderator) | More analysis & educational content on my profile
👉 If you found this helpful, don’t forget to like and follow for regular updates.
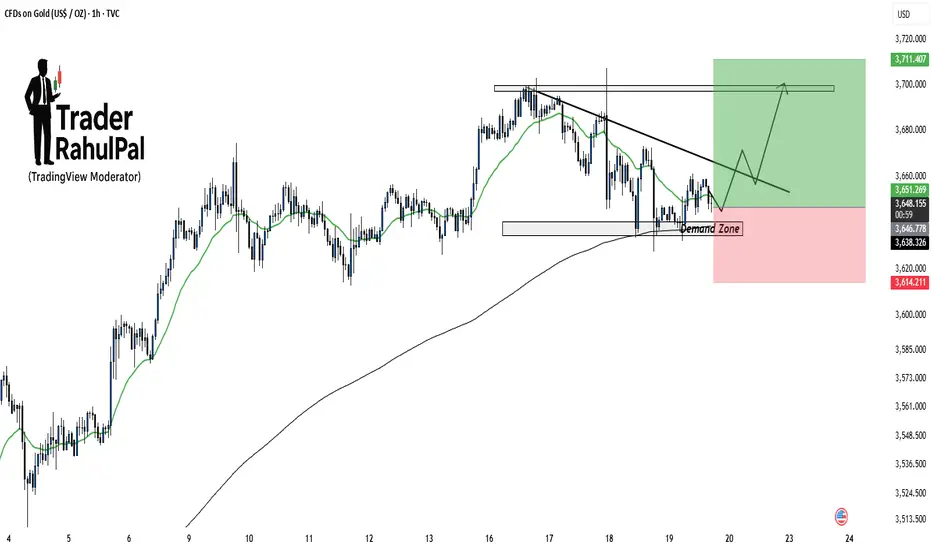
Gold Demand Zone Holding – Upside Potential Toward 3710!Gold is currently testing a demand zone around 3640–3650 , which aligns well with moving average support. As long as this zone holds, price action favors a potential bounce toward the falling trendline and eventually the key resistance area near 3710 . Short-term buyers may look for confirmation inside the demand zone before positioning, while a breakdown below 3614 would invalidate this setup.
Disclaimer: This analysis is for educational purposes only and should not be taken as financial advice. Please do your own research or consult your financial advisor before investing.
MCX Silver Ready For Big Dhamaka - Neal Bhai ReportsMCX Silver Prices Ready For Big Dhamaka, What you think up or down? - Neal Bhai Reports
Gold Faces Resistance, Buyers Should Stay Alert near Key SupportGold Futures (MCX) Analysis: Key Points to Watch
Current Price Range: Gold Futures are trading around ₹98,700 to ₹98,750.
Resistance Zone: Gold has been repeatedly rejected near its high around ₹101,500, showing strong selling pressure at this level.
Trendline Broken: Recently, gold broke an important upward trendline that had acted as a reliable bounce-back support.
Key Support Emerging: After this break, a key support level has appeared around ₹97,700 to ₹97,750. This zone will be important to watch for potential price stabilization.
Additional Support Levels: The chart also highlights other support zones that could provide buying interest if prices decline further.
Trader Outlook: Buyers need to remain cautious and vigilant at these levels. The market shows signs of short-term weakness, and how gold behaves around these supports will be crucial for the next move.
Gold is at a critical juncture where it faces both selling pressure and key supports. Watching the reaction around ₹97,700-₹97,750 will help gauge whether bulls regain control or further correction unfolds. Stay alert and manage risk carefully.

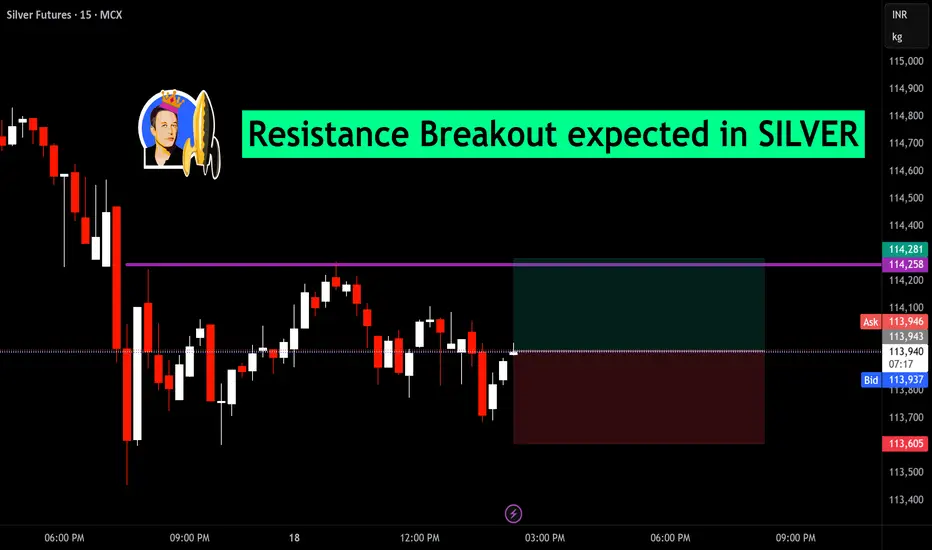
Resistance Breakout expected in SILVERilver Futures (MCX) are approaching a key resistance zone at ₹114,258. Price action shows multiple tests of this level, suggesting strong buying interest and a potential breakout. If this resistance is cleared, bullish momentum may accelerate, offering an attractive long opportunity for traders. Risk management is crucial; consider placing stops below recent support to protect capital. Monitor for confirmation through sustained price action above the resistance and increased volume. This set-up highlights evolving strength in silver and could pave the way for a further move higher. This analysis is for educational purposes and not investment advice.
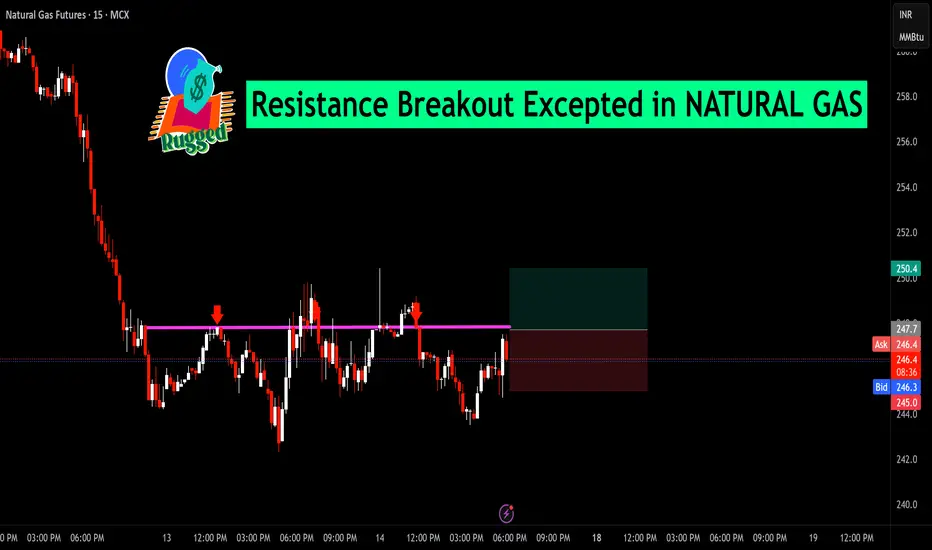
Resistance Breakout Excepted in NATURAL GASNatural Gas has been consolidating just below a key resistance level around ₹247–₹248, with multiple rejection points in recent sessions (marked by red arrows). The current price action shows renewed buying pressure, with candles testing the resistance zone once again.
Technical View:
The horizontal resistance has acted as a strong supply zone multiple times.
A decisive breakout and close above ₹248 could open the path for further upside momentum.
Immediate support is placed near ₹244.20, which serves as a stop-loss reference for breakout traders.
Trading Perspective:
If price sustains above the resistance level with volume confirmation, the breakout could trigger a short-term bullish move toward higher targets. However, failure to hold above this zone may lead to another pullback within the range.
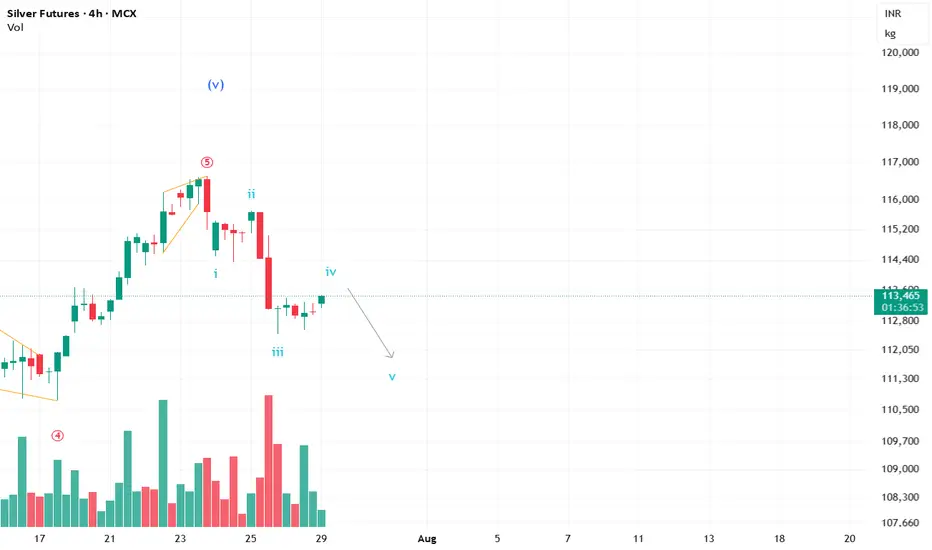
#Silver up for another short sell move?Silver is currently completing the 4th wave and may witness a down move in the short term. Keeping my eyes glued. :)
**This is an educational market outlook, not investment advice. Please consult a SEBI-registered advisor before taking any investment decisions.**
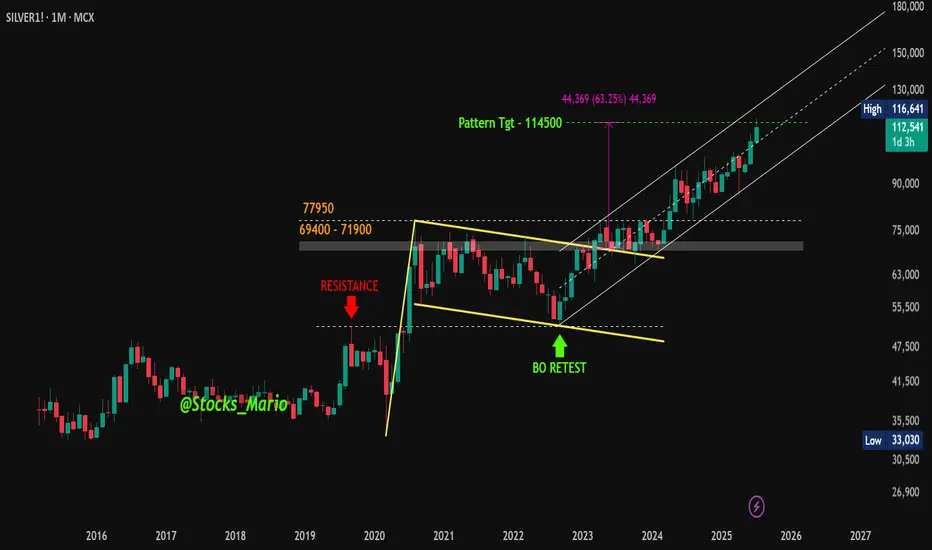
MCX Silver Powers Through Pattern Targets – Momentum Continues#Update | #MCXSilver
On Dec 27, 2022 , we identified a bullish flag pattern when Silver was trading around 69,845 . A follow-up update was shared on Apr 4, 2025 , with prices near 87,878 .
Since then, MCX Silver moved up and touched a high of 1,16,641 on Jul 14, 2025 , meeting the projected zone of the earlier chart pattern — a move of 67% from the initial post and +32% from the April update.
At present, Silver is trading within an ascending channel on the long-term charts — a structure often associated with a sustained trend.
Stay tuned — this could just be the beginning!
⚠️ This is a technical observation shared for educational purposes only. Not a buy/sell recommendation. Please consult your financial advisor before making any trading decisions.
#Silver | #MCX | #TechnicalAnalysis | #PriceAction | #Commodities | #TrendAnalysis | #ChartPatterns
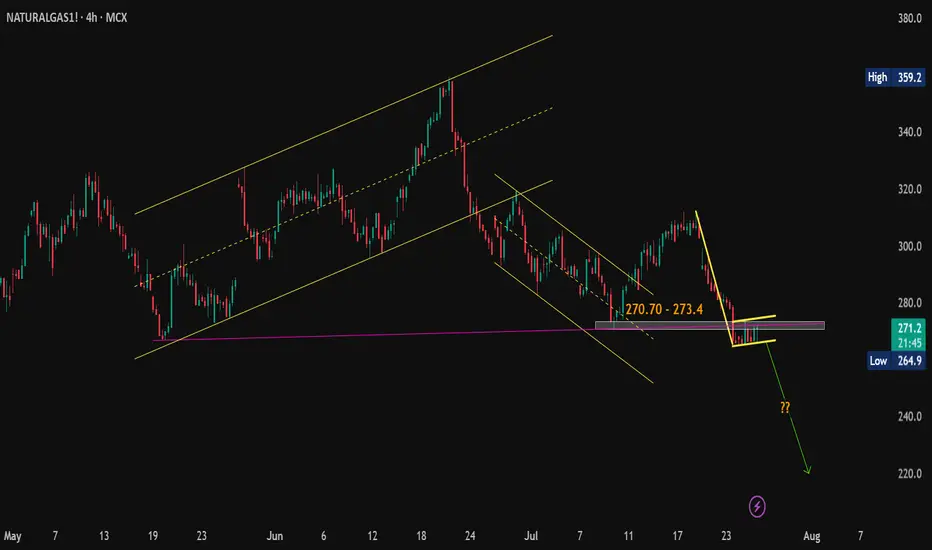
Natural Gas Technical Breakdown Ahead? Eyes on the 264.90 Mark#Commodity
#NaturalGas View:
CMP: 271.70
🔹 Resistance Levels:
• 270.70 – 273.40
• 275.00
• 284.00
🔹 Support Level:
• 264.90
Technical View:
Natural Gas seems to be forming a bearish flag pattern on the hourly & 4 hours chart. The price is currently facing resistance at the pink trendline breakdown level. While it's still early for confirmation, a decisive hourly close below 264.90 may validate the pattern and open the door for further downside. If the pattern plays out, a possible target zone around 220 could be in sight.
📌 Note: This is a technical analysis view shared for educational purposes only and not a recommendation to buy/sell. Always consult your financial advisor before making any trading decisions.
#Commodity | #NaturalGas | #MCX | #PriceAction
Is the move over for Silver? #CommodityIt looks like the impulse for Silver is about to end. However, we still need the price action to confirm the view.
**This analysis is based on the Elliott Wave Principle.
This analysis is for educational purposes only and not investment advice.
Please consult your SEBI-registered advisor before making any investment decisions. Markets are subject to risk.**
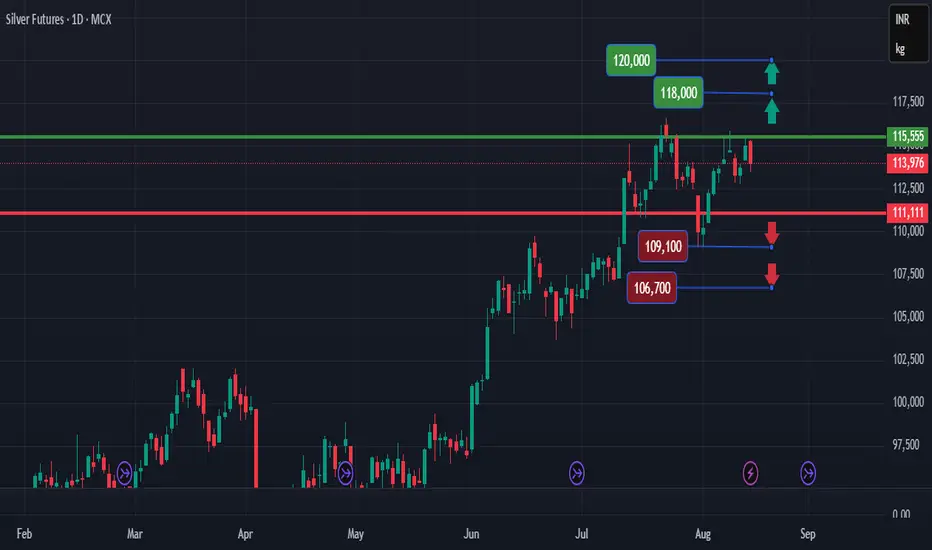
Silver at Strong Support Level: Ideal Buy with Targets up to 12Silver has a level that is a strong potential support. Personally, I have been waiting for a retest of this level (87580) for quite some time. It is advisable to buy at this level.
From here, potential targets appear to be 96400, 100900, 102700, 106500, 120000, and 125000.
