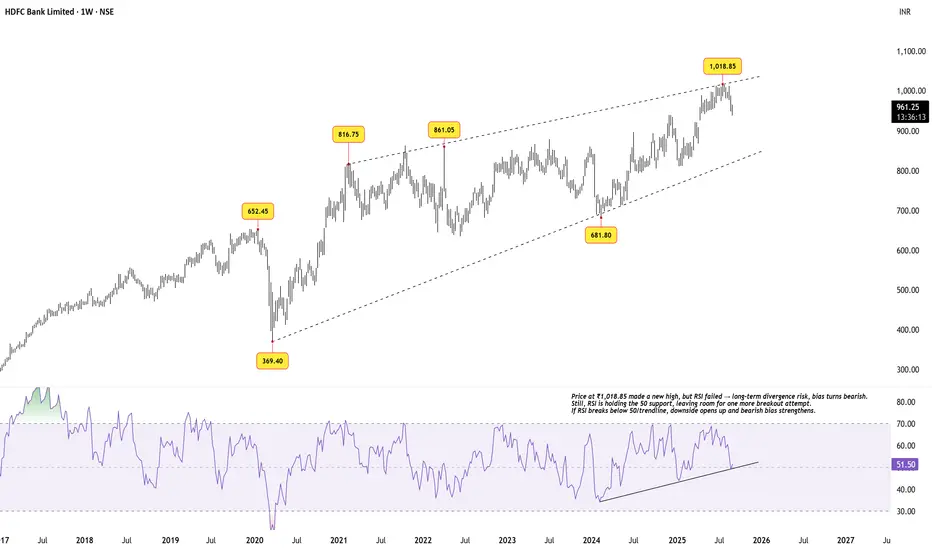
HDFC Bank – Rising Megaphone & RSI DivergencePrice structure since 2020 has unfolded inside a broadening rising channel (megaphone type). The latest high at ₹1,018.85 came right at the upper boundary.
Price action: A fresh high was made, but momentum did not confirm.
RSI: Long-term bearish divergence is visible – each new price high comes with weaker RSI peaks. Still, RSI is holding above the 50 zone and its rising trendline.
Implications:
If RSI holds above 50, bulls may attempt another breakout above ₹1,018.85.
If RSI breaks
Megaphonepattern
GBPNZD - WATCH THE MEGAPHONE FOR A POTENTIAL DROPSymbol - GBPNZD
CMP - 2.2790
GBPNZD is currently forming a megaphone pattern and is trading near its upper boundary which is a resistance area. This pattern, characterized by increasing volatility and wider price swings, suggests potential reversal points in the market. A false break of resistance may occur before a potential price drop from the trendline resistance area.
On the daily chart, the overall structure appears ready for a bearish reversal, with market dynamics influenced by broader
Godrej Industries buy or not Hello Everyone, today i am again back with a new idea on Godrej Industries. As you can see after a long downtrend it sustained and made a megaphone and broke it for upwards and took retest and ended it with a very bullish candle. Thank you so much and do follow us and like this post
Mega Phone Chart Pattern Price already breakout the Mega Phone Chart Pattern and Consolidate above the Pattern Boundary .
TLong
Megaphone Pattern plotted on MothersonsumiMotherson sumi is showing an intresting megapone pattern at a resistance zone with RSI indicating a -ve regular divergence . If the pattern manifestes we can see prices falling upto 244 levels .
MShort
MegaPhone PatternWhat is Megaphone Pattern?
Megaphone pattern is a pattern which consists of minimum two higher highs and two lower lows. The pattern is generally formed when the market is highly volatile in nature and traders are not confident about the market direction. Normally this pattern is visible when the market is at its top or bottom. The greater the time frame is better the pattern will work. However, traders love this pattern when it is formed in a daily or weekly time frame.
Key Points :-
* Meg
Megaphone Top in Bajaj Finance Daily.The chart pic above clearly shows a megaphone top formation on Bajaj Finance Daily Charts.
The arrows marked explains the probable trend. One needs to trade as per the price action upon Breakout above the trendline within the pattern or breakdown below the pattern support.
Bajaj Finance - Megaphone PatternBajaj Finance has formed a Megaphone Pattern. This is a very volatile script. Breakout already happened. Now when it retest the trend line buy at 4430 with stop loss 4280 for huge targets of 5140 and 5580.
Bajaj Finance after crossing All time high will become more volatile and will achieve the target in shorter time.
Megaphone Pattern Breakout Traders:
When the price breakout the trend line after making the 5th or 7th swings and closes outside the pattern, a breakout is confirmed. Breakout may happen in positive or in a negative direction. Depending upon the market condition and the position of the pattern in the chart, bullish and bearish happens.