BUYER FOMO: BREAK ALL THE RULES📌 GOLD – Trading Plan OANDA:XAUUSD
Follow Signals On weekend Linda published you got SELL PLAN 3720 +120PIPS
Absolutely that up first down after:
1. Market Context (H1)
Main trend: Bullish (following several upward BOS).
The price has just broken the peak and created new liquidity above the 3715 – 3720 zone.
Below, there are CP Orders + FVG at 3693 / 3669 / 3650 → the price may retrace to test demand before continuing to rise.
Above: the 3749 – 3750 zone is a strong resistance, likely to see liquidity sweeps.
2. Main Scenario – BUY with the trend
Entry 1: CP ORDER + Trend Timing
Zone: 3693 – 3695.
Stoploss: 3685.
TP1: 3715.
TP2: 3730+.
R:R ratio: ~1:3.
Entry 2: Deeper CP ORDER
Zone: 3669 – 3670.
Stoploss: 3660.
TP1: 3710.
TP2: 3730+.
R:R: ~1:4.
Entry 3: Final FVG
Zone: 3650 – 3655.
Stoploss: 3640.
TP: 3710 – 3720.
This is the final entry; if it breaks, consider the trend reversed.
3. Alternative Scenario – SELL counter-trend (scalp)
Entry Sell
Zone: 3749 – 3750 (resistance + liquidity).
Stoploss: 3757.
TP1: 3730 – 3735.
TP2: 3695 – 3670 (if selling pressure is strong).
Confirmation required on M5/M15:
MSS down.
Bearish engulfing.
Long wick rejection.
4. Capital Management
Total risk for the day: max 3 – 4% of the account.
Each trade risk 1 – 1.5%.
Prioritize Buy, Sell is just a small scalp.
If the price hits TP1 → move SL to entry, let the rest run.
5. Notes
Main trend: Bullish, don't attempt too many counter-sells.
Only sell when clear signals appear at 3749 – 3750.
The 3693/3669 mark is a key zone → if it breaks strongly, wait for trend confirmation.
Metals

Gold 1H – Should We Hold or Fade Liquidity at 3800?On the 1-hour timeframe, gold is trading near 3,776 within a corrective channel. Premium liquidity remains clustered above 3,800–3,798, while discount demand is positioned at 3,725–3,727. Recent BOS (Break of Structure) signals confirm bullish intent, but engineered sweeps into premium zones are still likely before price retraces toward discount levels.
Today’s headlines on the Federal Reserve’s cautious approach and ongoing geopolitical tensions in the Middle East are reinforcing safe-haven demand. However, intraday volatility may continue to produce liquidity grabs before clear direction is established.
________________________________________
📌 Key Structure & Liquidity Zones (1H)
• 🔴 SELL GOLD LIQUIDITY 3,800–3,798 (SL 3,807):
Premium resistance where liquidity sweeps may cause rejections towards 3,770 → 3,760 → 3,755.
• 🟢 BUY ZONE 3,725–3,727 (SL 3,720):
Discount demand in line with BOS, with upside targets at 3,740 → 3,760 → 3,775.
________________________________________
📊 Trading Ideas (Scenario-Based)
🔻 Sell Setup – Liquidity Run (3,800–3,798)
• Entry: 3,800–3,798
• Stop Loss: 3,807
• Take Profits:
o TP1: 3,770
o TP2: 3,760
o TP3: 3,755
🔺 Buy Setup – Discount Demand (3,725–3,727)
• Entry: 3,725–3,727
• Stop Loss: 3,720
• Take Profits:
o TP1: 3,740
o TP2: 3,760
o TP3: 3,775+
________________________________________
🔑 Strategy Note
With the Fed’s cautious stance and geopolitical risks supporting gold, the broader bias remains buy-the-dip. At the same time, fading engineered sweeps into premium liquidity zones can offer tactical short-term opportunities. Expect volatility around 3,800 liquidity runs before retracements into well-defined discount zones.

LiamTrading – XAUUSD H1LiamTrading – XAUUSD H1: Adjustment structure formed, awaiting confirmation below 3685
After the surge to 375x, gold is entering a correction phase in line with the structural pattern. On H1, the price clings to the upper edge of the rising wedge, with RSI cooling off from overbought levels, indicating that supply pressure is starting to dominate. Today's plan focuses on the adjustment structure, prioritising selling upon confirmation signals.
Key price zones (as per the attached chart)
Sell strong resistance 3775–3785: confluence of channel top + 2.618 extension. Look for weakening reactions to initiate short/medium-term sell orders.
Buy zone volume 3726–3720: a thin support area providing momentum for a rebound. Holding this zone could push the price to retest 3750–3775; conversely, losing 3720 may lead to a deeper decline.
Resistance + FVG 3715–3698: as the price drops, this area turns into supply; a failed retest here is an early signal for further decline.
Confirm sell 3688–3685: closing H1 below this zone confirms a short-term downtrend, targeting a lower buy zone.
BuyZone 3652–3646: confluence of channel bottom + old liquidity, expecting a strong bullish reaction if revisited.
Reference trading scenarios (adhering to risk management)
Sell reaction at peak: 3778–3783, SL 3792, TP 3755 → 3738 → 3722.
Sell on confirmation: wait for H1 to close below 3685, enter sell 3684–3682, SL 3696, TP 3673 → 3656 → 3648.
Buy scalp by volume: 3726–3720, SL 3715, TP 3738 → 3750 (only short-term if the larger structure remains corrective).
Buy swing at strong zone: 3652–3646, SL 3639, TP 3673 → 3698 → 3712 → 3740.
Operational notes
Prioritise waiting for rejection/closing signals at the mentioned zones; avoid chasing orders in between.
Order volume should be allocated according to confirmation levels (confirmation zone < breakdown < failed retest).
Avoid excessive leverage; adjust SL according to structure when in profit.
This is a personal perspective, not an investment recommendation. If you want the quickest updates on the next XAUUSD scenarios, follow me and join my community for discussions.

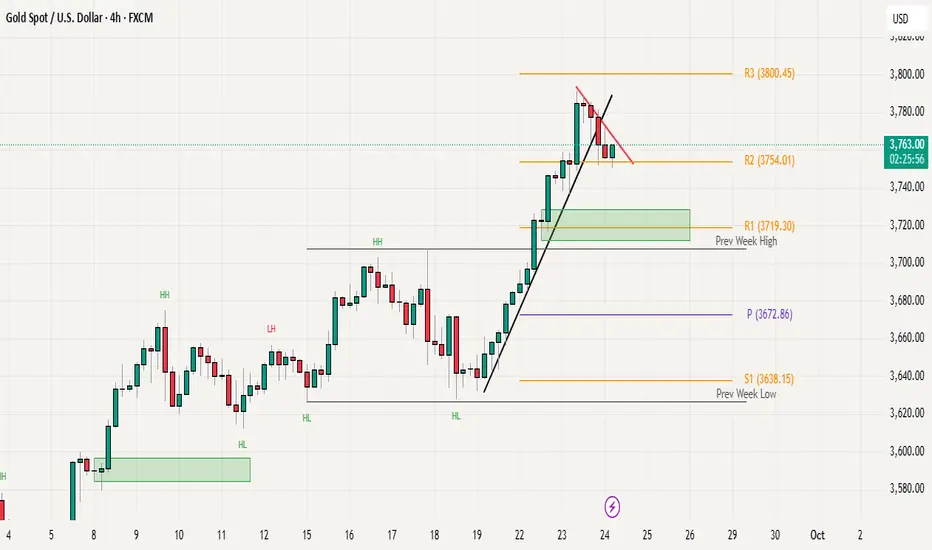
Gold Price Action: Trendline Break but Bulls Still in ControlGold posted a fresh all-time high yesterday near 3790 before entering a healthy pullback phase after an extended intraday rally. The higher-timeframe structure remains constructive, with the market still maintaining its higher-highs and higher-lows sequence. However, price action has broken below the rising trendline support we discussed in yesterday’s update, signaling a short-term pause in momentum.
At the moment, gold is consolidating just above R2 (3754), which continues to act as an important intraday support. For bulls to regain momentum and extend the rally, price needs to break above the declining red resistance trendline and sustain above the 3790–3800 zone. A breakout here could open the door for further upside continuation.
On the other hand, a confirmed H4 close below 3750 could invite deeper profit-taking, with the 3700–3710 area (previous week’s high) remaining the key demand zone and primary downside support.
Overall, the broader trend remains bullish, but price action is currently in a consolidation phase. Watching for either a breakout above resistance or a close below 3750 will provide clarity on the next directional move.
Gold Neowave Forecast
Update Type- Intraday
Yesterday wave-((iii)) Completed at the top, currently we are in wave ((iv))
after blue (a)(b)(c), market will continue the previous buy cycle for wave-((v))..
we will see after the structure we should buy or not
Learn More about trend here

Gold Prices Continue to Rise Amid Rate Cuts and Geopolitical RisGold prices today are being strongly supported by growing expectations that the Federal Reserve (FED) will continue to cut interest rates and the increasing demand for safe-haven assets amid rising geopolitical instability.
Last week, the FED made its first rate cut of 0.25% since December, causing gold prices to surge. While some investors took profits, most experts believe the uptrend is not over yet.
This week, investor focus will be on the U.S. Personal Consumption Expenditures (PCE) data for August, the FED's preferred inflation measure, which may provide further clues about future rate cuts. Many forecasts predict a slowdown in core PCE, reinforcing the case for continued rate cuts by the FED.
Additionally, safe-haven flows are further supported by prolonged geopolitical risks, including the Russia-Ukraine conflict and concerns over economic impacts from U.S. tariffs.
Furthermore, strong gold buying activity from global central banks plays a crucial role in strengthening the bullish outlook for the precious metal.

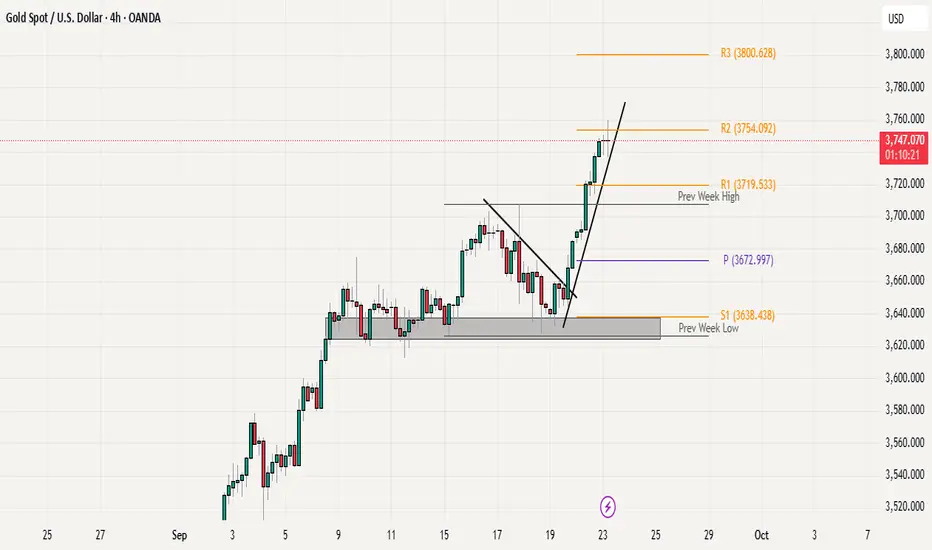
Bullish Momentum Intact: Watching R2 for continuation or pause Gold continued its upside momentum after a clean breakout above the previous week’s high, leading to a strong one-way rally towards the weekly R2 level at 3754. At the moment, price is holding well above the rising trendline, showing no signs of major rejection or reversal. The immediate resistance remains at weekly R2, and a sustained break above this level could open the door for a move towards weekly R3 around 3800.
The overall structure is still bullish, with higher highs and higher lows firmly intact. For any meaningful correction to take place, price would first need to break below the rising trendline. A deeper retracement would require price to trade back under the previous week’s high, which would then shift the short-term bias toward the weekly pivot zone near 3672. Until then, dips are likely to be seen as buying opportunities.
XAUUSD – Wolfe Waves forming on H4 chart, clear correction signaHello Trader,
On the H4 chart, gold is forming a quite standard Wolfe Waves pattern. The 5th wave has completed, and the price is moving into the crucial resistance zone of 3760 – 3770, which is also a potential Sell Zone. Given the current structure, the preferred scenario is a short-term downward correction before the main trend resumes.
Technical Analysis
The price has touched the 2.618 Fibonacci Extension and reacted with a decline, indicating profit-taking pressure.
The MACD still shows the previous buying force was quite strong, but the histogram is starting to weaken, aligning with the possibility of a correction wave emerging.
Area 3760 – 3770: a critical resistance zone, also coinciding with the 5th wave line of Wolfe Waves.
Trading Scenario
Sell order according to Wolfe Waves
Entry: 3760 – 3770
SL: 3782 (above resistance zone)
TP: 3710 -3660 -3610 – 3620 (key level Wolfe target)
Sell when price confirms below trendline
Entry 3727-3730
sl 3735
tp 3715-3700-3686-3665
Short-term Buy Scalping
Entry: 3705 – 3708
SL: 3700
TP: 3720-3730 – 3745- 3766
Note: This is just a short-term retracement strategy, going against the correction, so risk management is crucial.
Conclusion
Short-term: Prioritise observing reversal signals at 3760 – 3770 to Sell.
Medium-term: Wait for Buy opportunities around 3564 – 3574 to align with the main trend.
The market is entering a distribution and correction phase, so patiently waiting for candle confirmations at key zones will be key to optimising entry.
This is the Wolfe Waves scenario I propose for gold during this period. You can refer to and adjust according to your own strategy.
Follow me for the fastest updates when the price structure changes.

Gold 1H – Fed Signals & Geopolitics Keep Bulls on the MoveGold on the 1H timeframe is trading around 3,705–3,710 after a strong breakout, staying within a rising channel. Liquidity is concentrated above at the premium resistance zone near 3,716–3,718, while demand is positioned lower at 3,687–3,689 and deeper at the FVG zone 3,654–3,656. Recent dovish signals from the Fed following last week’s rate cut, coupled with rising geopolitical tensions, continue to bolster safe-haven demand. However, upcoming U.S. inflation data and Fed speakers could trigger engineered moves into premium supply before retracements into discount demand zones.
________________________________________
📌 Key Structure & Liquidity Zones (1H):
• 🔴 SELL ZONE 3,718–3,716 (SL 3,725): Premium resistance where liquidity sweeps may cause short-term rejections targeting 3,710 → 3,700 → 3,690.
• 🟢 BUY ZONE 3,687–3,689 (SL 3,680): Near-term demand zone aligned with channel structure, offering a pullback entry targeting 3,695 → 3,700 → 3,715+.
• 🟢 FVG BUY ZONE 3,654–3,656 (SL 3,647): Deeper discount support, attractive for longer setups targeting 3,670 → 3,685 → 3,700+.
________________________________________
📊 Trading Ideas (Scenario-Based):
🔺 Buy Setup – Pullback to Demand (3,687–3,689)
• Entry: 3,687–3,689
• Stop Loss: 3,680
• Take Profits:
TP1: 3,695
TP2: 3,700
TP3: 3,715+.
🔺 Buy Setup – FVG Sweep (3,654–3,656)
• Entry: 3,654–3,656
• Stop Loss: 3,647
• Take Profits:
TP1: 3,670
TP2: 3,685
TP3: 3,700+
🔻 Sell Setup – Premium Liquidity Run (3,716–3,718)
• Entry: 3,718–3,716
• Stop Loss: 3,725
• Take Profits:
TP1: 3,710
TP2: 3,700
TP3: 3,690.
________________________________________
🔑 Strategy Note
The Fed’s dovish stance and safe-haven flows from geopolitical risks are sustaining bullish momentum, but intraday structure suggests smart money may first engineer stop-runs into premium resistance before retracing toward demand. Maintain buy-the-dip bias at defined support zones, while cautiously fading liquidity sweeps near 3,716–3,718. Volatility could increase as markets await fresh U.S. inflation data and Fed policy remarks.

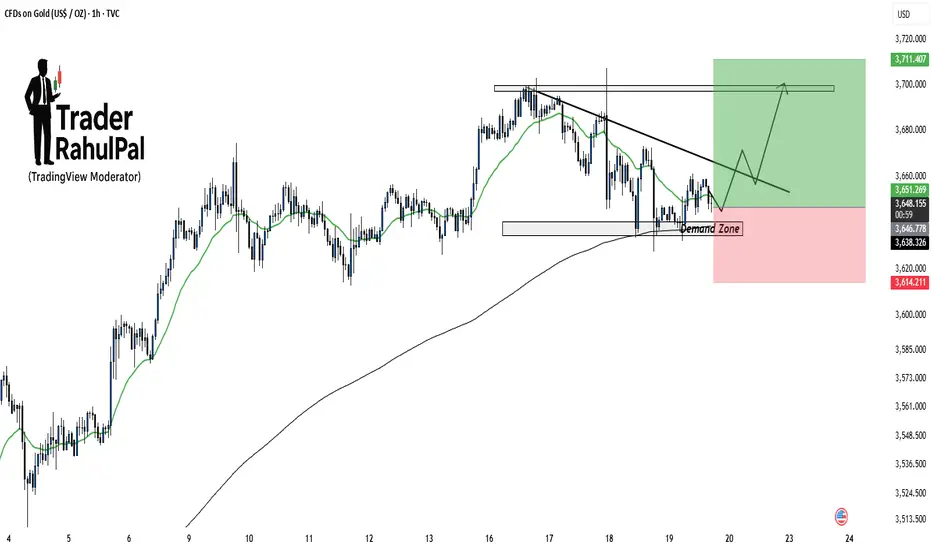
Gold Demand Zone Holding – Upside Potential Toward 3710!Gold is currently testing a demand zone around 3640–3650 , which aligns well with moving average support. As long as this zone holds, price action favors a potential bounce toward the falling trendline and eventually the key resistance area near 3710 . Short-term buyers may look for confirmation inside the demand zone before positioning, while a breakdown below 3614 would invalidate this setup.
Disclaimer: This analysis is for educational purposes only and should not be taken as financial advice. Please do your own research or consult your financial advisor before investing.
GOLD WEEKPLAN: UP FIRST DOWN AFTEROANDA:XAUUSD Footprint Analysis
The Footprint chart provides a more detailed view of the order flow. Here are some key points:
Price Pullback: The recent candles show a decrease in buying pressure (green) and an increase in selling pressure (red).
Volume Footprint: The trading volume (Total) and Delta (the difference between buying and selling pressure) on each candle show the order distribution.
The candle on the 19th has a negative Delta (~ -5.96 K), indicating that selling pressure is dominant, which aligns with the corrective pullback.
However, there's no major volume divergence, suggesting that this may only be a typical correction.
Detailed Footprint Analysis: The numbers within each candle show the number of buy orders (on the left) and sell orders (on the right) at each price level. When the price pulls back to the Imbalance or Strong OB zone, it's crucial to monitor the Footprint for signs of buying pressure returning (Delta turning positive or significant buying volume at key price levels), which would serve as a confirmation signal for a long entry.
OANDA:XAUUSD General Analysis
The XAUUSD market is in a strong uptrend, confirmed by the market structure:
Higher Highs (HH): Each new peak is higher than the previous one.
Higher Lows (HL): Each new trough is higher than the previous one.
Recently, the price created a Break of Structure (BOS), breaking the previous high, which indicates a continuation of the uptrend. After the BOS, the price established a new high (HH) and is now making a corrective pullback to find a strong support zone before continuing its upward momentum.
Imbalance (Fair Value Gap - FVG): This is a liquidity void created when the price moves too quickly. According to SMC theory, the market tends to return to fill this gap.
Location: The price range is from ~$3660 to ~$3670 USD.
Significance: This zone could act as a temporary support level. If the price returns to this area, it might fill the Imbalance and then continue to rise.
Strong OB (Order Block): This is a large block of orders left behind by "Smart Money" and often serves as a strong support or resistance zone.
Location: The price range is from ~$3645 to ~$3655 USD.
Significance: This is the strongest support zone to consider for a long entry. The price is likely to pull back to this area, tap into the order block, and then bounce back up to continue the trend.
Additionally, there are two important liquidity zones to note:
Buy Side Liquidity ($$$): Located above the most recent high (~$3700 USD). The price has the potential to move up to sweep this liquidity.
Sell Side Liquidity ($$$): Located below the most recent low (~$3620 USD). This zone could be swept if there is a sharp market drop, but it's highly likely that the price will respect the bullish structure and not break this low.

LiamTrading – XAUUSD Trading Scenario for TodayGold continues its robust upward momentum and is now approaching the critical resistance zone around 3,697 – 3,700. This is a confluence point with the Fibonacci extension level and also a zone where sellers might re-enter strongly.
Technical Analysis
On the H1 chart, the price has tested the resistance zone multiple times but hasn't broken through decisively. This indicates that profit-taking pressure is emerging.
The sell confirmation zone will form if the price breaks below 3,685 – 3,686, at which point the correction target could be around 3,673.
The main Buy Zone is located at 3,650 – 3,645, coinciding with previous support and a strong liquidity area. This is a region where a price increase reaction is likely.
Further down, the 3,628 – 3,630 zone is considered solid support on the larger frame, and if retested, it will be a long-term buying opportunity.
Conversely, if the price decisively surpasses the strong resistance zone of 3,720 – 3,730, the upward trend will be confirmed to continue, opening up higher targets around 3,750+.
Trading Plan Reference
Short-term sell around 3,697 – 3,700, SL 3,707, TP 3,686 – 3,673.
Short-term buy around 3,650 – 3,645, SL 3,640, TP 3,673 – 3,690.
Long-term buy around 3,628 – 3,630, SL 3,620, TP 3,660 – 3,690 – 3,720.
These are my personal views on XAUUSD, and you can use them as a reference to build your own plan. If you find this useful, follow me for the latest updates on new gold trading scenarios.

XAUUSD – Daily Trading Plan
Hello Traders,
Gold opened the Asian session holding its price structure firmly. The 3708 level will be the key pivot today:
If price sustains above this level, the next upside targets are 3750 and possibly 3780.
If price reacts lower at 3708 resistance, then 3650 or even 355x could be the zones to watch for buying opportunities.
Fundamental Context
Last week’s correction was triggered by comments from the Fed Chair on interest rate policy. The Fed does not intend to cut rates too frequently, and this week’s PCE data will play a decisive role in shaping the outlook.
Trading Strategy for Today
Buy Setup
Entry: 3650 – 3653
SL: 3645
TP: 3662 – 3675 – 3690 – 3706 – 3725
Sell Setup 1
Entry: 3700 – 3703
SL: 3708
TP: 3690 – 3675 – 3662 – 3650 – 3633
Sell Setup 2
Entry: 3738 – 3740
SL: 3746
TP: 3725 – 3710 – 3700 – 3675 – 3650
Summary
The preferred bias for today is to look for buy opportunities on dips, in line with the broader uptrend.
Follow me to receive the latest updates as soon as market structure changes

Gold Consolidating Near All-Time HighLast week Gold made a new all-time high around the 3707 level, and we have seen minor pullback after this high, leading to a pullback towards the 3620 -30 area. From there, the price bounced back strongly and is now trading close to the 3700 mark again. Currently, the market seems to be consolidating in a range between 3620 and 3700-07. The overall trend still looks bullish, but for the next clear direction, we need a strong higher time frame close either above 3700 for further upside or below 3600 for possible deeper correction.
Immediate resistance 3700-07
Weekly R1 3719
Weekly R2 3754
Pivot 3672 (As immediate support)
Weekly S1 3628

Gold Price Today: XAUUSD Sets Stage for Continued Bullish ExpansGold (XAUUSD) Market Report – September 21, 2025
Gold remains positioned near 3,685, with recent price behavior showing a structured climb despite short bursts of volatility. The market is cycling through phases of expansion and retracement, where each corrective leg has been followed by renewed upward momentum. This rhythm signals that buyers are steadily maintaining control of the broader trend.
The current setup reflects a market that is rebalancing efficiently. Short-term pullbacks are being absorbed quickly, keeping pressure aligned toward the upside. The sequence of structural shifts on the chart points to a continuation of this momentum, suggesting that higher valuations are within reach if the present flow persists.
Overall, gold’s tone is constructive, characterized by resilience and sustained demand. The pattern unfolding indicates a market preparing for further expansion, with the potential for continuation into higher ranges in the sessions ahead.

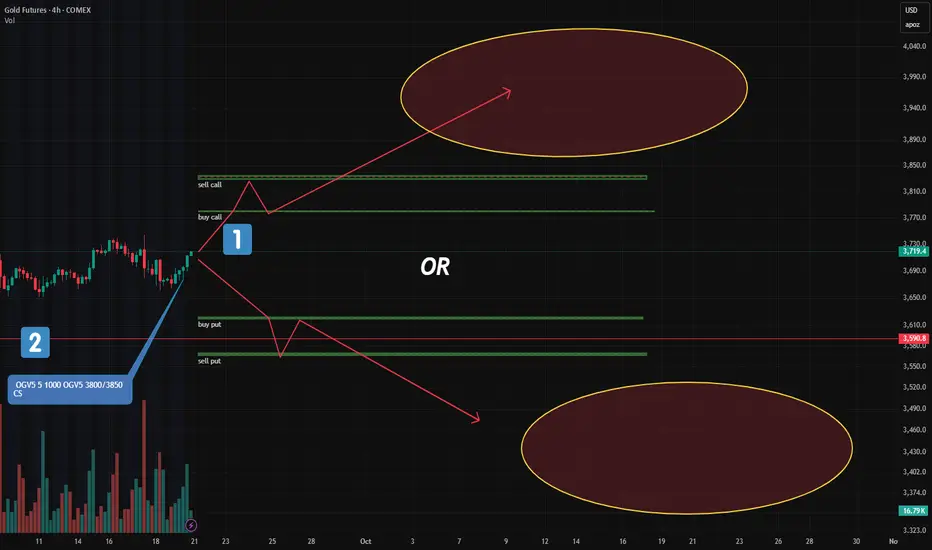
Gold: Major New Option Portfolios Signal Strong Moves AheadFriday’s CME report showed a surge in large option blocks in gold — two of them stand out.
🔹 1. "Long Condor" on December Futures (GCZ24)
This is the most significant structure added:
Targets a move below $3,620 or above $3,780
In other words: a breakout is expected, not consolidation
📌 Key point:
A "Long Condor" profits from volatility, not direction.
It wins if price moves sharply — up OR down — but loses if it stays flat.
🔹 2. Bull Call Spread (Oct Series): $3800–$3850
Another key play:
A classic bullish call spread at 3800/3850
Target: upside beyond current levels
But here’s the difference:
Unlike the "Long Condor", this one needs a clear upward move — and soon. Within a few days.
This isn’t about volatility.
It’s a directional bet that gold will rise.
🧠 Bottom Line:
One portfolio says: "Breakout coming — no matter which way."
Another says: "Gold goes up — and soon."
Are they aligned?
Contradictory?
Or could both win?
Trade smarter, not harder! Looking to boost your profits with valuable market insights and data-driven entry points? Join us or keep moving!
Gold Hits New Record: Should You Buy or Sell in This Hot Market?Namaste traders,
This past week, gold surprised everyone by closing strong. On Friday (19/09), it moved higher again, marking its 5th consecutive weekly gain at $3,683.24/oz, while futures touched $3,718.50/oz. This surge followed the Fed’s rate cut, which many thought would cool the yellow metal. So, is this a genuine rally or just a bull trap?
Fundamentals: Rate Cut Pushes Gold Higher
Lower interest rates reduce the cost of holding gold.
Fed’s dovish signals raised expectations for more easing.
In India, physical gold demand is at a 10-month high, while China also shows strong appetite despite higher prices.
Technical Outlook
Gold broke its downward trendline, signaling bullish continuation. Buyers are in control.
This Week’s View: Focus on buying near-term targets at $372x and $373x, but stay alert to macro news.
Trading Setups (with strict risk management):
Buy Scalp: $3671–$3669 | SL: $3666 | TP: $3674–$3694
Buy Zone: $3657–$3659 | SL: $3647 | TP: $3669–$3709
Sell Scalp: $3713–$3715 | SL: $3719 | TP: $3705–$3785
Sell Zone: $3731–$3733 | SL: $3741 | TP: $3723–$3683
Will gold shine brighter and set another all-time high? Share your view! 👇

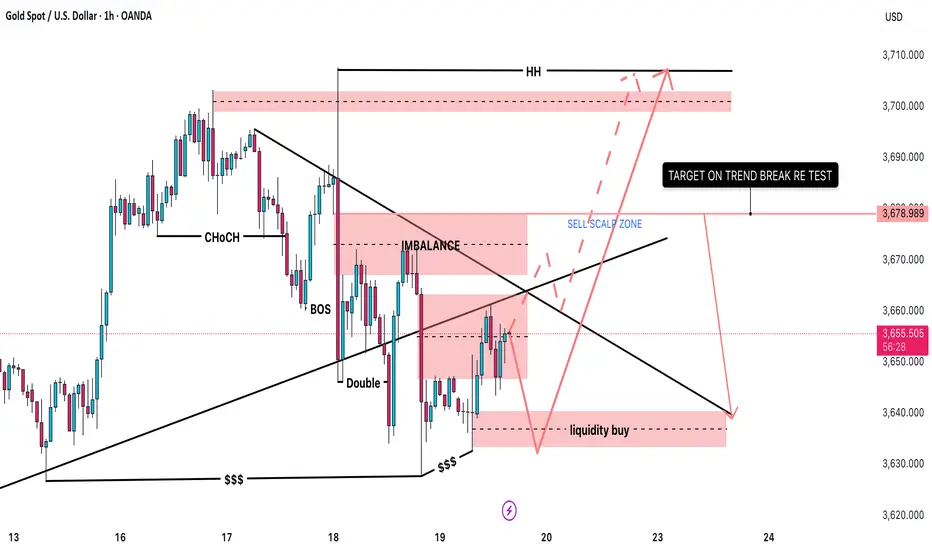
GOLD – Breakout / Swept High – Where to BUY?1. Market Overview
Gold prices are consolidating around 3655 – 3660 after showing a short-term bearish structure.
On the H1 chart, we can see clear supply and demand zones:
• Liquidity Buy Zone near 3640 (potential demand area).
• Imbalance / Supply Zone around 3670 – 3680.
The broader higher-timeframe trend is still bullish, but in the near term the market is retesting liquidity levels.
________________________________________
2. Key Levels & Zones
• Liquidity Buy Zone: 3640 – 3645 → important support.
• Sell Scalp Zone / Imbalance: 3670 – 3680 → short-term resistance.
• Higher High Target (HH): 3700 – 3710 → strong higher-timeframe resistance.
• Long-term Support: 3620 – 3630.
________________________________________
3. Main Trading Scenarios
🟢 Long Setup (with trend)
• Wait for price to revisit the Liquidity Buy Zone (3640 – 3645).
• If bullish reversal signals appear (pin bar, engulfing candle, etc.), consider entering a Long position.
🎯 Targets:
• Short-term: 3678 (trendline break retest).
• Mid-term: 3700 – 3710 (higher high).
🔴 Short Setup (scalp only)
• If price pushes into the Sell Scalp Zone (3670 – 3680) and faces strong rejection → take a Short scalp.
• 🎯 Target: 3640 – 3645.
⚠ Note: Shorts go against the main bullish trend, so they should be managed quickly and not held for long.
________________________________________
4. Trade Management Notes
• Focus on Long trades near support, as higher timeframe bias is still bullish.
• Short positions should only be taken as scalp setups near resistance.
• Risk control: limit risk to 1–2% per trade, avoid holding trades against the main trend.
________________________________________
📌 Conclusion
Gold (XAUUSD) is currently testing the descending trendline and resistance zone.
• A successful breakout may lead price towards 3700+.
• Otherwise, the market is likely to dip back into 3640 before starting the next bullish leg.

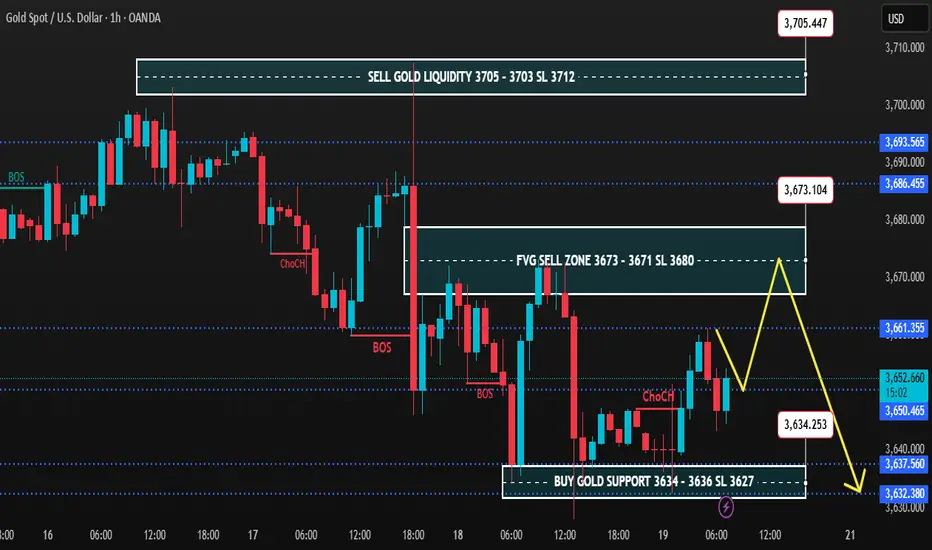
Gold 1H – Risk of Premium Sweeps Before ReversalOn the 1H timeframe, gold is consolidating after consecutive BOS and ChoCH signals, showing rejection from premium levels. The market is oscillating between the fresh FVG sell zone at 3,673–3,671 and the deep discount support at 3,634–3,636. Liquidity remains positioned above 3,705 and below 3,632, keeping scope for engineered sweeps before a clearer directional move emerges.
________________________________________
📌 Key Structure & Liquidity Zones (1H):
• 🔴 FVG SELL ZONE 3,673 – 3,671 (SL 3,680)
Premium intraday pocket for rejection, targeting 3,660 → 3,650 → 3,640.
• 🔴 SELL GOLD LIQUIDITY 3,705 – 3,703 (SL 3,712)
Major premium liquidity trap, likely to precede continuation lower towards 3,690 → 3,675 → 3,660.
• 🟢 BUY GOLD SUPPORT 3,634 – 3,636 (SL 3,627)
Discount demand zone, aiming for recovery towards 3,645 → 3,660 → 3,670 if defended.
________________________________________
📊 Trading Ideas (Scenario-Based):
🔻 Sell Setup – FVG Rejection (3,673–3,671)
• Entry: 3,673 – 3,671
• Stop Loss: 3,680
• Targets:
TP1: 3,660
TP2: 3,650
TP3: 3,640
👉 Expect engineered liquidity grab into the FVG before downside extension.
🔻 Sell Setup – Premium Liquidity Sweep (3,705–3,703)
• Entry: 3,705 – 3,703
• Stop Loss: 3,712
• Targets:
TP1: 3,690
TP2: 3,675
TP3: 3,660
👉 Smart money may sweep highs near 3,705 before resuming bearish leg.
🔺 Buy Setup – Discount Reversal (3,634–3,636)
• Entry: 3,634 – 3,636
• Stop Loss: 3,627
• Targets:
TP1: 3,645
TP2: 3,660
TP3: 3,670
👉 High risk-reward opportunity if gold defends discount demand; suitable for counter-trend scalps.
________________________________________
🔑 Strategy Note
Gold remains under pressure below 3,673–3,705, favouring short setups into premium sweeps. However, close attention is needed at 3,634–3,636, as buyers may attempt to accumulate and reclaim structure. Best practice: trade smaller lots until the New York session provides confirmation of direction.
GOLD - Breakout / Swept High appear - Where to BUY ? 🟡 OANDA:XAUUSD XAUUSD Daily Plan – September 19, 2025
1. Market Overview
Price is consolidating around 3655 – 3660 after forming a short-term bearish structure.
On H1, several supply & demand zones are highlighted:
Liquidity Buy Zone around 3640 (potential demand).
Imbalance / Supply Zone around 3670 – 3680.
The overall higher-timeframe trend remains bullish, but in the short term, the market is retesting liquidity areas.
2. Key Levels & Zones
Liquidity Buy Zone: 3640 – 3645 → key support.
Sell Scalp Zone / Imbalance: 3670 – 3680 → short-term resistance.
Higher High Target (HH): 3700 – 3710 → strong higher-timeframe resistance.
Longer-term Support: 3620 – 3630.
3. Main Trading Scenarios
🟢 Long Setup (trend-aligned)
Wait for price to retest Liquidity Buy zone 3640 – 3645.
If reversal signals appear (pin bar, engulfing, etc.), consider opening Long.
Targets:
Short-term: 3678 (trendline break retest).
Mid-term: 3700 – 3710 (HH).
🔴 Short Setup (scalp only)
If price retraces into Sell Scalp Zone 3670 – 3680 and shows strong rejection → Short scalp opportunity.
Target: 3640 – 3645.
Note: Short trades are counter-trend, so manage quickly.
4. Trade Management Notes
Prioritize Longs from support zones since the higher-timeframe trend is still bullish.
Shorts should only be seen as short-term scalp opportunities near resistance.
Risk management: limit to 1–2% per trade, avoid holding against the main trend.
📌 Conclusion: XAUUSD is currently testing the descending trendline and resistance area. A successful breakout could target 3700+. Otherwise, the market is likely to revisit 3640 before launching the next bullish leg.
XAUUSD –Today’s Trading Outlook | Sell Fill Liquidity & Buy Zone
Hello traders,
In the recent sessions, gold has continued to show strong volatility around important liquidity zones and support–resistance levels. The current structure indicates that sellers remain in control in the short term, while buyers are expected to return only if price reaches deeper support areas.
Technical View
Main Resistance: 3670 – 3680, aligning with the FVG zone → key area for Sell to Fill Liquidity.
Short-term Support: 3630 – 3627. A break below could open the way for a deeper decline.
Buy Scalping Zones: 3613 – 3615 and 3595 – 3598, suitable for quick intraday longs.
Medium-term Buy Zone: 3600 – 3590, confluence with strong liquidity zone and major support.
MACD Indicator: leaning bearish, with a negative histogram, showing selling pressure still dominant.
Trading Scenarios
Sell Setup (priority)
Sell Liquidity Zone: 3670 – 3680
SL: 3685
TP: 3650 – 3635 – 3627 – 3615 – 3600
Buy Scalping
Buy Zone 1: 3613 – 3615 | SL: 3608 | TP: 3625 – 3638 – 3645
Buy Zone 2: 3595 – 3598 | SL: 3590 | TP: 3610 – 3625 – 3638 – 3645 – 3670
Medium-term Buy
Zone: 3600 – 3590
SL: 3584
Extended TP: 3633 – 3660 – 3675
Conclusion
In the short term, gold is likely to retest the upper liquidity zone before continuing with further declines. Sellers remain in control for now, but deeper support zones will provide potential entry levels for medium-term buyers.
Keep a close watch on these key levels and align your trades with your personal strategy.
Follow along to get the earliest updates whenever market structure changes.

GOLD SHOWING A GOOD UP MOVE WITH 1:10 RISK REWARD GOLD SHOWING A GOOD UP MOVE WITH 1:10 RISK REWARD
DUE TO THESE REASON
A. its following a rectangle pattern that stocked the market
which preventing the market to move any one direction now it trying to break the strong resistant lable
B. after the break of this rectangle it will boost the market potential for break
C. also its resisting from a strong neckline the neckline also got weeker ald the price is ready to break in the outer region
all of these reason are indicating the same thing its ready for breakout BREAKOUT trading are follws good risk reward
please dont use more than one percentage of your capitalfollow risk reward and tradeing rules
that will help you to to become a bettertrader
thank you
