Gold 1H – CPI Liquidity Play Before ExpansionGold on the 1H timeframe is consolidating near 3,633 after multiple ChoCHs and engineered liquidity grabs. With today’s CPI release, price is expected to sweep both premium and discount liquidity zones. The structure suggests engineered spikes toward 3,688–3,691 or dips into 3,595–3,592 before expansion.
________________________________________
📌 Key Structure & Liquidity Zones (1H):
• 🔴 SELL ZONE 3,643 – 3,645 (SL 3,650): Premium supply pocket for short-term rejection.
• 🔴 SELL ZONE 3,688 – 3,691 (SL 3,696): Premium sweep zone targeting 3,680 → 3,670 → 3,660 → 3,650 with extended open target at 3,625.
• 🟢 BUY ZONE 3,595 – 3,592 (SL 3,587): Discount demand zone targeting 3,615 → 3,625 → 3,635 → 3,645 with extended open target at 3,685.
________________________________________
📊 Trading Ideas (Scenario-Based):
🔻 Sell Setup – Premium Rejection (Intraday)
• Entry: 3,643 – 3,645
• Stop Loss: 3,650
• Take Profits:
TP1: 3,630
TP2: 3,620
TP3: 3,600
👉 Scalp opportunity if CPI spikes price into this supply zone.
🔻 Sell Setup – CPI Premium Sweep
• Entry: 3,688 – 3,691
• Stop Loss: 3,696
• Take Profits:
TP1: 3,680
TP2: 3,670
TP3: 3,660
TP4: 3,650
Open: 3,625
👉 Expect engineered CPI move into premium liquidity before reversal.
🔺 Buy Setup – CPI Discount Sweep
• Entry: 3,595 – 3,592
• Stop Loss: 3,587
• Take Profits:
TP1: 3,615
TP2: 3,625
TP3: 3,635
TP4: 3,645
Open: 3,685
👉 Ideal entry if CPI drives gold into deep discount demand before expansion.
________________________________________
🔑 Strategy Note
CPI will dictate volatility and smart money may sweep liquidity both sides. Key bias favours:
• Scalp sells at 3,643–3,645
• Deeper swing sells at 3,688–3,691
• High R:R buys at 3,595–3,592
Risk management is essential — expect fake-outs before expansion.
Metals

Bulls Pausing, Bears Hopeless? Gold Awaits CPI TriggerGold is currently taking a breather after its strong bull run, just as highlighted in the last couple of updates. On the daily chart, price action is consolidating within the 3620–3650/55 zone, and with CPI data lined up today, a breakout from this range could set the next decisive move.
Sentiment-wise, bulls remain in full control, while bears look like they’re running out of steam. Still, a healthy reset is overdue after such an extended rally. From a price action perspective, there are no clear signs of reversal on any major timeframe yet. The key support to watch remains 3600 on a daily closing basis. As long as price holds above this level, the bullish structure is safe.
If 3600 gives way, we could see a deeper pullback toward 3589 (Fib 0.236 support) and then into the 3550–55 zone, which stands as the next strong secondary support. Until then, consolidation here should be treated as part of the ongoing bullish cycle rather than a trend reversal.

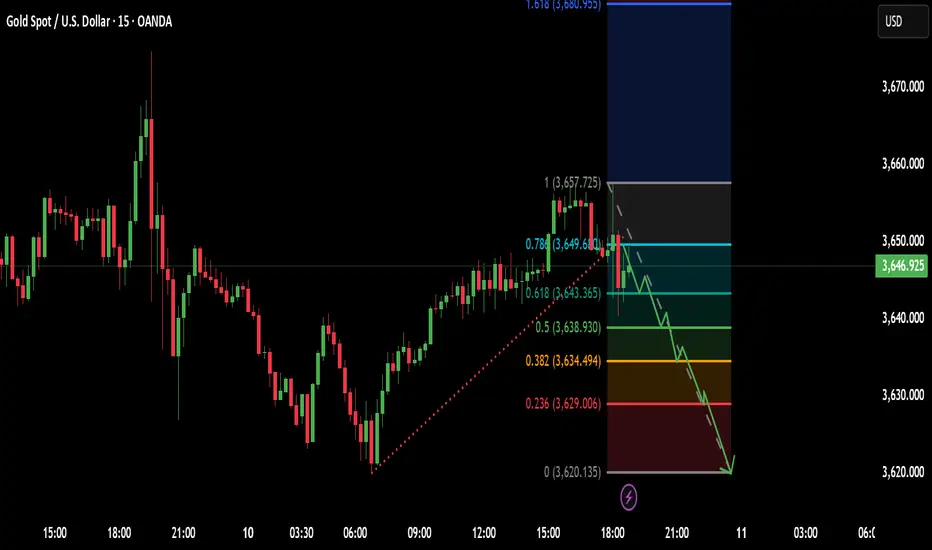
Trading Analysis for Gold Spot / U.S. Dollar (15-Minute Chart)Entery = 3649.00
Stock Loss = 3657.00
Take profit 1 = 3643.00
Take profit 2 = 3639.00
Take profit 3 = 3634.00
Take profit 4 = 3628.00
Based on the provided 15-minute chart for Gold Spot / U.S. Dollar (XAU/USD), published by NaviPips on TradingView.com on June 30, 2025, at 17:53 UTC, here’s a suggested trading setup for a buy position:
Current Price and Trend: The current price is 3,241.875, with a slight increase of +0.250 (+0.01%). The chart shows a recent downtrend that appears to be stabilizing near the current level, suggesting a potential reversal point.
Buy Entry: Enter a buy position at 3,312.875 (current price), as it aligns with a support zone where the price has found a base, indicated by the horizontal dashed line and recent consolidation.
Stop Loss: Place a stop loss at 3,295.250, below the recent low, to protect against further downside. This level is approximately 10.625 points below the entry, defining the risk.
Take Profit Levels:
Take Profit 1: 3,317.875, a conservative target about 20.000 points above the entry, aligning with a minor resistance zone.
Take Profit 2: 3,324.750, a mid-range target approximately 31.875 points above the entry.
Take Profit 3: 3,332.500, a deeper target about 45.625 points above the entry, indicating a potential trend reversal.
Price Action: The chart indicates a downtrend with a possible bottoming pattern near the current level. The support zone and upward candlestick suggest a buy opportunity if the price holds.
Risk-Reward Ratio: The distance to the stop loss (10.625 points) compared to the take profit levels (20.000 to 45.625 points) offers a favorable risk-reward ratio, ranging from approximately 1:1.9 to 1:4.3.
Conclusion
Enter a buy at 3,241.875, with a stop loss at 3,295.250 and take profit levels at 3,317.875, 3,324.750, and 3,332.500. Monitor the price action for confirmation of an upward move, and be cautious of a potential continued downtrend if the price breaks below the stop loss level. (Note: I assume "take profot" was a typo for "take profit" and have corrected it accordingly.)
XAUUSD Gold Trading Strategy September 10, 2025XAUUSD Gold Trading Strategy September 10, 2025: Gold stabilized after falling from yesterday's new high, the market will focus on US inflation data in the final period of the week from today.
Fundamental news: Investors will now turn their attention to US inflation data, scheduled for release on Wednesday and Thursday. Inflation data will be of particular interest following weak employment data ahead of the Federal Reserve's monetary policy announcement next week.
Technical analysis: After gold prices made a new all-time high at $3,675/ounce, prices corrected to the 362x area and increased again as we predicted earlier. The MA lines still maintain support for the price, however, yesterday's correction has reduced the previous strong increase. We continue to trade according to the main trend: waiting for a trading point at the support area combined between MA and FVG. In addition, the next profit-taking phase may occur unexpectedly, to avoid this risk we must ensure to maintain the trading principle.
Important price zones today: 3615 - 3620, 3595 - 3600 and 3660 - 3665.
Today's trading trend: BUY.
Recommended orders:
Plan 1: BUY XAUUSD zone 3615 - 3617
SL 3612
TP 3620 - 3630 - 3650 - 3660.
Plan 2: BUY XAUUSD zone 3595 - 3597
SL 3592
TP 3600 - 3610 - 3630 - 3660.
Plan 3: SELL XAUUSD zone 3663 - 3365
SL 3668
TP 3660 - 3650 - 3630 - 3600. (small volume).
Wish you a safe, effective and profitable trading day.💯💯💯💯💯

Gold 1H – Buy the Dip, Watch 3,687 Premium SupplyOn the 1-hour chart, Gold is trading above 3,650 after a clear break of structure. Price has created demand footprints near 3,636 and deeper at 3,594, while resistance is seen around 3,670 and premium supply is at 3,687–3,689. This indicates a possible engineered retracement into discount demand zones before a move towards liquidity above 3,688.
📌 Key Structure & Liquidity Zones (1H):
• 🔼 Buy Zone 3,636 – 3,634 (SL 3,630): Fresh demand block in line with bullish flow.
• 🔼 Buy Zone 3,594 – 3,592 (SL 3,587): Deeper discount demand, strong base for buyers.
• 🔽 Sell Zone 3,687 – 3,689 (SL 3,694): Premium supply zone, possible liquidity sweep.
📊 Trading Ideas (Scenario-Based):
🔺 Buy Setup – Demand Block Reaction
• Entry: 3,636 – 3,634
• Stop Loss: 3,630
• Take Profits:
TP1: 3,650
TP2: 3,665
TP3: 3,680+
👉 Expect retracement into discount demand before price continues bullish.
🔺 Buy Setup – Deeper Demand Test
• Entry: 3,594 – 3,592
• Stop Loss: 3,587
• Take Profits:
TP1: 3,610
TP2: 3,625
TP3: 3,640+
👉 Best for swing buyers seeking higher risk-reward on a deeper liquidity grab.
🔻 Sell Setup – Premium Rejection
• Entry: 3,687 – 3,689
• Stop Loss: 3,694
• Take Profits:
TP1: 3,670
TP2: 3,655
TP3: 3,640
👉 Short-term liquidity grab at premium levels, good only for scalping with strict risk.
🔑 Strategy Note
Overall bias remains bullish, but smart money may push price into 3,636 or even 3,594 demand zones before expanding higher. Safer setups are buying dips; short positions at 3,687 should be treated only as quick scalps.

XAUUSD Gold Trading Strategy September 10, 2025XAUUSD Gold Trading Strategy September 10, 2025: Gold stabilized after falling from yesterday's new high, the market will focus on US inflation data in the final period of the week from today.
Fundamental news: Investors will now turn their attention to US inflation data, scheduled for release on Wednesday and Thursday. Inflation data will be of particular interest following weak employment data ahead of the Federal Reserve's monetary policy announcement next week.
Technical analysis: After gold prices made a new all-time high at $3,675/ounce, prices corrected to the 362x area and increased again as we predicted earlier. The MA lines still maintain support for the price, however, yesterday's correction has reduced the previous strong increase. We continue to trade according to the main trend: waiting for a trading point at the support area combined between MA and FVG. In addition, the next profit-taking phase may occur unexpectedly, to avoid this risk we must ensure to maintain the trading principle.
Important price zones today: 3615 - 3620, 3595 - 3600 and 3660 - 3665.
Today's trading trend: BUY.
Recommended orders:
Plan 1: BUY XAUUSD zone 3615 - 3617
SL 3612
TP 3620 - 3630 - 3650 - 3660.
Plan 2: BUY XAUUSD zone 3595 - 3597
SL 3592
TP 3600 - 3610 - 3630 - 3660.
Plan 3: SELL XAUUSD zone 3663 - 3365
SL 3668
TP 3660 - 3650 - 3630 - 3600. (small volume).
Wish you a safe, effective and profitable trading day.💯💯💯💯💯

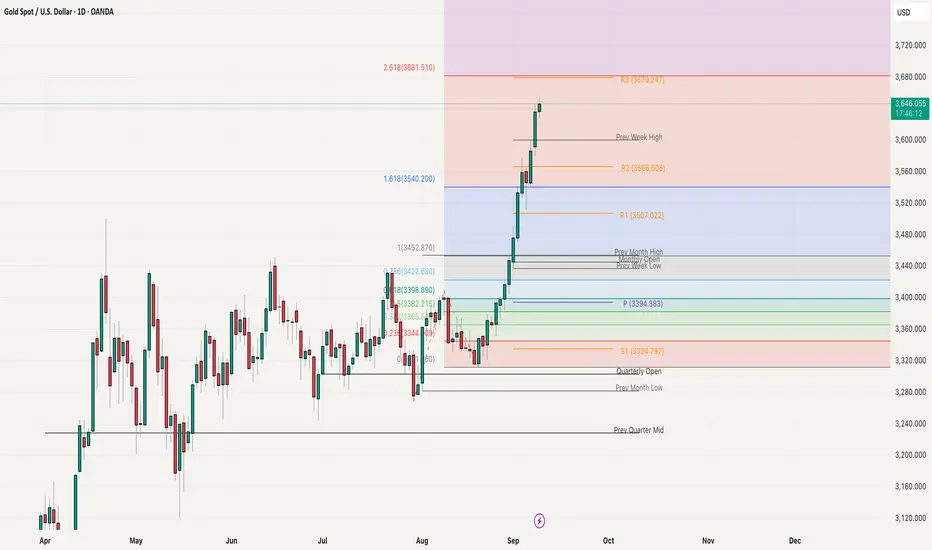
Gold Cooling Off After ATH Consolidation or Correction?Gold cooled off a bit after hitting a fresh ATH around 3675, right near the monthly R3 level. This pullback, however, looks more like a healthy breather than any real weakness, since the key 3600 support is still holding strong. Right now, price is taking support around 3620–25, and bulls are doing a good job defending this zone. As long as this area stays intact(H4 close), the higher-high structure remains valid, meaning gold can easily revisit 3650 or even push back toward the highs.
For now, we can say this as a normal pullback within the trend rather than a reversal. To call it a reversal, we need to see a lower high form on the higher timeframes. Until that happens, some sideways consolidation here makes sense, with 3600 being the big level to keep an eye on for any breakdown.

Gold Stretched but Strong Waiting for PullbackGold is moving aggressively and relentlessly, day by day, with no signs of exhaustion. The price has once again printed a fresh all-time high and is now trading around 3650, pushing higher without any meaningful rejection on the daily, weekly, or monthly charts. Momentum remains strong, but the rally is clearly stretched, and chasing buys at these levels looks more like FOMO than a high-probability setup. On the Fibonacci extension, the next major resistance is seen at 3681, which also aligns with the monthly R3 level, making it a critical zone to watch. Buying directly into this resistance is risky, and the better approach is to wait for a healthy pullback before looking for new longs. On the downside, 3600 now acts as immediate support, followed by 3550 as the secondary support level. As long as these supports hold, the broader structure remains bullish, but patience will be key for catching the next move.
Gold 1H – Smart Money Plays Below 3,600Gold on the 1H timeframe is consolidating close to 3,600 after sweeping short-term liquidity. Price is currently forming imbalance around intraday highs, while demand is positioned lower at 3,565. This structure suggests engineered moves designed to trap both buyers and sellers before the next expansion.
________________________________________
📌 Key Structure & Liquidity Zones (1H):
• 🔼 Buy Zone 3,565 – 3,563 (SL 3,560): Discount demand block, aligned with bullish order flow.
• 📍 Scalp Sell Zone 3,594 – 3,596 (SL 3,601): Intraday rejection pocket; scalp opportunity.
• 🔽 Sell Zone 3,630 – 3,628 (SL 3,637): Premium supply zone, suitable for liquidity sweep reaction.
________________________________________
📊 Trading Ideas (Scenario-Based):
🔺 Buy Setup – Demand Block Reaction
• Entry: 3,565 – 3,563
• Stop Loss: 3,560
• Take Profits:
o TP1: 3,585
o TP2: 3,595
o TP3: 3,600+
👉 Expectation is for liquidity sweep into discount demand before resuming bullish trend.
🔻 Sell Scalp Setup – Intraday Reaction
• Entry: 3,594 – 3,596
• Stop Loss: 3,601
• Take Profits:
o TP1: 3,592
o TP2: 3,590
o TP3: 3,585 → 3,580 → 3,570 → 3,560
👉 Short-term liquidity pocket; scalp trades only with strict risk control.
🔻 Sell Setup – Premium Rejection
• Entry: 3,630 – 3,628
• Stop Loss: 3,637
• Take Profits:
o TP1: 3,610
o TP2: 3,600
o TP3: 3,590
👉 Targeting liquidity lying below intraday lows; best for quick short opportunities.
________________________________________
🔑 Strategy Note
Overall bias remains bullish, but smart money may engineer a sweep of 3,626–3,630 supply before driving price back into 3,565 demand. Cleaner setup is to buy dips, while sell scalps are short-lived opportunities.

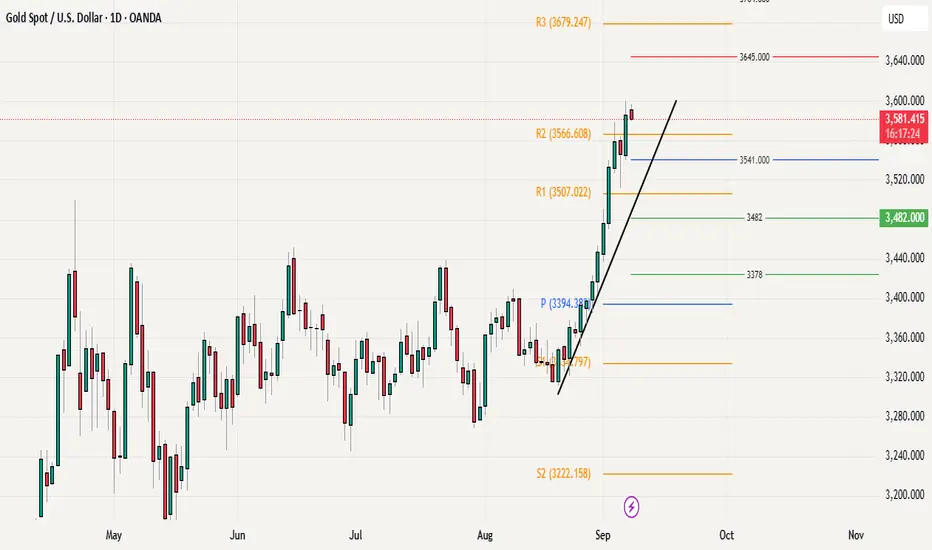
Gold Marks New ATH at 3600 – Bulls Still in ControlGold closed last week on a very strong note, posting its highest daily and weekly close and also printing a new all-time high at 3600, which now stands as an important psychological resistance Level. The overall price action structure continues to favor the bulls, with no major signs of reversal visible on any time frame.
For this week, the weekly pivot at 3541 will be going to act as the first line of support, followed by the previous ATH at 3500 as the secondary and more critical level to hold. While some consolidation or pullback from current levels cannot be ruled out given the stretched rally and overbought conditions (daily,H4) these dips can be viewed as healthy rather than bearish. As long as gold holds above 3500 on a closing basis, the broader trend remains bullish, and any corrective moves are likely to attract buying interest.
In short, unless bears can force a decisive break below 3500 (Daily close or week), gold bullish momentum remains intact, with scope for continuation above 3600 once consolidation is done.
XAU/USD – Market awaits JOLTS, Gold holds safe-haven role⚓️ Captain Vincent – XAU/USD: US–Venezuela tensions push Gold as safe haven
1. Market News 🌍
US Secretary of State Marco Rubio confirmed that the US military attacked a drug ship departing from Venezuela, as Washington steps up pressure on the Maduro government.
Earlier, Trump offered a $50 million bounty to force Venezuela’s President out of power, while deploying military forces near the Caribbean coast.
👉 These moves raise fears of a potential regional conflict, making Gold the top safe-haven asset. The strong rally this morning reflects safe-haven flows returning to GOLD.
📌 Tonight’s focus (3/9 – 21:00): JOLTS Job Openings report – a key gauge of US labour market health.
If the data comes weaker than expected → USD may face more pressure → Gold could accelerate higher.
2. Technical Analysis ⚙️
On the H1 chart, Gold has formed multiple BOS (Break of Structure), showing the bullish trend remains in control.
Buy Zone 3,478 – 3,480: Aligns with a major Order Block, strong support for pullback entries.
Sell Zone 3,577 – 3,579: Near fib extension 1.618, potential resistance where profit-taking may appear.
Key Support – Resistance zones:
Support: 3,528 – 3,507
Resistance: 3,562 – 3,585
3. Trade Scenarios 📌
🔺 BUY Zone (Priority)
Entry: 3,478 – 3,480
SL: 3,470
TP: 3,483 → 3,486 → 3,489 → 349x → 35xx
🔻 SELL Zone (Resistance)
Entry: 3,577 – 3,579
SL: 3,586
TP: 3,573 → 3,570 → 3,567 → 3,560 → 35xx
4. Conclusion ⚓
Gold continues to benefit from US–Venezuela geopolitical tensions, while maintaining a bullish structure with consecutive BOS signals.
In the short term, traders may:
Look to BUY around 3,478 – 3,480 to follow the main trend.
Watch for short-term SELL at 3,577 – 3,579 if price retests strong resistance.
👉 With geopolitical risks rising and US economic data (JOLTS) due tonight, Gold remains the No.1 safe-haven asset.

Gold Trading Strategy XAUUSD September 5, 2025Gold Trading Strategy XAUUSD September 5, 2025: Gold rebounds after correction, market eyes on NFP data and Donald Trump's surprise statement for the week.
Fundamentals: Spot gold prices experienced extreme volatility on Thursday, with intraday swings reaching $53 before closing lower, currently trading at $3,557/oz, representing a gain of about $11 on the day. Gold's slight decline also reflects traders taking profits from the recent incredible rally. Investor focus now shifts to today's Non-Farm Payrolls report, which is expected to provide clues on the Federal Reserve's policy direction.
Technical analysis: Yesterday's strong decline showed investors' short-term profit-taking, but the current gold price is still trading above 3500. We continue to trade according to the main trend, waiting for support areas for long-term trading.
Important price zones today: 3525 - 3520 and 3495- 3500.
Today's trading trend: BUY.
Recommended orders:
Plan 1: BUY XAUUSD zone 3515 - 3517
SL 3512
TP 3520 - 3530 - 3550 - 3580.
Plan 2: BUY XAUUSD zone 3498 - 3500
SL 3495
TP 3503 - 3513 - 3530 - 3550.
Wishing you a safe, effective and profitable weekend trading day.🥰🥰🥰🥰🥰

Gold 05/09: Ready to Scalp the Drop or Buy the Dip?🟢 Market Context
Gold is currently showing a short-term bearish setup after a ChoCH (Change of Character) near 3,536.556. The market is rejecting supply and forming liquidity sweeps around the 3,531–3,533 zone. Expect price to pull lower towards demand areas before the next bullish leg.
📍 Key Levels & Trade Plan
🔴 Intraday Sell (Scalp Opportunity)
• Entry: 3,531 – 3,533
• Stop Loss: 3,535
• Target: 3,485
🟢 Swing Buy Zones
Buy Zone 1: 3,475 – 3,477
o Stop Loss: 3,470
o Target: 3,508 – 3,526
Buy Zone 2 (Deeper Discount): 3,441 – 3,443
o Stop Loss: 3,435
o Target: 3,500+
⚖️ SMC Bias
• Short-term: Bearish scalp from supply zone.
• Mid-term: Looking for liquidity grab and bullish reversal at demand zones.
• Long-term: Maintaining bullish order flow as long as deeper demand (3,441) holds.

FED dovish, Gold stays bullish; SELL only for scalps⚓️ Captain Vincent – Gold Plan XAU/USD
1. Market Wave 🌍
The probability of a FED rate cut in September surged to 96.6% (vs 90.4% earlier) after the JOLTS report showed weakening job prospects.
Several FED officials, from Kashkari to Bostic, shifted dovish. Only Musallim maintained a hawkish stance with a scenario of just one cut.
👉 Result: Capital flows returned to Gold as the No.1 safe haven, pushing prices strongly higher overnight.
📌 Key data today (04/09 – US time):
ADP Nonfarm (7:15)
Jobless Claims (7:30)
ISM Services PMI (9:00)
➡️ This trio of data will be crucial catalysts for GOLD volatility.
2. Technical Analysis ⚙️
On M30/H1, Gold continues to form bullish BOS, keeping the main trend upward.
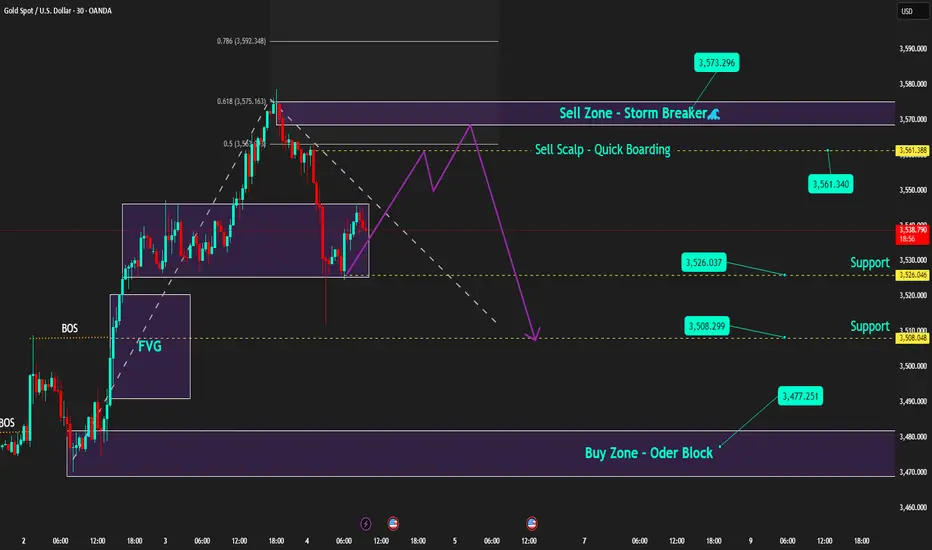
Golden Harbor 🏝️ (Buy Zone 3,477 – 3,479): Old Order Block, strong support if price pulls back.
Quick Boarding 🚤 (Sell Scalp 3,561 – 3,563): Only for short-term scalps.
Storm Breaker 🌊 (Sell Zone 3,573 – 3,575): Aligned with Fibo 0.618–0.786, strong resistance with potential selling pressure.
Captain’s Shield 🛡️ (Support): 3,526 – 3,515 – 3,508
3. Captain Vincent’s Map – Trade Scenarios 🪙
🔺 Golden Harbor 🏝️ (BUY – Priority)
Entry: 3,477 – 3,479
SL: 3,470
TP: 3,480 → 3,483 → 3,486 → 3,491 → 349x → 35xx
🚤 Quick Boarding (SELL Scalp – Short Ride)
Entry: 3,561 – 3,563
SL: 3,569
TP: 3,558 → 3,555 → 3,552 → 354x
🌊 Storm Breaker (SELL Zone – Strong Resistance)
Entry: 3,573 – 3,575
SL: 3,581
TP: 3,570 → 3,565 → 3,560 → 3,555 → 35xx
4. Captain’s Note ⚓
"The golden sail is filled with wind as the FED turns dovish. Golden Harbor 🏝️ (3477) remains the safe haven to align with the bullish trend. SELLs are just Quick Boarding 🚤 scalps at Storm Breaker 🌊 , not long voyages."
Gold Trading Strategy XAUUSD September 4, 2025Gold Trading Strategy XAUUSD September 4, 2025: New all-time high of $3,578, gold eases to $3,536/oz as US ADP data takes center stage.
Fundamentals: Spot gold hit a record high on Wednesday as weaker-than-expected US jobs data weighed on the US dollar. Gold bulls are betting on further gains. The US Department of Labor's Bureau of Labor Statistics released its Job Openings and Labor Turnover Survey (JOLTS) report on Wednesday, showing that job vacancies, an indicator of labor demand, fell by 176,000 to 7.181 million on the last day of July. Economists surveyed by Reuters had previously forecast the number of vacant jobs in the United States at 7.378 million in July.
Technical analysis: After creating the latest ATH of 3578, the gold price corrected strongly to the 3511 area and then continued to increase; this can be considered a short-term profit-taking wave of the gold price. However, the selling pressure is still not strong. The multi-frame RSI is in the overbought area and shows signs of entering the buying zone. We continue to wait at the support areas combined with MA, Fib and FVG zones.
Important price zones today: 3495 - 3500 and 3475 - 3480.
Today's trading trend: BUY.
Recommended order:
Plan 1: BUY XAUUSD zone 3495 - 3497
SL 3492
TP 3500 - 3510 - 3530 - 3550 - OPEN.
Plan 2: BUY XAUUSD zone 3475 - 3477
SL 3472
TP 3480 - 3490 - 3520 - 3550 - OPEN.
Plan 3: SELL XAUUSD zone 3549 - 3551
SL 3554
TP 3546 - 3536 - 3516 - 3500. (small volume, effective before US session).
Wish you a safe, effective and profitable trading day.🌟🌟🌟🌟🌟

Gold 04/09 – Smart Money Setup: Sell Scalp, Prep for Buy Zones🟢 Market Context
Gold is currently reflecting a short-term bearish setup after a Change of Character (ChoCH) near 3,536.556. The market is reacting from supply and creating liquidity sweeps around the 3,531–3,533 zone. We anticipate the price to move lower towards demand areas before the next upward push.
📍 Key Levels & Trade Plan
🔴 Intraday Sell (Scalp Trade)
Entry: 3,531 – 3,533
Stop Loss: 3,535
Target: 3,485
🟢 Swing Buy Zones
Buy Zone 1: 3,475 – 3,477
Stop Loss: 3,470
Target: 3,508 – 3,526
Buy Zone 2 (Deeper Discount): 3,441 – 3,443
Stop Loss: 3,435
Target: 3,500+
⚖️ SMC Bias
Short-term: Bearish scalp from supply zone.
Mid-term: Expecting liquidity grab and bullish reversal at demand zones.
Long-term: Bullish order flow intact as long as deeper demand (3,441) is respected.

Gold 03/09 – Smart Money Playbook: Buy the Dip, Sell the High🟢 Market Context
Gold continues to show a bullish trend with multiple BOS (Break of Structure) and ChoCH (Change of Character) confirmations. The price is currently consolidating around the 3,533–3,540 range, with a noticeable FVG (Fair Value Gap) below. The market is likely to sweep liquidity before making another upward move.
📍 Key Levels
• Resistance (Sell Zones): 3,564 | 3,575–3,576 | 3,586 | 3,595
• Support (Buy Zones): 3,528 | 3,508 | 3,494 | 3,480–3,478 | 3,468
🛠️ Trade Ideas
✅ Buy Zone (Intraday Swing)
• Entry: 3,480 – 3,478
• SL (Stop Loss): 3,473
• TP (Take Profit): 3,485 – 3,490 – 3,500 – 3,515 – 3,520 – 3,530
📌 Expectation: Price is expected to fill the FVG and react from the demand zone before resuming its upward trend.
✅ Buy Scalp (Quick Reaction)
• Entry: 3,501 – 3,503
• SL (Stop Loss): 3,491
• TP (Take Profit): 3,510 – 3,525 – 3,545 – 3,550
📌 Expectation: A short-term liquidity grab above the 3,500 psychological level, leading to a bullish push.
❌ Sell Zone (Countertrend Play)
• Entry: 3,575 – 3,573
• SL (Stop Loss): 3,582
• TP (Take Profit): 3,565 – 3,555 – 3,545 – 3,530 – 3,520
📌 Expectation: A strong supply zone where smart money may target liquidity before a price reversal.
🔑 SMC Insights
• BOS confirms a bullish bias, but the price may pull back to address the FVG imbalance.
• Liquidity is likely to be present around 3,480–3,500 before a push towards 3,575 or higher.
• High probability of buying at demand zones (dips) and selling at extreme supply zones.

Healthy Pause in Gold’s Rally, Bulls Still in ControlGold has finally started to show a healthy daily correction after its sharp rally and breakout above 3500. This pullback was not unexpected, as intraday charts were looking overstretched in the last sessions. Despite today’s dip, the broader structure remains strong with momentum still favoring the upside as long as key supports hold. For the short term, 3500 (previous high) will be the immediate level to watch, followed by 3450 as secondary support. Holding above these levels will keep the bullish trend intact, and any stabilization here can set the stage for another leg higher. Overall, the correction looks more like a consolidation phase rather than a reversal, keeping the bigger picture positive.

XAUUSD Gold Trading Strategy September 3, 2025XAUUSD Gold Trading Strategy September 3, 2025: Gold prices are stable, heading towards the $3,550 mark with ETF capital flows boosting and the market is also waiting for employment data and developments from the FED.
Basic news: Spot gold prices remained stable in today's Asian trading session, after rising sharply in the previous session. The current international gold price is around $3,531/ounce, according to CMC Group's FedWatch Tool, the market is pricing in nearly 92% of the possibility that the Fed will cut 25 basis points at the meeting on September 17.
Technical analysis: Spot gold prices continue to increase strongly. The rising price channel remains. Currently, the MA lines and the Fib frame are still very good support areas for prices, however, the RSI is in the overbought area; we should be careful that prices will have a correction first and then increase again. We limit FOMO, continue to wait at support zones combined between MA, Fib and FVG zone.
Important price zones today: 3500 - 3505 and 3475 - 3480.
Today's trading trend: BUY.
Recommended orders:
Plan 1: BUY XAUUSD zone 3500 - 3502
SL 3497
TP 3505 - 3515 - 3530 - 3550.
Plan 2: BUY XAUUSD zone 3475 - 3477
SL 3472
TP 3480 - 3490 - 3500 - 3530.
Wish you a safe, effective and profitable trading day.💯💯💯💯💯

SAIL (Bird view) By KRS Charts28th May 2025 / 10:17AM
Why SAIL??
1. As we can see from above chart, it clearly turning Bullish Trend stock from Berish .
2. Fundamentally its Durable and is at decent valuation right now.
3. Technically, in 1D TF fake selling and Gap Down is visible showing sellers got trapped. Such move market gives when they need liquidity, and this can happen both the side.
4. Further Bullish traits Sell candles volume is getting lower and allover lower than bullish candles. which usually noticed when Stock turned bullish on bigger cycles.
5. 100 EMA is underneath in many significant timeframes which also indicates buyers had shown more interest in past and likely this time as well.
Targets and Stop Loss is mentioned in Chart.
Note: This is 1M TF view will be Medium to Long Term

NMDC By KRS Charts9th June 2025 / 19:01
Why NMDC?
1. Dow Theory , it turned into Bullish Trend with Higher Highs & Higher lows.
2. Huge Accumulations since many Years and as I said above HHs & HLs.👆
3. In major timeframes stock is above 100EMA which is sign that more upside might possible.
4. Wave counts are picture perfect with more than 0.618 retracement for wave(2) and Reversed to upside from 0.5 Retracement between wave(2) & wave4 bottom points.
Targets & SL is mentioned in Chart.
NSE:NMDC NSE:CNXMETAL

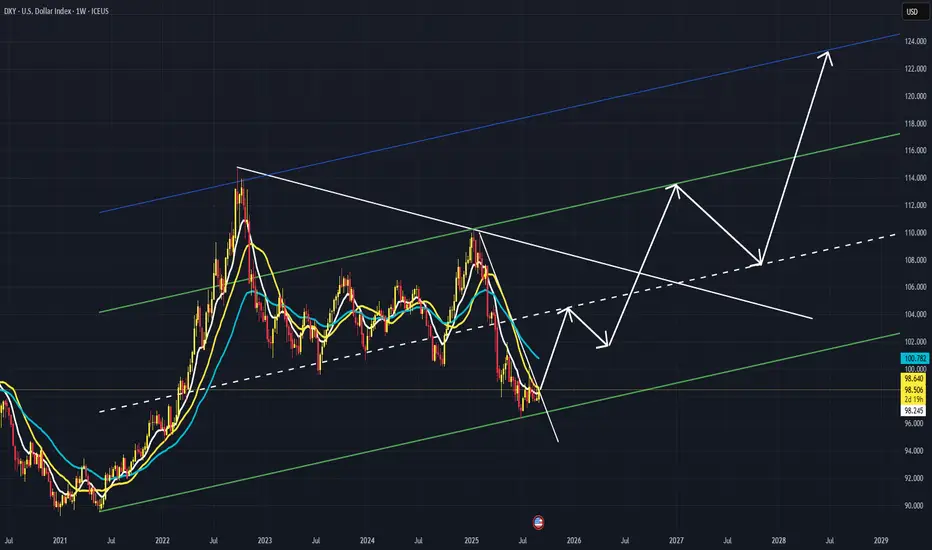
Can DXY make it to 125?Interesting thought as geopolitical forces gather and discuss the fate of USA ... Can DXY make it to 125 in a 5 wave rise in next 3 years or so?
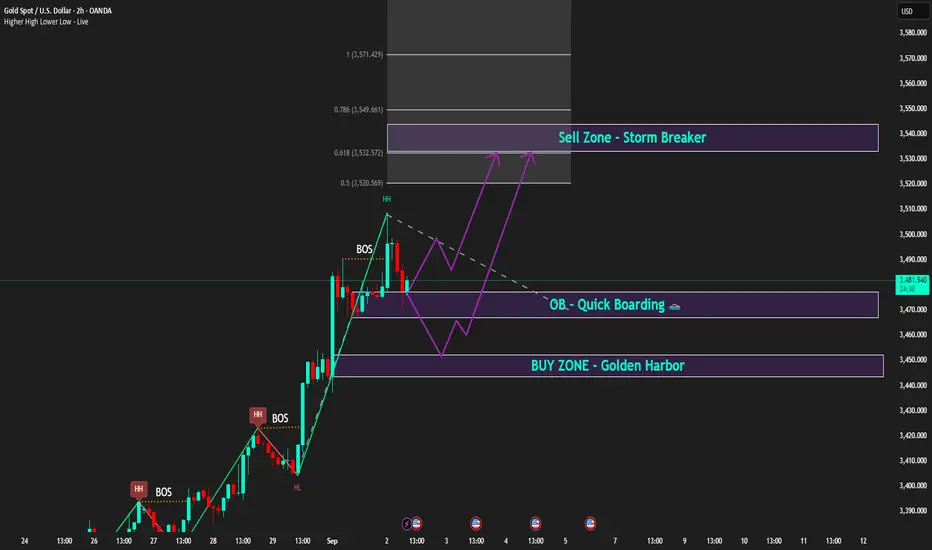
Bullish trend intact, waiting for PMI to spark the next waveCaptain Vincent – Gold Plan XAU/USD
1. Market Waves 🌍
The USD continues to weaken as investors grow more confident that the FED will cut rates in the coming months. With the greenback losing appeal, large flows are leaving cash and moving into safe-haven assets → gold stands out as the number one choice .
👉 This supports gold’s sustainable bullish trend . If USD selling pressure persists, the market could see fresh breakouts into year-end.
2. Technical Outlook ⚙️
H2 Chart: gold just created a Higher High after BOS , confirming bullish dominance.
Golden Harbor 🏝️ (Buy Zone 3,450 – 3,452): aligned with previous FVG , heavy liquidity zone.
Quick Boarding 🚤 (OB ~3,470): intermediate support, ideal for quick pullback entries.
Storm Breaker 🌊 (Sell Zone 3,538 – 3,540): resistance at Fibo 0.618 – 0.786 , strong chance of profit-taking if tested.
Intraday bias: Wait for pullback to Buy. Short-term Sell only if price hits Storm Breaker.
3. Captain Vincent’s Map – Key Levels 🪙
Golden Harbor 🏝️ (Buy Zone): 3,450 – 3,452
Quick Boarding 🚤 (OB Support): 3,470
Storm Breaker 🌊 (Sell Zone): 3,538 – 3,540
4. Trade Scenarios 📌
🔺 Golden Harbor 🏝️ (BUY – Priority)
Entry: 3,450 – 3,452
SL: 3,444
TP: 3,455 → 3,458 → 3,462 → 3,465 → 34xx
🔻 Storm Breaker 🌊 (SELL Reaction)
Entry: 3,538 – 3,540
SL: 3,548
TP: 3,535 → 3,532 → 3,529 → 35xx
5. Captain’s Note ⚓
“The gold sail is still filled with bullish wind, but Storm Breaker 🌊 above may create counter waves. Stay patient at Golden Harbor 🏝️ for precise entries, and watch the PMI at 21:00 – the catalyst for the next wave.”