XAUUSD Trade Idea – Short SetupPair: XAUUSD (Gold/USD)
Type: Sell Setup
Risk/Reward Ratio: 2.7 : 1
🔹 Technical Overview:
Price is moving inside a descending channel, respecting both the upper and lower trendlines.
Recent rejection near the upper channel resistance indicates continuation of bearish pressure.
A short position is taken after price failed to break above the upper boundary.
Volume activity is showing reduced buying momentum, supporting bearish bias.
🔹 Trade Setup:
Entry: 3,473
Stop Loss: 3,477.1 (above channel resistance)
Take Profit: 3,461.4 (near lower channel support)
🔹 Idea Summary:
As long as price remains inside the descending channel, bearish continuation is expected. This setup offers a strong risk-to-reward ratio of 2.7:1, making it favorable for short-term traders.
⚠️ Note: If price breaks above the channel resistance, bearish bias will be invalidated.
Metals

XAUUSD Gold Trading Strategy September 1, 2025XAUUSD Gold Trading Strategy September 1, 2025: Gold reversed its decline and surged to its weekly target, boosted by U.S. PCE data and concerns about Fed independence.
Fundamentals: Gold prices reversed course in the U.S. trading session last week, erasing all losses and rising to a new high. After the US Personal Consumption Expenditures (PCE) inflation report largely met expectations, the precious metal traded near $3,454, its highest level since June 16. The weakening dollar supported gold prices, while traders continued to bet on the Federal Reserve's monetary easing measures in September.
Technical analysis: Gold prices, after breaking the 3,420 - 3,425 area, rose sharply to the 3,485 area and are heading towards the old ATH area of 3,500. We will now trade in an uptrend, waiting for a trading point at the combined support zones of MA, Fib and FVG.
Important price zones today: 3,420 - 3,425 and 3,445 - 3,450.
Today's trading trend: BUY.
Recommended orders:
Plan 1: BUY XAUUSD zone 3445 - 3447
SL 3442
TP 3450 - 3460 - 3480 - 3500.
Plan 2: BUY XAUUSD zone 3420 - 3422
SL 3417
TP 3425 - 3435 - 3455 - 3500.
Wish you a new week of safe, effective trading and lots of profit.🌟🌟🌟🌟🌟

Gold consolidates as new alliances emerge | Captain Vincent 1. News Wave 🌍
At the two-day summit in Shanghai, Prime Minister Modi and President Xi Jinping announced that India and China will become development partners rather than competitors.
The meeting also included Russia and four Central Asian nations, aiming to form a Southern Hemisphere bloc to counterbalance the US and the West.
👉 This signals a shift in geopolitical power, heightening concerns of global polarization → Gold continues to hold its safe-haven position.
2. Technical Analysis ⚙️
On the H2 chart, Gold has formed a Higher High after the recent strong breakout.
Storm Breaker 🌊 (Sell Zone 3511 – 3518): Strong resistance, potential for supply if price retests.
Golden Harbor 🏝️ (Buy Zone 3450 – 3448): Confluence with FVG + Fibonacci 0.5/0.618, a key support for pullback entries.
Main Trend: Gold likely to move sideways between 3450 – 3510 before choosing a major direction.
3. Captain Vincent’s Map – Trade Scenarios 🪙
🔻 Storm Breaker 🌊 (SELL Reaction)
Entry: 3511 – 3508
SL: 3518
TP: 3505 → 3500 → 3497 → 349x → 348x
🏝️ Golden Harbor (BUY Zone – Strong Support)
Entry: 3450 – 3448
SL: 3440
TP: 3453 → 3456 → 3459 → 3462 → 346x
4. Captain’s Note ⚓
"Political news continues to stir the golden sea 🌊. Bears are waiting at Storm Breaker 3511, but the safe harbor remains Golden Harbor 3450 – 3448. In such unpredictable waters, prioritise short-term sells to flow with safe-haven demand, rather than recklessly facing the storm."

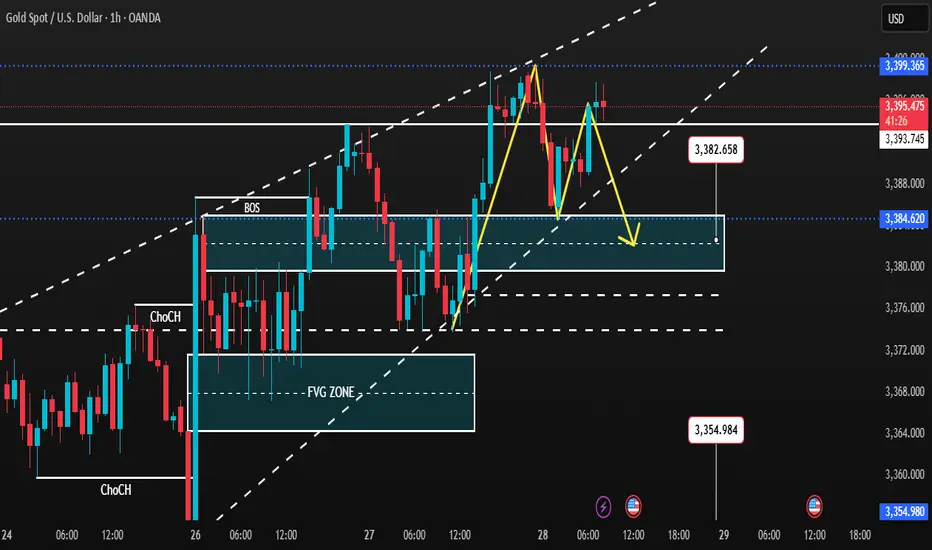
Gold 01/09: FVG Retracement – Buy on Dips, Short near 3515SMC Market View – 01 September
Gold is continuing its bullish order flow, with clear BOS and ChoCH signals already confirmed. Price has formed an FVG (Fair Value Gap) near 3463, and is now showing momentum towards the 3515 supply zone.
✅ BUY Setups
Buy Zone 1: 3418 – 3422
Strong demand area with trendline support and liquidity sweep.
Stop Loss: 3410
Targets: 3430 – 3445 – 3455 – 3460+
Buy Scalp Zone: 3352 – 3350
Deeper liquidity grab area, suitable for quick scalps.
Stop Loss: 3344
Targets: 3360 – 3380 – 3400
👉 All buy zones are aligned with the dominant bullish structure. Best approach: wait for retracements to go long.
❌ SELL Setup
Sell Zone: 3515 – 3517
H1 supply area overlapping with resistance.
Stop Loss: 3522
Targets: 3500 – 3485 – 3475 – 3465 – 3450
👉 Short trades here are only meant for quick pullbacks. The bigger bias remains bullish unless a strong bearish ChoCH shows up.
📌 Conclusion
Main bias: Buy on dips at 3415–3422, 3442–3447, and scalp at 3352–3350.
Secondary play: Short at 3515–3520 targeting demand.
Key level: Watch the FVG at 3463 for market reaction.

Will Gold Return to 3400?Market Context
Price has registered multiple bullish break of structure, confirming short-term bullish momentum.
A supply zone around 3449 – 3451 may trigger liquidity-driven reactions.
The fair value gap between 3360 – 3310 is still open and could pull price down before continuation.
Key Levels
Supply Zone: 3449 – 3451
Buy Zone 1: 3396 – 3400 (Stop Loss: 3390)
Buy Zone 2: 3310 – 3315 (Stop Loss: 3303)
FVG Zone: 3360 – 3310
Trading Scenarios
Primary Buy Setup
Entry: 3396 – 3400
Stop Loss: 3390
Target: 3449 – 3460 liquidity sweep
Secondary Buy Setup
Entry: 3310 – 3315
Stop Loss: 3303
Target: 3396 – 3449
Counter-trend Sell
Entry: 3449 – 3451, provided rejection is visible
Stop Loss: above 3458
Target: 3400 demand
Summary
The overall bias stays bullish with two key demand zones in play: 3400 for a shallow retracement and 3310 for a deeper liquidity sweep. Short positions near supply remain valid only as quick counter-trend trades.

GOLD 29/08: Monthly Candle Closing. DON’T BUY FOMOGold is sitting at a crucial level. As the monthly candle closes, traders must avoid emotional entries. With Smart Money Concepts (SMC) and Elliott Wave Theory, here are the clear trading zones to watch.
🔎 Market Structure (SMC + Elliott)
Elliott Wave: Waves III – IV – V completed. Wave V hit the D1 trendline, showing signs of exhaustion.
SMC Insights:
Multiple BMS (Break of Market Structure) → institutional liquidity play.
EQH (Equal Highs) & EQL (Equal Lows) → liquidity pools ready to be taken.
Demand Zones:
3398 – 3396 (EQH + BMS support)
3372 – 3370 (EQL / deep liquidity sweep)
Resistance: D1 trendline remains the key dynamic cap.
📌 Trading Plan
Scenario 1 – Short-term Sell (Counter-trend):
Entry: 3319 – 3321
SL: 3327
Target: 3398 – 3396
Scenario 2 – Buy at Demand Zone 1 (Main Setup):
Entry: 3398 – 3396
SL: 3390
Target: 3410 – 3415
Scenario 3 – Buy at Demand Zone 2 (Deeper Sweep):
Entry: 3372 – 3370
SL: 3365
Target: 3400 – 3410
✅ Best Risk–Reward setup with liquidity sweep + Elliott retracement.
✅ Conclusion
Bias: Still bullish in the bigger picture.
Risk: Expect liquidity sweeps before continuation.
Advice: Don’t chase price. Wait for demand zone confirmations.
Focus: Safer buys from 3398–3396 or 3372–3370 instead of impulsive FOMO buys near highs.

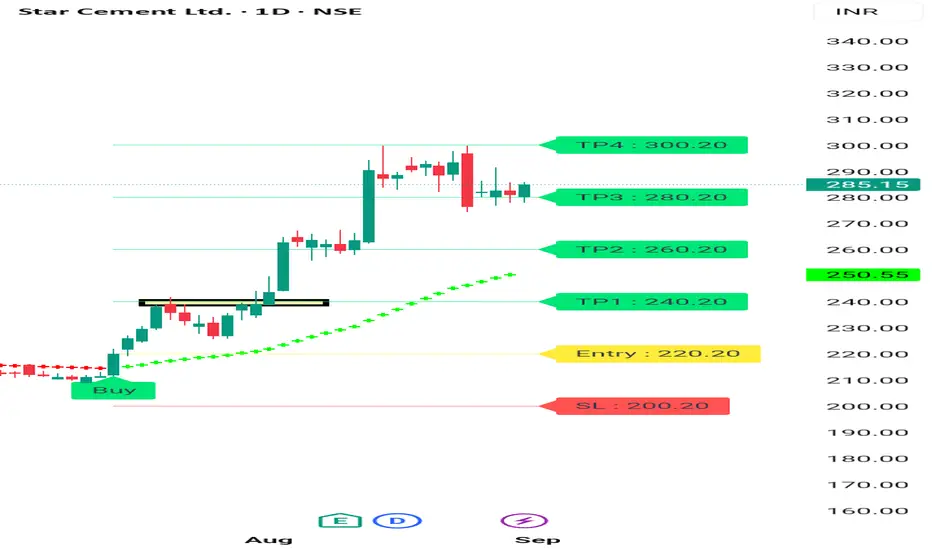
STAR CEMENT BULLISH Structure Start Cement Showing Good Strength on 1 Day Chart. Be Can See Star Cement given breakout and moving up in a higher high Pattern. It's a good sign that stock Still in Upper Range in this Falling market.
Consult your financial advisor before making any position in stock market. It's not my buy sell Reccomendation. My views are for educational purposes only.
Captain Vincent | Gold holds 3400, breakout or pullback next?” FED turns dovish, Gold challenges a new Storm Breaker
1. News Wave 🌍
FED – Waller: “Tariffs are a kind of tax and do not increase inflation. I’m back with the ‘transitory team’ on inflation.”
👉 A clear dovish hint supporting a 25bps rate cut in September, with potential for 1–2 more cuts in the next 3–6 months.
US Senate: Hearing scheduled on Sept 4th for FED nominee S. Miran → Political–monetary spotlight.
Tonight: Market awaits PCE data, FED’s preferred inflation measure.
➡️ Summary: FED leaning dovish = mid-term bullish for Gold.
But short-term, Gold faces profit-taking pressure near resistance.
2. Technical Outlook ⚙️
On H1, Gold has repeatedly formed bullish BOS and crossed above 3,400.
Golden Harbor 🏝️ (Buy Zone 3375 – 3373): Large volume accumulation, aligned with FVG → Attractive entry if price pulls back.
Storm Breaker 🌊 (Sell Zone 3432 – 343x): At old ATH zone, high probability of supply pressure if tested.
Key Levels:
3,375 → Critical support “anchor”.
3,438 → Resistance target if bullish momentum continues.
3. Captain Vincent’s Map – Trade Scenarios 🪙
🔺 Golden Harbor 🏝️ (BUY Zone – Priority)
Entry: 3375 – 3373
SL: 3365
TP: 3378 → 3381 → 3384 → 3387 → 33xx
🔻 Storm Breaker 🌊 (SELL Zone – Old ATH Reaction)
Entry: 3432 – 343x
SL: 3442
TP: 3428 → 3425 → 3423 → 3420 → 33xx
4. Captain’s Note ⚓
"The Gold ship has sailed past 3400, but Storm Breaker 🌊 at 343x remains a tough challenge. If corrective waves appear, patiently wait at Golden Harbor 🏝️ to board for a more bullish September journey."

Gold 29/08: Smart Money Looks at 3444 or 3395 LevelsMarket Context (SMC View):
Gold faced rejection from the 3423 liquidity zone and is now pulling back.
Demand is seen near 3397–3395, which can give a bounce if price tests it.
Premium supply zones above 3422 and 3442 are good areas to look for selling opportunities.
🔼 BUY SCENARIO
Buy Zone: 3397 – 3395
Stop Loss: 3389
Targets: 3405 → 3415 → 3425
🔽 SELL SCENARIO 1 (Price Action)
Sell Zone: 3422 – 3424
Stop Loss: 3430
Targets: 3412 → 3400
🔽 SELL SCENARIO 2 (Swing)
Sell Zone: 3442 – 3444
Stop Loss: 3452
Targets: 3425 → 3412 → 3400
📌 Conclusion & Notes
Bias: Buy near 3397–3395, then watch for possible liquidity grabs at 3422–3424 or a bigger sweep near 3442–3444 to go short.
Key Levels: 3422–3424 is the first intraday supply zone, while 3442–3444 is the major swing sell zone.
Tip: Wait for rejection candles or confirmation before selling.
Risk: Gold is very volatile; use strict stop losses and manage capital carefully.

Steady Climb: Gold Confirms Breakout, Support Shifts to 3400We have seen impressive strength on gold with a slow but steady breakout above 3400, confirming a bullish tone in the market. Price has also cleared the previous swing high near 3410, turning this zone into fresh support (3400–3410). Alongside this, the rising trendline support (black line) continues to guide the uptrend, adding confidence to the move.
From a price action perspective, this breakout looks healthy and signals that buyers are gaining control. The next big level to watch is the 3450 zone, which stands as the key breakout area for a larger move higher. On the flip side, as long as 3400–3410 holds, the bullish outlook remains intact.
With both the monthly and weekly closing happening today, the candle close will be crucial in setting the tone for the next leg. A strong close above 3410 would further validate the bullish breakout, while any failure to hold above support could bring some profit-taking. For now, the overall structure favors the bulls.

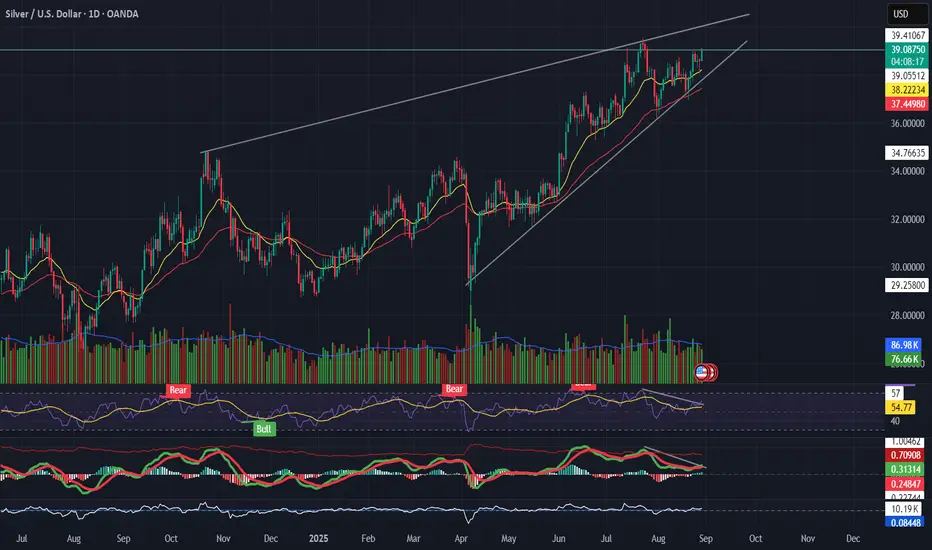
Silver (XAGUSD) Trading in a rising wedge Pattern📌 Silver (XAGUSD)
Trading in a rising wedge, pressing resistance near $39.
RSI divergence → price making higher highs, momentum not following.
MACD rolling over while price climbs = possible bearish divergence.
Support to watch: $37.3 → wedge breakdown if breached.
👉 Bullish only if $39.5 breaks with strong volume; otherwise, risk of pullback.
---
🎯 Takeaway
Silver = extended wedge → caution, momentum weak.
Divergence has appeared at H4 – TOP IS ABOUT TO BE FORMEDGold SMC Daily Plan – 28/08
Market Context (SMC view):
Gold is trading near 3395–3396 after a sharp bullish rally. Early bearish divergence is visible on H4, hinting at a short-term top.
Key resistance is at 3400 – a clean breakout above may trigger liquidity sweep towards 342x–343x, retesting the old ATH.
On the downside, if 3370 support breaks, price may correct deeper into 335x BUY zone for a strong bullish setup.
Key Levels:
Resistance: 3396–3400 (Sell Zone), 342x–343x (Liquidity sweep area)
Support: 3370, 3354–3352 (Buy Zone), 3325 (SL for longs)
SMC Zones & Liquidity Pools:
BUY ZONE 1: 3354–3352 (below liquidity sweep under 3370)
SL: 3347
TP: 3365 → 3375 → 3385 → 3395 → 3400+
BUY ZONE 2: 3380–3382
SL: 3374
TP: 3390 → 3400 → 3415 → 3430 → 3450+
SELL ZONE: 3408–3410 (above recent high)
SL: 3416
TP: 3390 → 3380 → 3375 → 3360
Trading Plan & Scenarios:
Sell Setup (Primary Bias – Divergence Play):
Look for liquidity grab above 3396–3399 (into resistance).
Enter short with SL above 3403.
Partial profits at 3390–3380–3375; keep runner towards 3360 if support breaks.
Buy Setup (Counter Play – Break & Retest):
If price dips into 3354–3352 BUY zone, wait for bullish confirmation (choch/BOS on lower TF).
Enter long with SL below 3347.
Targets: 3365 → 3375 → 3385 → 3395 → 3400+
Confluences:
H4 bearish divergence signalling possible exhaustion at top.
Liquidity pools above 3396 and below 3370 remain untapped.
FVG and imbalance align with 335x buy zone.
Gold Plan (28/08) – Ahead of 3,400: Breakout or Correction to ??XAU/USD – Gold hits Storm Breaker 3400: Accumulation before breaking ATH?
1. Market Wave 🌍
Throughout last week, Gold continuously formed BOS (Break of Structure) , confirming that buyers remain in control.
Currently, price is consolidating around 3,394 – 3,400, right at the Storm Breaker 🌊 , the crucial barrier before heading towards the old ATH at 3,424.
The key question: Will Gold accumulate here and smash through ATH, or will it need a pullback to safe harbors before a strong rally in September?
2. Technical Analysis ⚙️
Storm Breaker 🌊 (Strong Resistance): 3400 – 3424 (old ATH). The gateway Gold must conquer to open a new bullish leg.
Golden Harbor 🏝️ (Key Support): 3375 – 3355 – 3330. Confluence with FVG + Fibonacci 0.5/0.618 , likely to attract liquidity if price corrects.
Short-term scenario: Price may pull back to Golden Harbor before breaking higher.
3. Captain Vincent’s Map – Trade Scenarios 🪙
🔺 Quick Boarding 🚤 (BUY Scalp – Rebound Priority)
Entry: 3353 – 3355
SL: 3349
TP: 3356 → 3359 → 3361 → 33xx
🔻 Storm Breaker 🌊 (SELL Reaction – Old ATH)
Entry: 3422 – 3424 (if tested)
SL: 3430
TP: 3419 → 3415 → 3410 → 3405 → 33xx
4. Captain’s Note ⚓
"The Gold ship is now pressing against Storm Breaker 🌊 3400 – 3424 . If it breaks through, the vast ocean opens a new trend. But if the waves push back, patiently wait at Golden Harbor 🏝️ to anchor and catch the September tide."

Gold 27/08: Smart Money Targets 3405 or Sweeps 3355?Gold SMC Daily Plan – 27/08
Market Context (SMC View):
Price is consolidating around 3378, holding the liquidity trendline with multiple BOS and ChoCH, indicating strong smart money activity.
Key resistance: 3393–3406 (supply & liquidity pool).
Key support: 3352–3358 (demand zone) with an Order Block (OB) near 3325.
A possible liquidity sweep could happen above 3405 or below 3355 before confirming the next trend move.
📊 Key Liquidity Zones & Entries
✅ Sell Zone: 3402–3406
SL: 3410
TP: 3390 → 3380 → 3360
✅ Buy Zone 1: 3352–3358
SL: 3345
TP: 3360 → 3375 → 3385 → 3395
✅ Buy Zone 2 (intraday pullback): 3376–3380
SL: 3370
TP: 3385 → 3395 → 3405
SMC Scenarios for 27/08
Scenario 1 – Liquidity Grab at Resistance:
If price sweeps 3402–3406, look for fake breakout signals.
Short from this zone with the TP levels mentioned above.
Scenario 2 – Buy on Dip (Demand Zone):
If price retraces deeper to 3352–3358, wait for bullish confirmation to go long.
If price respects the trend and holds 3376–3380, consider intraday buy opportunities.
SMC Notes:
Focus on buying dips unless a liquidity grab occurs first at 3402–3406.
Keep an eye on price action near the trendline & OB at 3325 for potential high-probability reversal setups.

Gold Holds Trendline All Eyes on 3400 & GDP DataGold continues to move higher , on H4 we can see that price respecting the rising trendline support that has been guiding the move since last week’s breakout. Yesterday, bulls made an attempt to push through the 3400 level, but failed to sustain above it, confirming this zone as the immediate resistance for now. On the downside, supports remain unchanged first at the previous week high (3378), followed by the weekly pivot (3353).
For today, the key focus will be on the GDP data release, which could trigger volatility and provide the needed catalyst for gold to either break above 3400–3410 resistance or slide back towards its support zones. Until then, price action suggests a slow but steady bullish bias, with sellers only likely to gain momentum if the trendline breaks decisively.

XAUUSD Gold Trading Strategy August 27, 2025XAUUSD Gold Trading Strategy August 27, 2025: Gold prices remain in the rising price channel, trading opportunities for investors.
Basic news: CB Consumer Confidence Report (August) is 97.4, higher than the forecast of 96.4 but lower than last month's 98.7. News that President Trump decided to remove Federal Reserve Governor Lisa Cook still has a strong impact on the US Dollar, creating upward momentum for gold.
Technical analysis: Gold prices continue to fluctuate in the rising price channel, however, after approaching the 3395 area, gold prices are currently adjusting. MA lines, liquidity zones combined with Fib frames and price channels are still supporting the upward momentum for gold prices. We continue to wait for transactions in these support areas. There is a high possibility that spot gold prices will approach the 3410 - 3420 area and continue to be held.
Important price zones today: 3358 - 3363 and 3347 - 3352.
Today's trading trend: BUY.
Recommended orders:
Plan 1: BUY XAUUSD zone 3358 - 3360
SL 3355
TP 3363 - 3373 - 3393 - 3410.
Plan 2: BUY XAUUSD zone 3347 - 3349
SL 3344
TP 3352 - 3362 - 3382 - 3400.
Plan 3: SELL XAUUSD zone 3418 - 3420
SL 3423
TP 3415 - 3405 - 3395 - 3380 (small volume).
Wish you a safe, effective and profitable trading day.🥰🥰🥰🥰🥰

Gold Plan 27/08 – Captain Vincent (IN)XAU/USD – Trump strengthens control over the FED, Gold consolidates near Storm Breaker
1. News Wave 🌍
Trump: “We will soon have majority control at the FED. Miran may be moved to another position with a longer term.”
Trump: “I already have a candidate in mind to replace FED Governor L. Cook.”
US Senate: Preparing hearings next week for Trump’s nominee – S. Miran .
👉 Message: Trump is consolidating power within the FED. Market fears FED losing independence → USD volatility rises, Gold benefits from safe-haven flows .
2. Technical Outlook ⚙️
Gold is approaching Storm Breaker 🌊 (3400 – 3402) , overlapping with resistance 3392 – 3406 → profit-taking likely .
On H1, multiple FVGs remain unfilled around 3355 & 3330 → Price may correct to retest these supports before choosing direction.
Intraday bias: Range-bound → Sell at resistance, short Buy at supports.
3. Captain Vincent’s Map – Key Levels 🪙
Resistance (Kháng cự):
3406 – 3400 – 3392 (Storm Breaker 🌊)
Support (Hỗ trợ):
3372 (Minor Shield 🛡️)
3355 (Quick Boarding 🚤 – Buy Scalp Zone)
3344 (Intermediate Shield 🛡️)
3330 (Golden Harbor 🏝️ – Main Buy Zone)
4. Trade Scenarios 📌
🔻 SELL at Storm Breaker 🌊 (Priority)
Entry: 3400 – 3402
SL: 3408
TP: 3395 → 3393 → 3389 → 3386 → 33xx
🚤 BUY Scalp – Quick Boarding
Entry: 3353 – 3355
SL: 3345
TP: 3358 → 3361 → 3363 → 33xx
🏝️ BUY at Golden Harbor (Strong Support)
Entry: 3330 – 3332
SL: 3325
TP: 3335 → 3338 → 3341 → 33xx
5. Captain’s Note ⚓
"Gold today faces Storm Breaker 🌊 above, but multiple shields of support remain below. Smart traders will scalp quickly at Quick Boarding 🚤, or patiently wait for Golden Harbor 🏝️ to anchor safely."

Weekly High Turns Support: Can Gold Push Higher?We have seen a good momentum / continuation since Friday’s sharp rally and is now holding firm above the previous week’s high at 3378, turning it into immediate support. The weekly pivot at 3353 adds another solid support layer below, while the rising trendline support is keeping the bullish structure intact. As long as these levels hold, buyers seem in control, and the price action suggests that bulls are not ready to give up recent gains.
On the upside, the next hurdle is around the 3400–3410 zone, which could act as near-term resistance. For sellers, any breakdown below the pivot (3353) would be a high-probability setup for downside pressure, while a break below the trendline would be a lower-probability but still valid bearish signal. Until then, the path of least resistance remains tilted to the upside with steady bullish momentum.
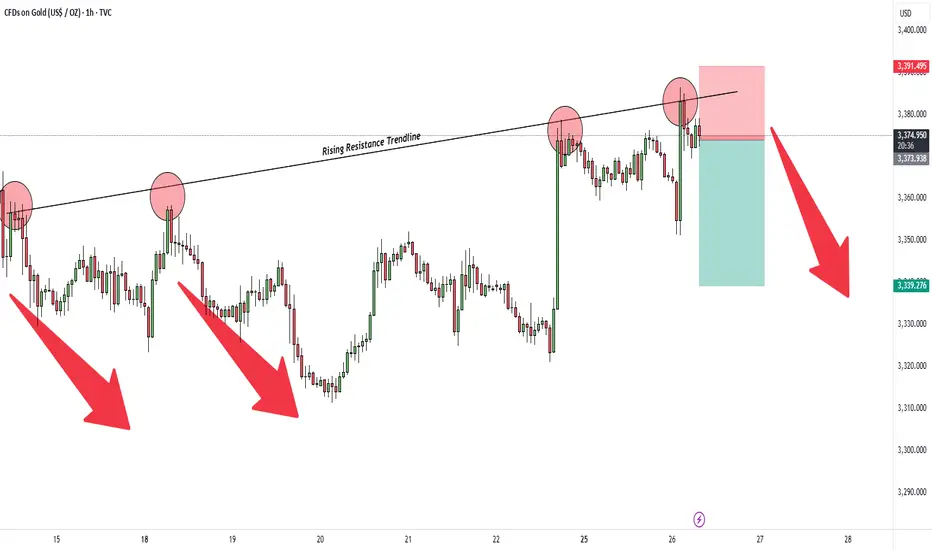
Gold – Rejection from Trendline ResistanceHello everyone, Gold faced rejection from the ascending trendline resistance and formed a bearish setup. A short position has been taken with stop above the recent swing high and target near 3339 support zone.
Key Points:
Trendline Resistance: Price failed to sustain above the trendline.
Risk Management: Stop placed above 3391 to protect against false breakouts.
Target Zone: First support lies near 3339 where price may react.
Disclaimer: This analysis is for educational purposes only, not financial advice.
XAUUSD Gold Trading Strategy August 26, 2025XAUUSD Gold Trading Strategy August 26, 2025:
Gold surged after Trump's move, initial short-term bullish technical conditions in the trend of accumulation status.
Basic news: Gold surged after Trump's move, US President Donald Trump decided to remove Federal Reserve Governor Lisa Cook due to allegations that she falsified mortgage documents. This news affected the US Dollar index to fall sharply at the beginning of today's Asian trading session, while spot gold prices increased by nearly 35 USD.
Technical analysis: Gold prices returned to the support area of 3345 - 3350 after increasing sharply as previously predicted. The rising price channel on the H1 frame has been formed, currently the MA lines and liquidity zones are still supporting the increase in gold prices. In addition, the Fib frames are still effective trading areas. Gold prices may approach the area of 3410 - 3420 this week.
Important price zones today: 3353 - 3358 and 3340 - 3345.
Today's trading trend: BUY.
Recommended orders:
Plan 1: BUY XAUUSD zone 3353 - 3355
SL 3350
TP 3358 - 3368 - 3388 - 3410.
Plan 2: BUY XAUUSD zone 3340 - 3342
SL 3338
TP 3345 - 3355 - 3375 - 3400.
Plan 3: SELL XAUUSD zone 3420 - 3422
SL 3425
TP 3417 - 3410 - 3400 - 3390 (small volume).
Wish you a safe, successful and profitable trading day.🥰🥰🥰🥰🥰

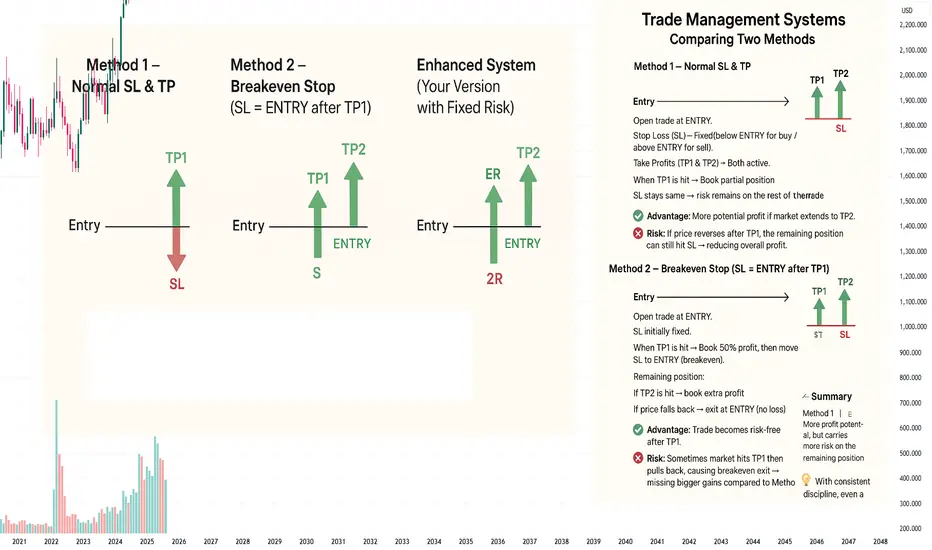
Trade Management Systems: Comparing Two Methods
📌 Method 1 – Normal SL & TP
Entry → Open trade at ENTRY.
Stop Loss (SL) → Fixed (below ENTRY for buy / above ENTRY for sell).
Take Profits (TP1 & TP2) → Both active.
When TP1 is hit → Book partial position.
SL stays the same → risk remains on the rest of the trade.
✅ Advantage:
More potential profit if market extends to TP2.
❌ Risk:
If price reverses after TP1, the remaining position can still hit SL → reducing overall profit.
📌 Method 2 – Breakeven Stop (SL = ENTRY after TP1)
Entry → Open trade at ENTRY.
SL initially fixed.
When TP1 is hit → Book 50% profit, then move SL to ENTRY (breakeven).
Remaining position:
If TP2 is hit → book extra profit.
If price falls back → exit at ENTRY (no loss).
✅ Advantage:
Trade becomes risk-free after TP1.
❌ Risk:
Sometimes market hits TP1 then pulls back, causing breakeven exit → missing bigger gains compared to Method 1.
📌 Enhanced System (Your Version with Fixed Risk)
Initial SL → Always set at 2R.
TP1 → When reached, book 50% profit (+1R on half).
Then move SL to ENTRY (breakeven) for the remaining 50%.
📊 Possible Outcomes:
Scenario Result
Price hits SL (before TP1) –2R loss
Price hits TP1, then reverses to ENTRY +0.5R profit
Price hits TP1, then TP2 +2R total profit
⚖️ Summary
Method 1 (Normal SL & TP) → More profit potential, but carries more risk on the remaining position.
Method 2 (SL = ENTRY after TP1) → Safer, risk-free after TP1, but sometimes cuts off bigger gains.
Your Enhanced Version → A defensive system:
Losers are limited (–2R).
Small winners (+0.5R) happen often.
Big winners (+2R) balance out losses.
💡 With consistent discipline, even a 40–45% win rate can make this system profitable.
Gold Plan 26/08 – Captain VincentXAU/USD – Trump’s surprise move sparks a Gold rally. What’s the next scenario?
1. News Wave 🌍
Trump unexpectedly dismissed FED Governor L. Cook , citing “irresponsible recent financial decisions.”
👉 A political–monetary shock that pushed Gold up by more than 30 points from the 3,350 – 3,352 zone, as investors feared internal instability at the FED could weaken the USD.
Safe-haven demand has been activated, but Gold is unlikely to “fly in a straight line.” The market often requires a pullback to fill liquidity gaps before a clear trend develops.
2. Technical Outlook ⚙️
Price bounced sharply from Golden Harbor 🏝️ (Buy Zone 3350 – 3342) – a key support area.
Currently, Gold is testing Storm Breaker 🌊 (Resistance 3384 – 3400) , a liquidity cluster → potential for profit-taking sell orders.
On H1, multiple FVGs formed around 3363 and 3355 → price may retrace to “fill the gap” before continuing.
👉 Intraday bias: Prioritise Sell at resistance, but watch for short Buy Scalp setups at Quick Boarding 🚤 (3342 – 3340) .
3. Captain Vincent’s Map – Key Levels 🪙
Storm Breaker 🌊 (Main Resistance): 3384 – 3400
Quick Boarding 🚤 (Buy Scalp): 3342 – 3340 | SL 3333 | TP: 3345 → 3347 → 3350 → 33xx
Golden Harbor 🏝️ (Buy Zone): 3350 – 3342
FVG Zones: Around 3363 & 3355 (short-term price magnets)
4. Trade Scenarios 📌
🔻 SELL at Storm Breaker 🌊 (Priority)
Entry: 3400 – 3402
SL: 3408
TP: 3395 → 3390 → 33xx
🔺 BUY Scalp – Quick Boarding 🚤
Entry: 3342 – 3340
SL: 3333
TP: 3345 → 3347 → 3350 → 33xx
5. Captain’s Note ⚓
"Trump’s news wave pushed Gold like an unexpected headwind. But Storm Breaker 🌊 ahead may unleash rough seas. The wise will anchor at Golden Harbor 🏝️ , while the bold may ride Quick Boarding 🚤 for fast scalps. And remember: today’s golden sea depends on the sharks at the helm."

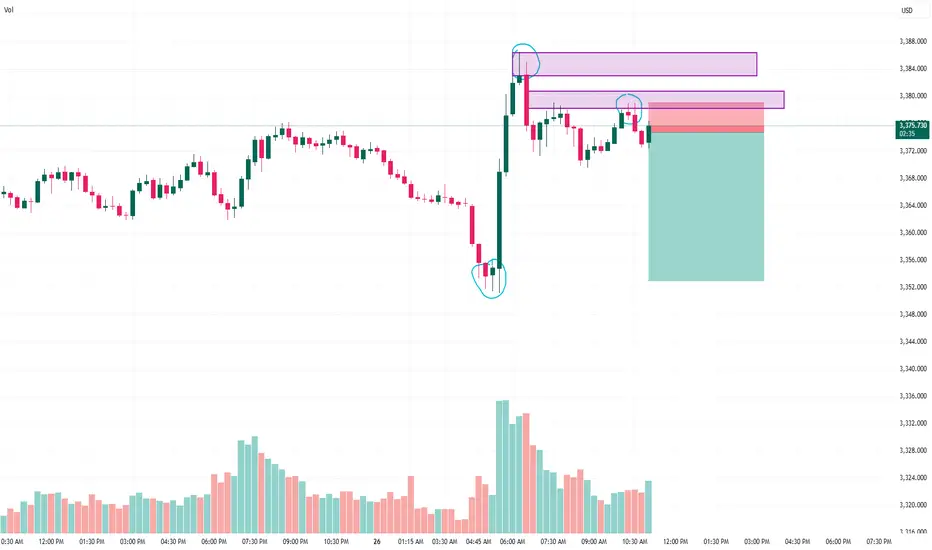
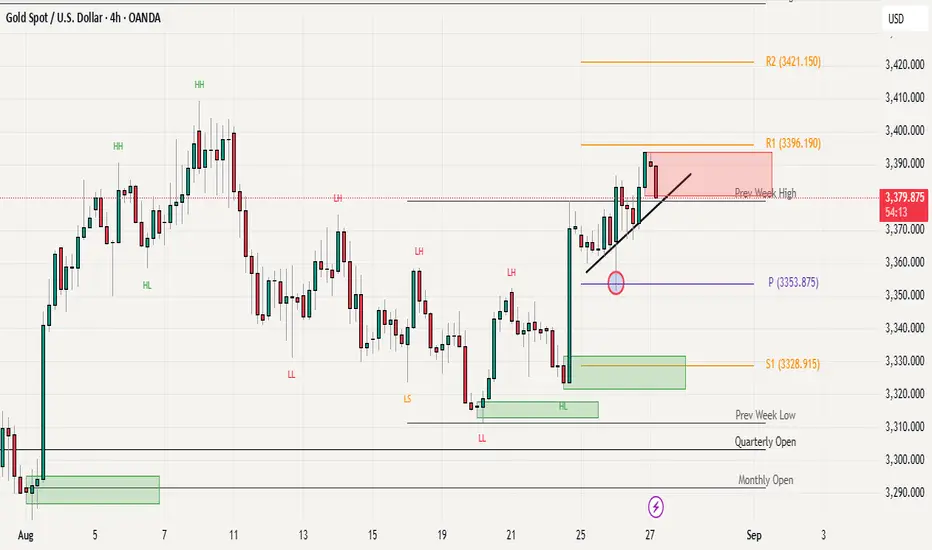
GOLD sell setup Gold (XAUUSD) – Short Trade Idea
🔑 Key Observations:
Strong Rejection Zone:
Price faced rejection at the previous high (highlighted in purple supply zone).
Multiple attempts to break above failed, confirming seller presence.
Volume Confirmation:
The sharp bullish push from the bottom was met with equally strong selling pressure at the top.
Volume spikes indicate distribution at higher levels.
Market Structure:
Clear lower high formation after rejection.
Entry aligns with a retracement into the supply zone.
📊 Trade Setup:
Entry: Short near supply zone (around 3374–3379).
Stop-Loss: Above recent swing high (3380 area).
Target: 3356 level (previous demand zone).
Risk/Reward Ratio: ~1:5 (high probability setup).
⚠️ Risk Management:
Always use a stop-loss to protect capital.
Consider trailing stop-loss once trade moves in favor, to lock in profits.
If price breaks and closes above supply, setup becomes invalid.