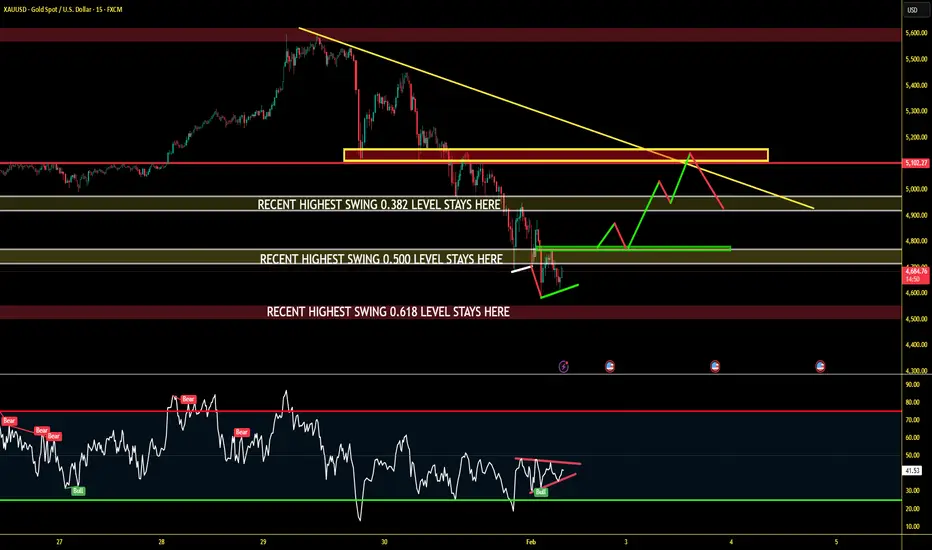
XAUUSD 15M – Bullish Reversal Setup Explained Above 4700 Level After a strong sell-off, Gold is now reacting near a high-probability demand zone.
🔍 My Analysis & Thinking:
• Price has reached the 61.8% Fibonacci retracement of the recent major swing
• RSI (15 Min) is showing a clear bullish divergence
• Selling momentum is weakening after the big fall
• Structure suggests a potential higher low formation
📈 Trade Plan (IF–THEN Logic):
✅ IF price breaks above 4700 (yellow resistance zone)
✅ AND gives a clean retest + bullish confirmation
➡️ THEN BUY
🎯 Upside Targets:
4800 , 4900, 5000 zone (major supply & trendline confluence)
🛑 Invalidation:
Breakdown below 61.8% (4500 -4550 level ) support with strong momentum
⚠️ This is a patience trade — confirmation > prediction.
📊 KEY LEVELS TO MENTION IN CAPTION
Support Zone:
🔹 61.8% Fib – Major demand area
Breakout Level:
🟡 4700 (Yellow Rectangle)
Targets:
🎯 4800 → 4900 → 5000
Bias:
🔄 Short-term bullish after confirmation
XAUUSD 15M – Bullish Reversal Setup Explained Above 4700 Level
Metals
XAUUSD "BULLISH" BIAS IDEA.Symbol + Timeframes: XAUUSD — HTF (Daily) & ITF (H4)**
Bias: Bullish (as long as price holds above key support zone)
Structure: – Higher lows intact on HTF
– Intermediate pullbacks LIQUIDATING "fomoing" retailers.
Key Levels: – Support: – 4629.989
And if it breaks , the confluential block at - 4633.96 and marked important swing low at - 4267.383.
– Invalidation: daily candle close below 4267.383
Context: – Price reacting to confluence (fair value gap + structural support + confluential block)
– Dollar bearish pullback adds supporting context
Plan: – Look for corrective pullback to support for continuation setups at smaller timeframe to frame trades, I've marked the path
– Targets based on structural levels
This is analysis, not trade advice.

Silver Weekly Outlook: Post-Exhaustion PhaseSilver has entered a high-volatility post-exhaustion phase after a sharp parabolic rise followed by an equally aggressive correction. The weekly chart clearly shows that price moved too far, too fast, and the recent sell-off is a classic example of mean reversion after euphoric buying. Such phases rarely resolve in a straight line and typically evolve into consolidation, base-building, or deeper corrective structures.
At current levels, Silver is hovering near an immediate demand zone around the 80–85 region, which now acts as a crucial decision area. This zone represents the first major area where buyers are expected to defend aggressively. The way price behaves here will define the next medium-term trend.
Scenario A – Range / Base Formation (High Probability):
The most probable outcome at this stage is sideways consolidation. After a vertical fall, markets often need time to absorb supply and rebuild demand. If Silver manages to hold above the immediate demand zone and starts forming higher lows on lower timeframes, it would indicate base formation rather than trend failure. This scenario favors range traders and patient positional participants, as price may oscillate between support and overhead resistance for several weeks or months.
Scenario B – Breakdown Continuation (Moderate Probability):
If the current support zone fails decisively with strong weekly closes below it, Silver could enter a deeper corrective phase. In such a case, price may gravitate toward the next major demand zone near 73–75, which aligns with prior consolidation and breakout structure. This move would likely be driven by broader risk-off sentiment or macro pressure rather than technical weakness alone. Traders should avoid aggressive longs if this breakdown structure develops.
Scenario C – Bullish Reclaim and Bounce (Low Probability, Needs Confirmation):
A less likely but still possible outcome is a bullish reclaim, where Silver holds current levels, absorbs selling pressure, and reclaims the 90+ zone with strong weekly confirmation. For this scenario to gain credibility, price must show acceptance above resistance with volume and structure. Until then, any bounce should be treated as reactive and corrective, not a confirmed trend reversal.
From a structural perspective, the major resistance remains far above near the 115–120 zone, which was the distribution area before the sharp reversal. This level will act as a long-term supply cap unless Silver builds a strong base over time.
In summary, Silver is no longer in a trending phase but in a transition zone. Patience is critical here. Traders should focus less on prediction and more on reaction to price behavior at key demand levels. Let structure, confirmation, and risk management guide decisions, as this phase can easily trap both early bulls and aggressive bears if approached without discipline.

ICICI SILVER ETF View for wealth generateIn global market silver is not very right position. So many retailer are entering into the commodity market .
Basically buy on dip for 1-2 years. Technical expectation price will be react 100 in next 3-5 years.
It's a good time to invest.

XAUUSD – Historic Volatility Doji at 1.618 | Exhaustion SignalXAUUSD – HTF Exhaustion at 1.618 | Major Volatility Signal Formed
GOLD HAS PRINTED ITS BIGGEST DOJI IN ENTIRE HISTORY OF DAY CANDLE NEARLY 490$ FROM LOW TO HIGH AND ENDED WITH INDECISION. LETS SEE WHAT HAPPENS NEXT . WAIT FOR LOW AND HIGH OF DOJI.......?
Gold has reacted precisely from the 1.618 Fibonacci extension zone (~5600), where price printed a high at 5597.04 and faced strong rejection.
The current Daily candle is forming an exceptionally large indecision candle (Doji-like structure) after a strong impulsive move.
With an intraday range of nearly 490$, this candle highlights clear exhaustion and aggressive profit-taking at premium prices.
Technical Perspective
Clear rejection from the 1.618 extension resistance
Strong volatility spike following a vertical price expansion
Daily candle structure suggests weakening bullish momentum
Key HTF Levels to Watch
Resistance / Supply: 5580 – 5615
Immediate Reaction Zone: 5350 – 5400
Major Support / Rebalancing Area: 5000 – 4900
HTF Value Area Low: Below 4900 (only if bearish momentum accelerates)
Expectation (Next Sessions / 1–2 Weeks)
As long as price remains below the 1.618 rejection zone, probability favors:
Consolidation or corrective price action
Gradual rotation toward 5000–4900 HTF demand
No immediate V-shaped recovery unless strong acceptance above 5600 is seen

XAUUSD Gold Next Move In Upcoming 2 Weeks ExpectedGold is Now Moving to 5600 to 5615 Which is Retracement level of 1.618 For Golds Previous Swing Extension levels and can expect a retracement of till 5000 to 5100 Levels In Upcoming Weeks Lets See WhatS Going to Happen..........# XAUUSD .. Check My 4hr chart Frame

Silver Futures: Parabolic Breakdown & Bearish LiquidationSilver Futures: Parabolic Breakdown & Bearish Liquidation (Analysis)
Part 1: Historical Context (The "Why") To understand this violent -17% move, we must look at Silver's distinct "personality" compared to Gold.
1. The "Beta" Factor (Silver vs. Gold) Silver is often called "Gold on steroids." While Gold is a monetary metal held by Central Banks for stability, Silver is 50% industrial and 50% speculative. It has a much smaller market cap, meaning it takes less liquidity to push the price up or down violently.
Historical Rule of Thumb: When Gold drops 5%, Silver often drops 10-15%. This chart confirms a classic high-beta liquidation event.
2. Historical Comparisons
The 2011 Crash: In April 2011, Silver went parabolic to nearly $50/oz before crashing ~17.7% in a single day (the "Sunday Night Massacre"). This was caused by exchange margin hikes, forcing leveraged longs to liquidate.
The 2020 Covid Crash: In March 2020, Silver fell ~30% in weeks due to a liquidity crisis where traders sold precious metals to cover equity losses.
Part 2: Visual & Technical Analysis
A. Daily Timeframe (The "Map")
Step 1: The Parabolic Arc Break: The rally followed a steep, unsustainable curve (Blue Arc on chart). When price cuts vertically through such an arc—as the recent Red Candle has done—the bullish momentum is technically broken.
Step 2: The "Supply Zone" Rejection: The long wick at the top (near 422,000) represents a "concrete ceiling." Buyers were exhausted, and trapped longs at this level will likely sell into any recovery to break even.
Step 3: Bearish Engulfing Candle: The massive red candle has "engulfed" (wiped out) the gains of the previous 7-10 trading sessions. This shifts market psychology from "Buy the Dip" to "Sell the Rally."
Step 4: Momentum Warning (RSI Divergence): Before this drop, while price was making Higher Highs, the RSI likely failed to confirm with a Higher High (Bearish Divergence). This signaled buyer exhaustion before the crash occurred.
B. Intraday / Short-Term Strategy (The "Path") Since the daily trend is broken, the strategy shifts to defensive management.
1. The "Dead Cat Bounce" Scenario: After a vertical drop, the RSI is oversold. A bounce is expected, but it is often a trap. We use Fibonacci Retracement levels from the Swing High to Low to identify resistance:
0.382 Level: The first zone where aggressive bears often reload shorts.
0.5 - 0.618 (Golden Pocket): Historically the highest probability area for a "Lower High" to form.
2. The "Bear Flag" Pattern: In strong liquidations, price rarely recovers in a V-shape. Watch for a "Flag" pattern (slow drift upward on low volume). A break below the flag's support triggers the next leg down.
Part 3: Trading Strategy Summary & Risk Management
Volume Confirmation: Check the volume on the breakdown candle. If it is the highest of the year, it indicates "Capitulation" (potential temporary bottom). If volume is average, the "real" panic selling may still be ahead.
Invalidation Level (When is this view wrong?): This bearish outlook is negated ONLY if we get a Daily Candle close back above the 400,000 supply zone. Until then, the market structure remains corrective.
Disclaimer: This analysis is for educational purposes only and does not constitute financial advice. Trading futures involves significant risk.

If You Want to Catch the Bottom, First Wait for RSI.To Do Nothing.
Right now, staying out is already a win.
The market is moving fast, noisy, and uncomfortable. Both buyers and sellers are getting trapped — not because direction is unclear, but because the market has not finished its process yet.
This is a moment to stay calm and observe, not to force a trade.
Observe how price begins to slow down.
Observe how selling pressure fades.
Note:
Stay focused on RSI behavior. When price decelerates and RSI shows clear convergence / stabilization, that’s when it makes sense to start thinking about potential long ideas — not before.
Until then, observation comes first.
Sometimes, doing nothing is the most disciplined decision you can make.

XAUUSD – H2 Technical AnalysisXAUUSD – H2 Technical Outlook: Short-Term Sell Pressure as Liquidity Gets Cleared | Lana ✨
Gold is showing signs of short-term weakness after an aggressive upside expansion. Price action suggests the market may continue to move lower in the near term, not as a trend reversal, but as a liquidity-driven correction within a broader bullish structure.
At this stage, the focus shifts from continuation to how price behaves while liquidity is being taken below structure.
📈 Market Structure & Price Behavior
The recent vertical rally has left the market overextended, making a corrective phase technically healthy.
Price has broken below short-term support and is now trading under a descending corrective trendline, signaling short-term bearish pressure.
This type of structure often develops when the market needs to clean buy-side positions before rebuilding for the next leg.
While the higher-timeframe trend remains bullish, the intraday bias has shifted to corrective / bearish until liquidity objectives are met.
🔍 Key Liquidity Zones on the Chart
Short-term sell zone: the descending trendline near current price As long as price reacts below this trendline, rallies are more likely to be sold.
Scalping buy liquidity: around 5050–5070 This area may generate temporary bounces, but reactions here should be treated as short-term only.
Key bullish order block: 4825 – 4830 A critical zone where stronger buyer participation may appear if the sell-off extends.
Major swing liquidity zone: 4613 – 4625 This is a high-confidence liquidity pocket where the market could complete a deeper correction and reset the broader bullish structure.
🎯 Trading Scenarios
Primary scenario – Continuation of the pullback: As long as price remains below the descending trendline, gold may continue to move lower to sweep liquidity below recent lows. This favors sell-on-rallies rather than buying strength.
Secondary scenario – Temporary reaction: Short-term bounces may occur around the 5050–5070 area, but without structural reclaim, these moves are more likely corrective than trend-changing.
Structural defense scenario: If price reaches the 4825–4830 or 4613–4625 zones, watch closely for signs of stabilization and absorption, which would signal that the liquidity objective has been completed.
🧠 Lana’s View
This move lower is best seen as liquidity cleanup, not panic selling. Lana stays patient during corrective phases, avoiding early longs and waiting for price to reach clear liquidity zones before reassessing bullish continuation.
✨ Let the market take what it needs, then look for structure to rebuild.

Market Outlook & Trade Setup – Friday, 30th January 2025Major indices showed a sharp recovery yesterday and even crossed the opening day high. Silver and Gold has corrected by more than 6% overnight so some selling pressure could be seen.
We have the Budget on Sunday, 1st Feb, 2026, so heavy positions might not be build in the market today.
🔹 NIFTY
* Previous Close: 25,418
* Expected Range: 25,000 – 25,500
🔹 SENSEX
* Previous Close: 82,566
* Expected Range: 82,500 - 82,600
🌍 Global & Market Sentiment
* DJIA: +55 | S&P: -9
💰 Institutional Activity (Cash Market)
* FII: Net Sellers: - ₹ 394 Cr
* DII: Net Buyers: + ₹ 2639 Cr
🔥 Events this Week: US --- Trump Speech & FED Rate announcement
📌 Sectoral Focus
Metal, Energy
👉 Commodities in Focus: Gold, Silver, Copper, Crude, Natural Gas
💯 Important Quarterly Results: Cupid, GHCL, HUDCO, IEX, ITC,REC, Voltas
📈 Trade smart. Manage risk. Stay disciplined.

Gold: Correction or a Pause Before Continuation?Hello everyone, what’s your view on gold at the moment?
Yesterday, gold posted a strong intraday rally followed by a sharp reversal lower, clearly highlighting the intense battle between short-term capital flows. It was a highly volatile session, but from a professional perspective, there is still insufficient evidence to conclude that the medium-term trend has been broken.
From a news and market-context standpoint, the initial upside move was driven by renewed safe-haven demand as cautious sentiment returned. However, as price reached higher levels, large-scale profit-taking, combined with liquidation pressure from risk assets, quickly pushed gcapital reacted faster than.
On the techn, tkey support zone below acting as the equilibrium area between supply and demand. Price behavior around this area will determine whether gold is consolidating for another leg higher or transitioning into a deeper correction.
At this stage, my preferred approach is to monitor price reaction at the support zone rather than act impulsively. If buying interest returns and structure stabilizes, gold still has room to recover. Conversely, if support is decisively broken, staying on the sidelines becomes the most prudent choice.
What’s your take on XAUUSD?

Highlight of the Day: Nifty Metal Index up by 3%Metal index rally led by steel, zinc and copper stocks today. Further uptrend could be seen as long as Dollar is under pressure.

Gold ATH after FOMC: Reaction or New Wave?Before the FOMC meeting, the market shared the same question:
would gold rally ahead of the meeting and then face a sharp sell-off afterward, or continue breaking higher and extend the trend?
After the FOMC, the Fed kept interest rates unchanged — which was not a surprise.
What really mattered was the Fed’s tone, and Powell clearly chose a balanced stance:
neither too dovish nor too hawkish.
More importantly, the Fed has effectively ruled out further rate hikes, while still maintaining a high interest-rate environment.
As a result, gold did not experience a heavy sell-off after the FOMC, and continues to hold its structure near the highs.
At this stage, market focus is shifting toward external risk factors:
The risk of a U.S. government shutdown
U.S.–Iran tensions
Ongoing trade war risks with major partners
Questions surrounding the independence of the Fed
👉 The current macro backdrop is not bearish for gold.
👉 SELL setups are reactionary, not the core narrative of the trend.
⏱️ H1 Observation Range
Lower bound: 5,415
Upper bound: 5,600
Price is consolidating near the highs with a wide range and may gradually push toward higher round-number levels.
🟢 Support / BUY zones
5,505 – 5,410 – 5,310 – 5,250 – 5,100
🔴 Resistance / Key observation zones
5,660–5,665 – 5,700 – 5,800 – 6,000
🧠 Primary scenario
Wide volatility → risk management is key.
SELLs are only short-term reactions at resistance.
BUY pullbacks to support to ride the broader move, not to pick the top.
⚠️ Key notes for the current phase
Reading the chart is a skill.
Reading the Fed is a strategy.
Reading Trump’s statements is survival.
Markets don’t reward being right —
they reward discipline and alignment with the trend.
👉 SELL to react — BUY to stay in the game.
📌 Follow me to track macro scenarios, key price levels, and the ongoing journey of finding opportunities in the market.

Highlight of the day: Silver again up by 6%Silver rose to a new high by 6% heading towards ₹ 4 lac / kg apparently.

Gold at ATH before FOMC shakeout first or straight breakout?🧭 Macro Snapshot
Donald Trump maintains a hardline stance, increasing military presence in the Middle East → geopolitical risk remains elevated.
Tonight’s key focus: Federal Reserve
Political pressure and questions around Fed independence.
DXY continues to weaken, retesting major historical support (2020–2022) → supportive for gold.
👉 Conclusion: Geopolitics + a weaker USD set the bullish bias, while the Fed determines short-term volatility.
📊 Intraday Range to Watch
Upper range: 5,280 – 5,305
Lower range: 5,190 – 5,160
→ High probability of range trading and liquidity absorption ahead of the Fed decision.
🟢 Support
5,220–5,225 | 5,150–5,165 | 5,080–5,085 | 5,050–5,060
🔴 Resistance
5,280–5,294 | 5,300 | 5,315 | 5,380–5,385
⚠️ Strategy Notes
Expect possible fake moves / stop hunts within the range.
Avoid chasing highs or catching tops without confirmation.
Focus on price reaction at key levels and stay disciplined.
Summary: Gold is fundamentally supported, but today the key is how price reacts within 5,160–5,305.
Be patient — wait for confirmation — trade the reaction.

Gold in Decision Zone – GAP Reaction Defines Next MoveMarket Context (Fundamentals → Flow)
Recent sessions continue to be driven by elevated geopolitical and macro uncertainty. Risk sentiment remains fragile as markets reassess global political tensions and their implications for trade, energy routes, and monetary stability.
As a result:
USD remains under pressure, lacking strong follow-through buying.
Equities show signs of fatigue near highs.
Gold continues to attract defensive flows, keeping the broader bullish structure intact.
This environment supports trend continuation, but not without technical pullbacks.
Technical Structure (H1–H4)
Gold is trading within a well-defined ascending channel.
Multiple BOS (Break of Structure) confirm the bullish trend.
The recent impulsive leg created a bullish GAP / imbalance.
Price is now reacting near the mid-channel decision zone, where continuation vs. deeper retrace is decided.
➡️ Trend is bullish, but location matters.
Key Levels to Watch
Current resistance: 5,080 – 5,100
GAP / reaction zone: 5,020 – 5,000
Major demand (FVG): 4,960 – 4,940
Invalidation: H1 close below 4,940
Scenarios (If – Then)
Scenario 1 – GAP Holds (Primary Bias)
If price holds above 5,000
Buyers defend the imbalance
→ Continuation toward 5,120 – 5,180 within the channel.
Scenario 2 – Deeper Pullback (Healthy Correction)
If price loses 5,000
Expect a retrace into 4,960 – 4,940 FVG.
Bullish reaction here keeps the higher-timeframe trend intact.
Only a clean break and acceptance below 4,940 would weaken the bullish structure.
Summary
Gold is not topping — it is pausing at a decision zone. In a risk-sensitive environment, pullbacks are opportunities, not threats.

It seems silver is going to loose its shine soonSilver (XAGUSD) prices are near all time high, hovering near the VAH logarithmically on monthly chart. Highly cautious period next one or two months. Keep watching !!

JINDALSTEEL | Flag continuationStrong prior impulse, orderly flag structure
-RSI >50, EMAs rising, OBV confirms accumulation
-Sector tailwind: strength in metals
Trade plan:
-Buy > 1100 (volume confirmation required)
-SL: 1030
-Positional target: 1770
-R:R ≈ 1:11

SILVER (XAGUSD) – Weekly Projection Analysis (24-01-26)
Overall Bias: 🔥 Strong Bullish
🔹 Market Structure
Price is clearly inside a bullish channel
Previous trendline break → clean retest
Retest aligns perfectly with 50% Fibonacci level
👉 This is a high-probability continuation zone
🔹 Key Levels
Support S2: ~96
Support S1: ~99–100
Entry Zone: Broken trendline + 50% Fibo (around 100)
Stop Loss: Below ~96 (structure protection)
Resistance R1: ~112–114
Target Zone: 115 – 120+ (New ATH zone) 🚀
🔹 Candle Strength
Strong bullish impulse candle confirms buyers’ dominance
No major rejection wick → momentum intact
🔹 Projection Logic
Trend continuation inside channel
Higher highs & higher lows
Retest confirmation + momentum breakout = buy-on-dips strategy
🧠 Trading Plan Summary
✅ Buy on retracement
✅ SL below structure
✅ Partial booking near R1
✅ Hold runner for ATH expansion

Gold ATH Is Not Random – It’s a War to Defend the USDBombs and bullets are just smoke screens.
The real war is about who still controls the world’s money.
And that’s why Trump appears at the right time.
This is not a shooting war.
It’s a war to protect the US dollar.
If you look at US actions separately, everything feels messy:
Pressure on Iran
Sanctions and control over Venezuela
Tough stance with Russia, yet still talking
For new traders → it looks chaotic.
But once you put everything on one chessboard, there’s only one objective:
👉 Make sure the world still needs USD.
Not oil.
Not Iran.
Not Venezuela.
👉 Settlement currency.
Why is USD so important?
The US today:
Doesn’t compete on cheap labor
Doesn’t mass-produce low-cost goods
Doesn’t live off exports
👉 The US lives on money and the financial system.
If USD loses its central role:
Printing money becomes hard
National debt becomes a real burden
Military power loses its “credit-backed” strength
👉 Lose USD = lose superpower status.
Where does the real problem start?
Some countries sell oil to China without using USD, instead using:
Chinese yuan
Bilateral swaps
Systems outside US control
👉 For the US, this is a direct attack on the foundation of its power,
without firing a single bullet.
So what is Trump doing?
Not fighting to seize oil.
Not fighting to take land.
👉 Trump is making non-USD oil trading risky.
Very pragmatic moves:
Creating controlled instability
Disrupting “off-system” oil flows
Forcing countries back to USD because… it’s safer
A simple example for traders
Imagine a market where only one currency is accepted.
You want to buy anything?
You must use that currency.
One day, some stalls say:
“We’ll accept another currency. It’s cheaper.”
The market owner doesn’t shut them down.
He just:
Makes selling harder
Increases delivery risks
Tightens inspections
👉 Eventually, those stalls go back to the old currency to avoid headaches.
That’s exactly how USD and oil work.
Putting it all together – the trader’s view
Iran – Venezuela – Middle East
These are not random events.
👉 This is a war to maintain the monetary order.
Trump:
Isn’t fighting for oil
Isn’t fighting for morality
👉 He’s fighting for the settlement currency.
Anyone who makes the world less dependent on USD
automatically becomes a target.
CONCLUSION – trader style, slightly sarcastic 😄
Gold ATH is not the market being crazy.
👉 It’s the result of a war to protect the global “toll currency.”
If you understand this:
Charts feel less “stupid”
You stop wanting to short every high candle
Your account suffers less heart attacks
But wait 😄
The real question is:
If the big players are fighting a monetary chess game,
where should retail traders stand to avoid getting wiped out?
In the next part, I’ll talk about:
Why SELLING gold at ATH is extremely hard to survive
When chasing BUYs is stupid – and when it’s actually right
How traders can protect their rice bowl when the chart runs like it’s being chased
👉 If this hits home, drop a 🚀
Enough 🚀 and I’ll continue – no secrets 😏

SILVER - HEALTHY CONSOLIDATION LONGSSilver doing a healthy consolidation - momentum intact.
very strong support for momentum to continue is $90, belov that momentum vill be lost.
small resistance at $93.50
major resistance at $95.50 - $96
above $96 v should likely test 3digits - $100.
above that vill be a price discovery one can trail at ST 1.5 on 75m chart.

XAUUSD – H2 Technical AnalysisLiquidity Pullback Within a Strong Bullish Structure | Lana ✨
Gold continues to trade within a well-defined bullish structure on the H2 timeframe. The recent surge was impulsive, followed by a healthy retracement that appears to be rebalancing liquidity rather than signaling a trend reversal.
Price action remains constructive as long as the market respects key structural levels and the ascending trendline.
📈 Market Structure & Trend Context
The overall trend remains bullish, with higher highs and higher lows still intact.
Price continues to respect the ascending trendline, which has acted as reliable dynamic support throughout the uptrend.
The recent pullback occurred after an aggressive upside expansion, fitting the classic sequence:
Impulse → Pullback → Continuation
No clear distribution pattern is visible at this stage. As long as structural support holds, the bias remains BUY on pullbacks, not selling strength.
🔍 Key Technical Zones & Value Areas
Primary Buy POC Zone: 4764 – 4770
This area represents a high-volume node (POC) and aligns closely with the rising trendline.
It is a natural zone where price may rebalance before resuming the bullish trend.
Secondary Value Area (VAL–VAH): 4714 – 4718
A deeper liquidity zone that could act as support if sell pressure temporarily increases.
Near-term resistance: 4843
Acceptance above this level strengthens the continuation scenario.
Psychological reaction zone: 4900
Likely to generate short-term hesitation or profit-taking.
Higher-timeframe expansion targets:
5000 (psychological level)
2.618 Fibonacci extension, where major liquidity may be resting.
🎯 Trading Plan – H2 Structure-Based
✅ Primary Scenario: BUY the Pullback
Buy Entry:
👉 4766 – 4770
Lana prefers to engage only if price pulls back into the POC zone and shows bullish confirmation on H1–H2 (trendline hold, strong rejection of lower prices, or bullish follow-through).
Stop Loss:
👉 4756 – 4758
(Placed ~8–10 points below entry, beneath the POC zone and the ascending trendline)
🎯 Take Profit Targets (Scaled Exits)
TP1: 4843
First resistance zone — partial profit-taking recommended.
TP2: 4900
Psychological level with potential short-term reactions.
TP3: 5000
Major psychological milestone and upside expansion target.
TP4 (extension): 5050 – 5080
Area aligned with the 2.618 Fibonacci extension and higher-timeframe liquidity.
The preferred approach is to scale out gradually and protect the position, adjusting risk as price confirms continuation.
🌍 Macro Context (Brief)
According to Goldman Sachs, central banks in emerging markets are expected to continue diversifying reserves away from traditional assets and into gold.
Average annual central bank gold purchases are projected to reach around 60 tons by 2026, reinforcing structural demand for gold.
This ongoing accumulation supports the idea that pullbacks are more likely driven by positioning and profit-taking, rather than a shift in long-term fundamentals.
🧠 Lana’s View
This remains a pullback within a bullish trend, not a bearish reversal.
The focus stays on buying value at key liquidity zones, not chasing price at highs.
Patience, structure, and disciplined execution remain the edge.
✨ Respect the trend, trade the structure, and let price come to your zone.

Gold (XAUUSD) ABCD Completion Near 5000 – Major Sell Zone Ahead
Gold has been in a strong long-term bullish trend, driven by macro uncertainty and persistent demand. However, from a structural and harmonic perspective, price is now approaching a critical long-term resistance zone near the 5000 level, where a bearish ABCD pattern is nearing completion.
The current rally appears to be the final leg (CD) of the ABCD structure. Completion around the psychological 5000 round number also aligns with historical extension behavior and potential exhaustion after an extended impulsive move.
Primary Scenario:
Watch for price rejection, reversal patterns, or bearish confirmation near the 5000 region.
A confirmed rejection could open the door for a long-term corrective move, potentially targeting the previous demand / consolidation zone.
Invalidation:
A strong acceptance and sustained close well above 5000 would invalidate the bearish ABCD outlook and suggest continuation higher.
