Update the latest gold price todayGold kicks off the new week with a sharp drop, sliding to around $3,258/oz, down more than $14 from Friday’s close. The primary driver behind this decline is the easing geopolitical tension in the Middle East, following a ceasefire agreement between Israel and Iran, which has significantly reduced demand for safe-haven assets.
In addition, stubborn inflation and weak global growth are forcing central banks — especially the Federal Reserve — to keep interest rates elevated for longer. This policy stance continues to pressure gold prices.
From my perspective, gold had surged too quickly in recent weeks due to geopolitical risks. Now that those tensions have calmed, capital is flowing out of gold and rotating into risk-on assets like stocks, bonds, and real estate.
Looking ahead, this week brings a wave of high-impact economic data from the US, Eurozone, China, and Japan — including the June PMIs from the US and China, and preliminary CPI from the Eurozone. These releases are likely to shape gold’s short-term direction.
For now, the bearish bias remains, with $3,300 acting as a key resistance level to watch.
Metals

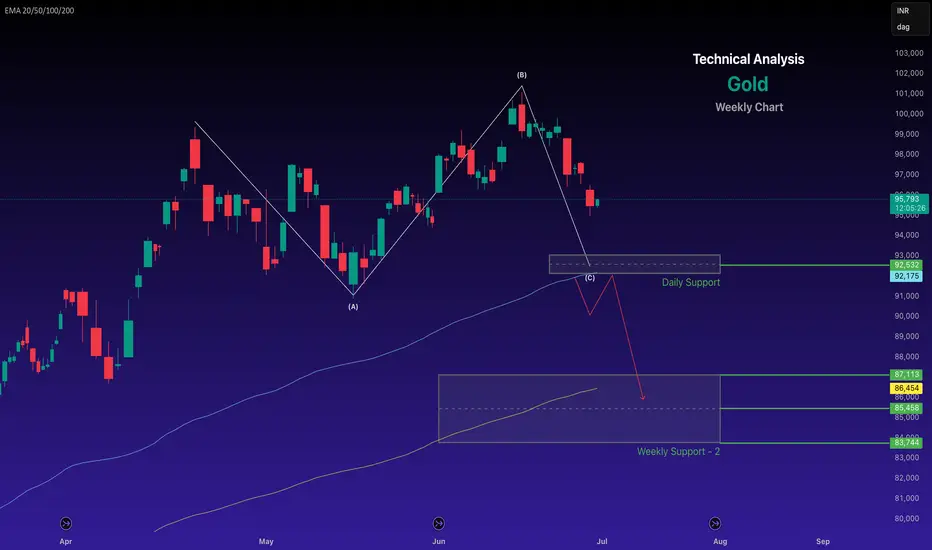
Gold retains a bearish trend after breaching support.Weekly Technical Analysis for Gold
Chart for the reference
- Disclaimer --
This analysis is based on recent technical data and market sentiment from web sources. It is for informational purposes only and not financial advice. Trading involves high risks, and past performance does not guarantee future results. Always conduct your own research or consult a SEBI-registered advisor before trading.
#Boost and comment will be highly appreciated
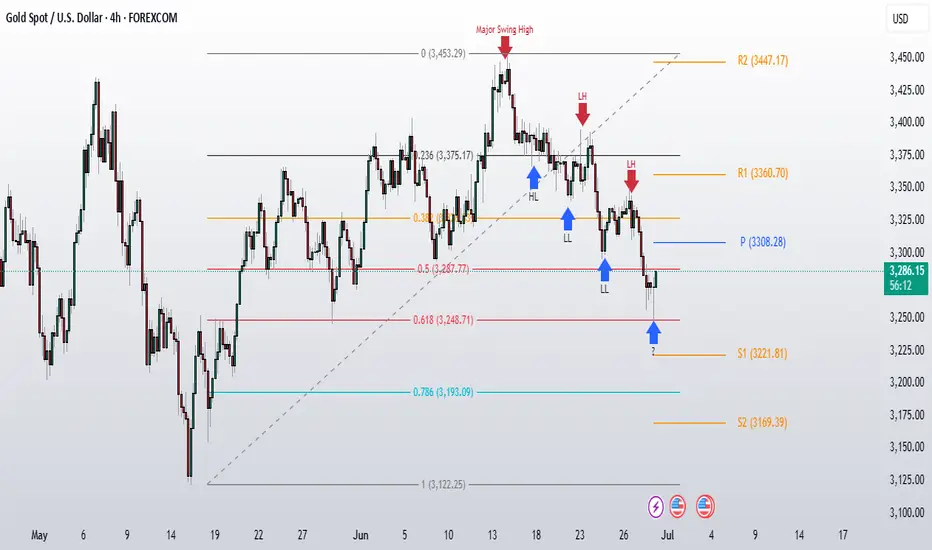
Gold Weekly Analysis: Breaking Down After 3300 Support FailureCurrent Market Structure:
Gold breakdown below critical 3300 support level last Friday, and more importantly, we closed the week below this key psychological level. This breakdown has shifted the technical structure, and we're now seeing a clear pattern of lower highs (LH) and lower lows (LL) developing as gold enters a downside correction phase.
The weekly pivot has dropped to 3308, showing a descending formation compared to last week's pivot at 3386. This descending pivot structure confirms the bearish momentum that's been building.
Level to Watch:
3308 Weekly Pivot - This is our key reversal level for this week. For any meaningful bullish recovery, we need to see:
1. A convincing breakout above 3308 on higher timeframes
2. Price sustaining above this level
3. Breaking the current LH/LL bearish structure
Without these conditions being met, any rallies should be treated as counter-trend bounces rather than genuine reversals.
Support Zones:
Immediate Support: 3248-3287 (Fibonacci Golden Zone)
This is our primary support area to watch. It's a confluence zone that could provide a decent bounce opportunity if we get there.
Deeper Support Levels:
- 3221Weekly S1 support
- 3200 Major psychological level
If the golden zone fails to hold and we see a breakdown there, these lower levels become our next areas of interest.
The bears are in control of the weekly structure right now. Any recovery attempts need to prove themselves by reclaiming 3308 and holding it on higher timeframes. Until then, we're in correction mode with Fibonacci support levels as our key support area.
30/06: WILL WE SEE A RECOVERY ON THE LAST DAY OF THE MONTH? GOLD PLAN – 30/06: WILL WE SEE A RECOVERY ON THE LAST DAY OF THE MONTH? ☄️
✅ Macro Context – Focus on USD Debt and Political Pressure
As June comes to a close, the US faces a major $6 trillion debt maturity from COVID-era borrowings, creating potential stress on USD liquidity and overall market sentiment.
Gold saw a sharp dip to the 32xx range during the Asian session but has bounced back and is currently hovering near last week's closing levels.
While the medium-term outlook remains bearish, short-term signals are showing signs of a potential recovery.
✅ Political Catalyst:
Trump’s Pressure on Fed: Trump is pushing the Federal Reserve to cut interest rates to 1%-2%, saying he won’t appoint anyone unwilling to ease monetary policy.
This has sparked expectations for potential rate cuts, which could provide support for gold prices in the near term.
✅ Technical Outlook – Multi-timeframe Structure
Gold continues its downward correction on higher timeframes. However, short-term candles are indicating recovery momentum, with buying activity near the 327x zone.
Today's Strategy: Focus on short-term BUY setups that align with the recovery wave.
✔️ Key Resistance & Support Levels
🔺 Resistance: 3283 – 3291 – 3301 – 3322
🔻 Support: 3277 – 3271 – 3259 – 3247
🔖 Trade Scenarios
✅ Buy Scalping
🔺 Entry: 3272 – 3274
🔹 SL: 3268
✔️ TP: 3282 → 3288 → 3298
✅ Buy Zone
🔺 Entry: 3249 – 3251
🔹 SL: 3244
✔️ TP: 3265 → 3282 → 3295 → 3310
💠 Sell Scalping
🔺 Entry: 3298 – 3300
🔹 SL: 3304
✔️ TP: 3292 → 3282 → 3270
💠 Sell Zone
🔺 Entry: 3327 – 3329
🔹 SL: 3333
✔️ TP: 3322 → 3310 → 3298 → 3282
⚡️ Final Note
As we near the end of the month, expect possible volatility due to USD flows and institutional rebalancing, which could create further opportunities in the gold market.

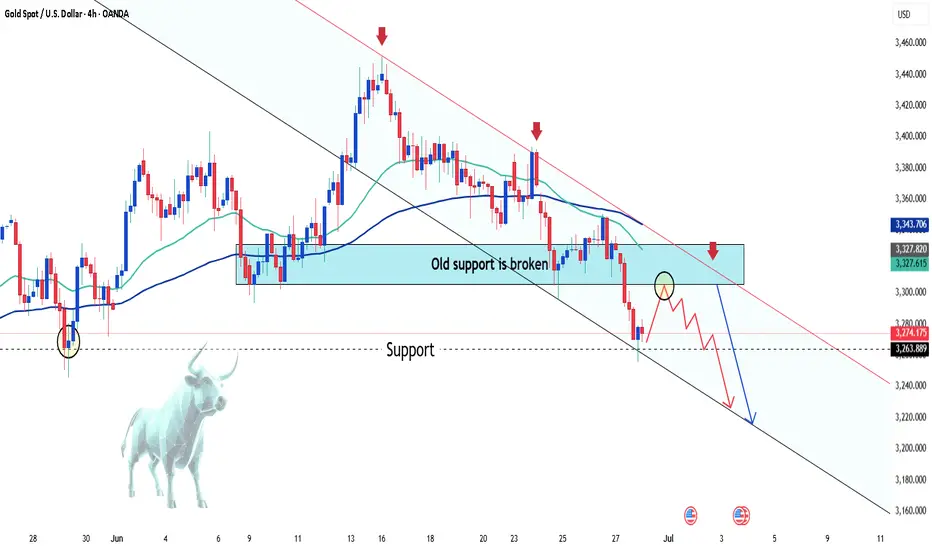
Gold in Free Fall – Is This Just the Beginning?Hey fellow traders!
Today, gold is taking a serious dive — price has crashed below the critical $3,300 support, and things aren't looking great for the bulls. The chart says it all: the old support zone has been wiped out, and the recent minor bounce? Just the calm before a deeper selloff.
💣 What’s dragging gold down?
-The reasons are crystal clear:
-US Treasury yields are spiking, pulling capital away from gold.
-The US dollar is rebounding strongly, boosted by hawkish Fed commentary.
Global markets are optimistic, with geopolitical tensions easing — which means gold is losing its safe-haven appeal.
In short: there's not much left to keep gold afloat right now.
📉 Technical outlook – Breaking down and breaking lower?
On the H4 chart, gold has officially lost the EMA 34 (~$3,322) — a key dynamic support that's held multiple times in the past. With that breach, sellers rushed in. Price is now sliding toward the bottom of the descending channel, targeting $3,240, and possibly $3,200 if bearish momentum continues.
And if gold pulls back to retest the broken zone? Don’t celebrate too soon — it could be the perfect trap for sellers to reload.
So, what’s your take?
GoldGold ( OANDA:XAUUSD ) – Bearish Wyckoff Distribution (Unorthodox) in Play
Gold is currently trading around $3273/oz and appears to be in Phase D of a Bearish Wyckoff Distribution Schematic #1 (Unorthodox) on the 4H chart. The price is showing signs of weakness, but a final upthrust toward $3370 can’t be ruled out before a deeper breakdown.
Key level to watch:
⚠️ Breakdown confirmation below $3260–3200 could open the gates for a sharper decline.
Bearish structure still unfolding – traders should stay alert for signs of a last bull trap before distribution completes.
#Gold #XAUUSD #Wyckoff #TechnicalAnalysis #CommodityTrading #PriceAction

XAUUSD Bullish Reversal from Channel Support | Gold Buy SetupAnalysis Overview:
Gold has been trading inside a clearly defined descending channel (marked by the orange trendlines). After a strong bearish move, price has reached the lower boundary of this channel, which is acting as dynamic support.
Key Technical Details:
Descending Channel Support: XAUUSD has tested the lower trendline multiple times and is currently showing rejection wicks, suggesting potential exhaustion of selling pressure.
Demand Zone: The shaded horizontal area represents a prior consolidation and minor support level that aligns with the channel bottom, adding strong confluence.
Entry: Planned buy entry at the current level near channel support, anticipating a bounce.
Stop Loss: Placed below the recent swing low and outside the channel, to allow room for volatility while protecting against continuation of the downtrend.
Target: The mid-to-upper boundary of the descending channel, aiming for a favorable risk-reward ratio.
Market Context: The higher timeframe trend remains bearish overall, so this is a short-term reversal (counter-trend) setup within the channel structure.
Trade Plan Rationale:
Expecting a corrective move upward within the descending channel as price retests previous supply zones and dynamic resistance. This setup is based on:
Confluence of channel support and demand zone
Multiple rejection wicks showing buyers stepping in
Potential mean reversion towards the channel midpoint
Disclaimer:
This is my personal analysis on XAUUSD and not financial advice. Always do your own research and manage risk carefully.

Gold at Crucial 325x Support – What's Next for the Yellow Metal?XAUUSD D1 Forecast: Gold at Crucial 325x Support – What's Next for the Yellow Metal?
Namaste, fellow traders!
Today, let's zoom out and look at the bigger picture for Gold (XAUUSD) on the Daily (D1) timeframe. Our analysis indicates that Gold has hit a very strong, hard support level around the 325x region. This is a pivotal point that could dictate Gold's medium to long-term direction!
🌍 Macroeconomic Context: The Forces at Play for Gold
While we've seen some USD weakness due to speculations surrounding the Fed (like the rumors about replacing Powell) and expectations of rate cuts, these factors haven't completely prevented Gold's recent decline on the daily chart. Also, the sustained ceasefire between Israel and Iran is reducing Gold's safe-haven appeal.
However, the current price action at the robust 325x support level is a significant technical signal. The influence of upcoming US macroeconomic data (especially the PCE Index on Friday) and speeches from FOMC members will be crucial in confirming or negating Gold's next moves. If positive news for Gold aligns with this support holding, it could act as a strong catalyst.
📊 XAUUSD Technical Analysis (D1): Predicting Gold's Next Move
Based on the fact that Gold has encountered strong support at 325x, we can anticipate the following scenarios:
Bounce from 325x (Potential Upside Phase):
If the 325x area (which reinforces the 3264.400 support from image_e9d325.png) holds firm, we expect a strong reaction and an upward move for Gold.
The initial target for this bounce would be the 332x region, which aligns with resistance levels 3313.737 - 3330.483 from our previous analysis. On a broader timeframe (as shown in image_83845c.png), this corresponds to the resistance zone around 3326.022. This 332x area could represent a continuation pattern, meaning it might be a corrective rise before the resumption of the larger trend.
Resumption of Downtrend (After Reaching 332x):
Once Gold reaches and tests the 332x zone (3313.737 - 3330.483 / 3326.022) and shows bearish confirmation signals (e.g., a strong bearish engulfing candle, a pin bar, or a clear top formation), we anticipate a resumption of the downward movement.
The next major target for this fall would be the 317x area, which correlates well with the strong support at 3173.052 on the larger timeframe (as depicted in image_83845c.png).
🎯 XAUUSD D1 Trading Plan: Your Long-Term Strategy Ahead!
Considering the current D1 analysis, here's our actionable plan:
1. BUY PHASE (Bounce from Support):
Entry: Observe price reaction in the 325x - 326x zone (especially 3264.400). Only buy if there are clear bullish confirmations (e.g., a confirmed bullish pattern on the daily or 4-hour candle, a strong bounce from the zone with volume).
SL: Just below the 325x support zone (e.g., 3245-3240, depending on confirmation).
TP: 3280 - 3290 - 3300 - 3313.737 - 3326.022 (key 332x zone). This will be our primary target for the bounce.
2. SELL PHASE (Downtrend Resumption):
Entry: After the price reaches the 332x zone (3313.737 - 3330.483 / 3326.022) and shows bearish confirmation signals (e.g., strong bearish engulfing, pin bar, or top formation).
SL: Slightly above the 332x zone (e.g., 3335-3340).
TP: 3300 - 3290 - 3280 - 3270 - 3260 - 3250 - 3200 - 3173.052 (final 317x target).

EURUSD Bulls in Charge – Can They Push Higher?EURUSD continues to demonstrate strength, maintaining a clear uptrend on the H4 timeframe. After breaking above the former resistance zone near 1.1600, price surged and is now consolidating around 1.1706. This breakout confirms strong bullish momentum, especially following a long period of consolidation.
That said, the area around 1.1730–1.1740 is showing signs of minor rejection, with a potential double-top pattern emerging. However, this appears to be a healthy pullback within the broader bullish trend.
The most reliable support is currently found at 1.1620, which also aligns with the EMA 34 — a dynamic level that has acted as a pivot throughout this rally.
As long as price remains above 1.1620, the bullish trend remains firmly intact.

Gold Pullback in Play – Will $3,300 Be Hit Today?Hello traders!
What’s your take on gold today?
OANDA:XAUUSD remains tilted to the downside, currently trading around $3,318, down over 100 pips on the day.
The bearish bias is still favored — and the reason is pretty clear. For short-term traders using pattern-based setups, gold has broken out of a flag pattern and successfully retested the breakout zone, confirming a potential reversal.
If this momentum holds, the next target could be $3,300 by the end of the day.
Do you agree with this scenario?

XAUUSD: Gold's Golden Glow Fades Below $3350 XAUUSD: Gold's Golden Glow Fades Below $3350 – Navigating Key Levels Amidst USD Weakness!
Let's dive into the fascinating world of Gold (XAUUSD) today. The yellow metal is showing subtle positive movement, primarily influenced by a weaker US Dollar, but a convincing bullish breakout above the $3350 mark remains elusive.
🌍 Macroeconomic Snapshot: USD's Woes & Gold's Mild Support
Gold has seen a slight positive bias for the second consecutive day, yet it's struggling to find significant follow-through, staying below the $3350 level in early European trading.
USD Under Pressure: Reports indicating that US President Donald Trump is considering replacing Fed Governor Jerome Powell have sparked concerns regarding the future independence of the US central bank.
Cautious Outlook: This mixed bag of news calls for caution before confirming a definitive bottom for Gold or positioning for a substantial recovery from levels below $3300 (or Tuesday's two-week low). Traders are currently focused on upcoming US macroeconomic data and speeches from FOMC members, which could influence XAU/USD ahead of Friday's crucial US Personal Consumption Expenditures (PCE) Price Index release.
📊 XAUUSD Technical Analysis & Intraday Trading Plan:
Current Trend: Gold has recently experienced a sharp decline and is now in a consolidation phase, trading around the $329X mark. Price is currently below shorter-term moving averages, indicating lingering bearish pressure or an accumulation phase.
Key Levels Identified:
Strong Support Zones (Potential BUY Areas): Levels around 3294.414, 3276.122, and particularly 3264.400 are crucial demand areas.
Key Resistance Zones (Potential SELL Areas): Levels at 3313.737, 3321.466, 3330.483, and 3341.947 are identified as significant supply zones.
🎯 XAUUSD Trading Plan (Based on your specified levels):
BUY ZONE (Strong Support - Long-Term Bias):
Entry: 3266 - 3264
SL: 3270
TP: 3280 - 3284 - 3290 - 3295 - 3300 - 3305 - 3310 - 3320
BUY SCALP (Quick Buy at Intermediate Support):
Entry: 3284 - 3282
SL: 3278
TP: 3288 - 3292 - 3296 - 3300 - 3305 - 3310 - 3320 - 3330
SELL ZONE (Key Resistance):
Entry: 3331 - 3333
SL: 3337
TP: 3326 - 3320 - 3316 - 3310 - 3305 - 3300
SELL SCALP (Quick Sell at Near Resistance):
Entry: 3313 - 3315
SL: 3320
TP: 3310 - 3305 - 3300 - 3295 - 3290 - 3280
⚠️ Key Factors to Monitor Closely:
US Macro Data: The upcoming US Personal Consumption Expenditures (PCE) Price Index on Friday is critical.
FOMC Member Speeches: Any comments on monetary policy or inflation outlook will directly impact USD and Gold.
Geopolitical Stability: Developments regarding the Israel-Iran ceasefire can influence safe-haven demand.

Gold's Price Action Amidst Fed's Inflationary Warnings XAUUSD: Gold's Price Action Amidst Fed's Inflationary Warnings – Key Levels to Watch!
Hello TradingView Community!
Gold (XAUUSD) continues to be a focal point amidst the Federal Reserve's (Fed) cautious stance on inflation and interest rates. Recent statements from Fed Chair Jerome Powell highlight concerns that large-scale tariffs could trigger persistent inflation, moving beyond conventional economic models. Despite recent inflation cooling, Powell emphasized the need for more data from June and July before considering any rate cuts, warning of the risk that "price shocks turn into persistent inflation".
This creates a nuanced market sentiment, torn between hopes for rate cuts and the emerging inflation risk from tariffs. In this environment, Gold remains a crucial psychological anchor, especially if the Fed delays its reaction to new inflationary pressures.
📊 XAUUSD Technical Outlook (H4/M30 Chart Analysis):
Based on our recent chart analysis (e.g., image_008403.png): Gold is currently in a corrective or consolidating phase after a notable pullback. Price action indicates that key support and resistance levels are being tested.
Resistance Levels (Potential Sell Zones): We see significant resistance around 3352.383 - 3353.860 and higher up at 3371.205, with a major resistance area near the top at 3391.750 - 3395.000.
Support Levels (Potential Buy Zones): Key support is identified around 3317.738 - 3311.214, with a stronger demand zone at 3302.939 - 3302.857. A critical lower support lies at 3286.257.
🎯 XAUUSD Intraday Trading Plan:
Here are the key zones and targets for today, based on current market dynamics:
BUY SCALP:
Entry: 3316 - 3314
SL: 3310
TP: 3320 - 3324 - 3328 - 3332 - 3336 - 3340
BUY ZONE:
Entry: 3304 - 3302
SL: 3298
TP: 3308 - 3312 - 3316 - 3320 - 3330 - 3340 - 3350
SELL SCALP:
Entry: 3353 - 3355
SL: 3360
TP: 3350 - 3345 - 3340 - 3335 - 3330
SELL ZONE:
Entry: 3390 - 3392
SL: 3396
TP: 3386 - 3382 - 3378 - 3374 - 3370 - 3360
⚠️ Key Factors to Monitor:
Fed Speeches: Any further comments from Fed officials on inflation or policy outlook.
US Economic Data: Upcoming inflation (CPI, PCE) and employment reports (NFP) will heavily influence Fed policy expectations.
Geopolitical Developments: Ongoing global tensions can always boost Gold's safe-haven appeal.

Gold Technical Update: Is Tuesday's Low the Bottom ?It looks like we printed our low on Tuesday (June 24th), and now gold is showing some signs of reversal with the current bounce. The key question is whether this momentum can sustain itself through some critical resistance zones.
Key Resistance Levels to Watch:
3350-55 - This is our first major test. this level is the confluence with the 0.38 Fibonacci retracement level. If we see a clean break here with volume, it sets up the next target.
3380-85 - This is the big one for today and this week. this level also aligns with the weekly pivot. If the bulls can claim this territory and hold it into the close, we're likely looking at a continuation higher toward upper levels around 3400+.
Support Levels:
The PDL is now acting as our immediate support level. Below that, we've still got that psychological 3300 level as major support ,the same area that provided the floor earlier this week.
Ready for a Fresh Rally Ahead of July FOMC Buzz?XAUUSD: Powell's "Soft Tone" Ignites Gold – Ready for a Fresh Rally Ahead of July FOMC Buzz?
🌍 Macro Landscape: Gold Reacts to Fed's Cues – Easing Rate Pressures?
The gold market (XAUUSD) is witnessing a resurgence of positive momentum, driven by recent "dovish-leaning" signals from Federal Reserve Chair Jerome Powell during his congressional testimony. Powell's acknowledgment of lower-than-expected inflation from tariffs, coupled with hints of a potential earlier interest rate cut (possibly as early as July), is creating a fresh wave of market anticipation.
While Powell cautiously noted "no need to rush," market participants are interpreting his remarks as an indication that current monetary policy might be "somewhat restrictive." Should inflation continue its sustainable deceleration, the Fed would be poised to ease policy sooner. This directly impacts gold: as rate cut expectations rise, the opportunity cost of holding gold (a non-yielding asset) diminishes, making it significantly more appealing to investors.
🏦 Central Bank Policy: Fed's Evolving Stance & Market Re-calibration
Federal Reserve (Fed): Chair Powell's nuanced message suggests a more adaptable Fed, ready to align its policy with actual inflation data. His emphasis on the Fed's independence from political influence further solidifies confidence in data-driven decisions.
Market Re-calibration: While the broader market still leans towards a September rate cut, the probability of a July cut is subtly increasing, according to the CME FedWatch Tool (with 70.1% anticipating a cut to 4.00 - 4.25% by September). This re-pricing of policy risk is a crucial supportive factor, helping gold maintain stability around the $3,300–$3,320/oz mark, indicating smart money accumulation.
This evolving Fed perspective, even a slight shift, is powerful enough to influence capital flows and investor sentiment globally, setting the stage for significant gold movements.
🌐 Capital Flows: Gold & USD – The Shifting Safe-Haven Dynamics
Global capital flows are highly sensitive to interest rate expectations and perceived risks. Historically, both gold and the U.S. dollar serve as primary safe havens during periods of uncertainty.
If Powell's "dovish tilt" gains further traction and leads to earlier rate cuts, we could anticipate a notable rotation in capital:
Outflows from USD: Lower U.S. yields would diminish the attractiveness of the USD as a yielding asset.
Inflows into Gold: The reduced opportunity cost of holding gold, combined with its intrinsic store-of-value appeal, could trigger substantial capital flows into the precious metal, especially amidst persistent global geopolitical tensions.
The market's re-evaluation of Fed policy risk is already contributing to gold's resilience, suggesting that strategic positioning for an upside move might be underway.
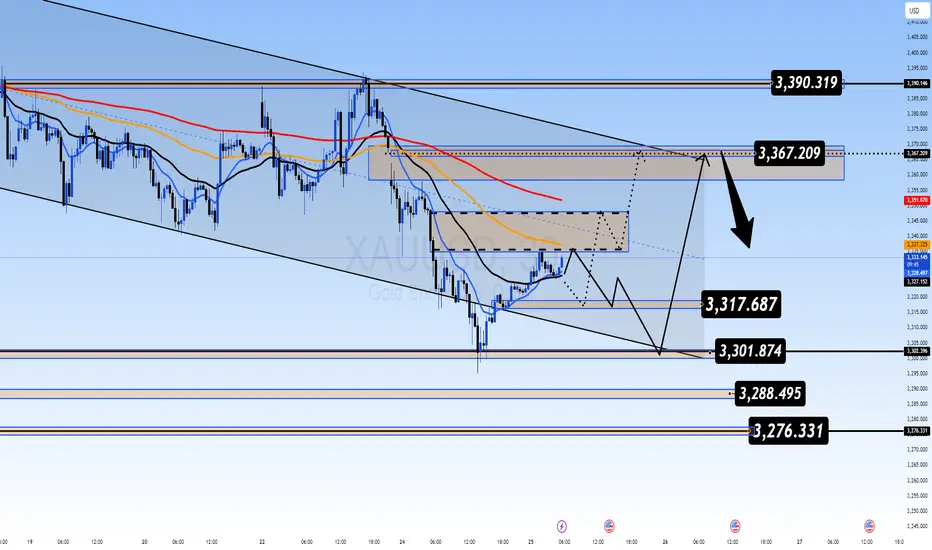
📊 Technical Structure (H4/M30 Chart Analysis): Gold Breaking Bearish Bias, Targeting Higher Levels
Based on the provided XAUUSD chart (H4/M30 timeframe):
Channel Breakout: Gold has visibly broken out of a prior descending channel, signaling a clear weakening of selling pressure and a potential trend reversal. The price is currently consolidating and appears to be forming a new accumulation pattern or a smaller ascending channel.
Key Price Levels:
Potential Sell Zone (Resistance): Around 3,352.383 - 3,371.205. This zone aligns with significant Fibonacci retracement levels (0.5 and 0.618 from the last major swing down) and represents a strong historical resistance cluster. If the price attempts to breach this zone and fails, selling pressure could emerge.
Higher Resistance: 3,391.750 - 3,395.000. This is a formidable resistance area. A decisive break above this level would confirm a more robust long-term bullish trend.
Current Buy Zone (Support): Around 3,302.939 - 3,311.214. This is a critical demand zone, where strong buying interest is likely to surface, coinciding with recent swing lows.
Next Key Support: 3,286.257. Should the 3,302.939 - 3,311.214 zone be breached, this level would be the next significant support to watch.
Moving Averages (EMA 13-34-89-200):
The price is currently trading above the shorter-term EMAs (13 & 34), indicating positive short-term momentum.
The longer-term EMAs (89 & 200) are likely transitioning from resistance to dynamic support, or showing signs of convergence, suggesting a potential shift in market structure. A 'Golden Cross' formation among these EMAs would be a powerful bullish signal.
Projected Price Action: The chart depicts a scenario where the price might retrace slightly towards the 3,317.738 support or even deeper to 3,302.939 before embarking on a strong upward rally, targeting resistance zones like 3,352.383 and further to 3,371.205.
🎯 Trade Strategy Recommendations (Based on Provided Zones):
BUY ZONE: 3286 - 3284
SL: 3280
TP: 3290 - 3294 - 3298 - 3302 - 3306 - 3310 - 3315 - 3320
BUY SCALP: 3302 - 3300
SL: 3295
TP: 3306 - 3310 - 3314 - 3318 - 3322 - 3326 - 3330
SELL ZONE: 3353 - 3355
SL: 3360
TP: 3350 - 3346 - 3340 - 3335 - 3330 - 3320
SELL ZONE: 3372 - 3374
SL: 3378
TP: 3370 - 3366 - 3362 - 3358 - 3354 - 3350
⚠️ Key Events to Watch:
Further Speeches by Fed Officials: Any new comments on inflation, economic data, or the rate path will heavily influence market dynamics.
Global Geopolitical Developments: Ongoing tensions or new uncertainties can always bolster gold's safe-haven appeal.
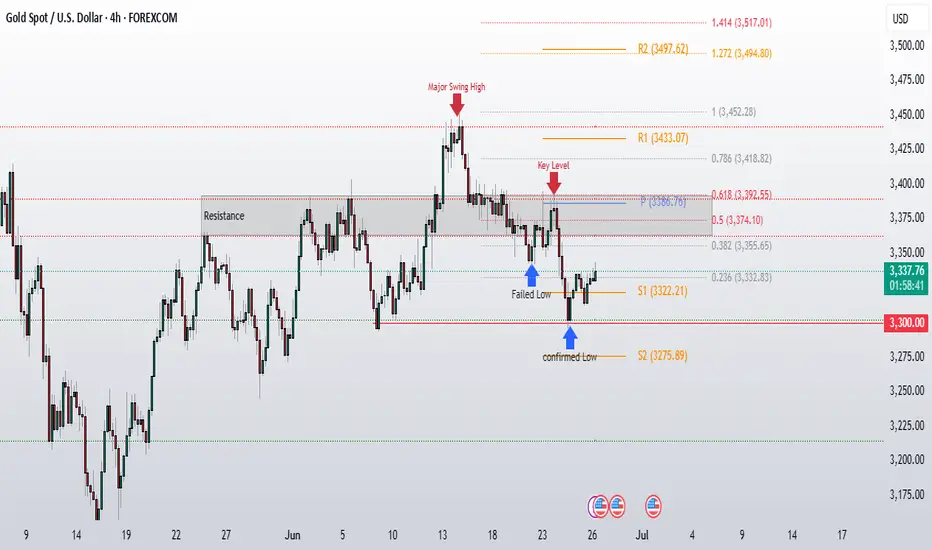
Gold tested 3300, what next ?Yesterday's breakdown below the 3345-50 area created a failed low scenario, and gold tested psychological 3300 level before finding some support.
Right now we're seeing a bit of correction higher from yesterday's lows, but this is still unconfirmed territory. For intraday 3330-33 resistance zone .
If gold manages to push through with decent momentum, the next major hurdle zone is up at 3360- 3385. but as long as we're staying under 3330 and especially under 3360, any upward movement as a pullback rather than a true reversal .
For a genuine reversal to take hold,we need good bullish candle follow up today and gold needs to break above 3360- 3385 convincingly without revisiting yesterday's lows. and have to re claim 3450, which would signal a more significant shift in sentiment.

Macro Pressure or Opportunity to Accumulate?XAUUSD 24–28 June: Gold Slides to Buy Zone – Macro Pressure or Opportunity to Accumulate?
🔍 Macro Outlook – A Volatile Week for Gold Traders
Gold is navigating through a complex macroeconomic landscape this week, with multiple factors weighing in:
✅ Middle East Tensions Resurface
Israel has declared plans to retaliate against Iran following a ceasefire violation, increasing geopolitical risk. This situation historically supports safe-haven demand for gold when it escalates.
✅ US Economic Data May Soften Fed’s Tone
The U.S. economy is showing early signs of cooling:
Housing market data fell short of expectations.
PMI data indicates manufacturing and services are slowing.
If the Core PCE Index (set to release this week) confirms soft inflation, expectations for a Fed rate cut in September may solidify, putting pressure on the USD and boosting gold.
✅ China & India Are Stocking Up on Gold
India’s jewelry and central bank demand is on the rise ahead of budget season. Meanwhile, China continues to increase its gold reserves for the 19th consecutive month, offering underlying support to the price.
📉 Technical Analysis – Is the Correction Bottoming Out?
XAUUSD remains in a downward-sloping channel on the H1/H4 chart, but prices are approaching key support zones with strong historical demand.
EMA 34 – 89 – 200 still show downward momentum.
However, RSI divergence is forming on the lower timeframes, signaling potential bullish pressure.
A clear FVG (Fair Value Gap) around the $3367–$3369 zone presents a strong liquidity zone for reversal.
✅ Trading Plan for XAUUSD
🔵 BUY ZONE: $3278 – $3276
Stop Loss: $3270
Take Profits:
TP1: $3282
TP2: $3286
TP3: $3290
TP4: $3294
TP5: $3298
TP6: $3302
TP7: $3305
TP8: $3310
📌 Reason to Buy: Price is approaching the bottom of the descending channel with visible demand zone, enhanced by RSI divergence and macro geopolitical pressure favoring safe-haven flows.
🔴 SELL ZONE: $3367 – $3369
Stop Loss: $3375
Take Profits:
TP1: $3364
TP2: $3360
TP3: $3356
TP4: $3352
TP5: $3348
TP6: $3344
TP7: $3340
TP8: $3330
TP9: $3320
📌 Reason to Sell: This is a key FVG resistance area where sellers have previously stepped in aggressively. If price retests without momentum, it's likely to reject back toward support.
📎 Summary for Indian Traders
This week’s gold strategy is a balance between short-term technical plays and long-term macro shifts. Keep your eyes on PCE data, USD movement, and any flare-up in Middle East tensions. Each of these could serve as catalysts for either a bounce or continuation.

Gold Slips Sharply Ahead of Key US DataGold (XAUUSD) kicked off the week with a steep decline, currently hovering around $3,345 — down over 200 pips from the session’s open. This move unfolds just ahead of a series of major US economic releases, including PMI figures, Q1 GDP, and most importantly, the Core PCE Index — the Fed’s preferred inflation gauge.
Markets are anticipating that Core PCE will remain elevated, reinforcing the case for prolonged high interest rates, which in turn adds pressure on safe-haven assets like gold.
From a technical perspective, the short-term chart has just formed a price GAP. If buyers capitalize on this setup, there’s a potential opportunity to target a gap fill. However, bearish pressure remains strong. If any recovery fails to break above the $3,389 resistance zone, traders should consider sticking with the prevailing downtrend.
Wishing you a successful trading day ahead!

XAU/USD Double Bottom Breakout Bullish Momentum Incoming!🔄 XAU/USD Double Bottom Breakout 💥 | 🚀 Bullish Momentum Incoming!
Analysis:
🟡 Double Bottom Pattern: Two clear lows have formed around the $3,340 support, signaling a potential reversal.
🟦 Accumulation Zone: The price consolidated in a range, indicating strong buying interest before the breakout.
🟣 Bullish Momentum: Recent aggressive bullish candles show strong buying pressure.
📈 Breakout & Retest Zone: If the price holds above $3,370, a bullish continuation toward $3,409 and possibly $3,445 is expected.
🧭 Target Area: Marked with a blue box, the upside potential is clearly projected.
Conclusion:
A successful retest of the breakout level may lead to a strong bullish run. Keep an eye on $3,370 as the pivot zone. 🎯

Fibonacci extension, sell gold 3375Plan XAU day: 23 June 2025
Related Information:!!!
Gold price (XAU/USD) maintains its bearish tone during the first half of the European session, although it lacks strong momentum due to mixed fundamental signals. The US attack on Iran’s nuclear facilities on Sunday increases the risk of a wider conflict in the Middle East and reinforces the US Dollar's (USD) position as the global reserve currency. In addition, the Federal Reserve’s (Fed) hawkish stance is seen as another factor supporting the greenback and putting downward pressure on the non-yielding yellow metal.
personal opinion:!!!
Gold price recovered and continued to accumulate, using extended fibonacci to find selling points to adjust wave 4 on H1 frame
Important price zone to consider : !!!
SELL point: 3375 zone
Sustainable trading to beat the market

XAUUSD 23/06 – Bears Losing Steam as FVG Zone Returns to PlayXAUUSD – Gold Sets Up for a Strategic Bounce Amid Fed Dovish Shift and Yield Retreat
📊 MACRO & FUNDAMENTAL INSIGHTS – WEEK AHEAD
Gold enters the final week of June with renewed investor focus amid softening Fed rhetoric and weakening US Treasury yields. Here's what Indian traders need to watch:
🔻 Fed Signals & Rate Cut Bets Rising
Jerome Powell’s upcoming speech and comments from FOMC members will shape the tone. Market now prices in a 65% probability of a rate cut in September, according to CME FedWatch.
If Powell leans dovish, expect renewed demand for non-yielding assets like gold. Conversely, hawkish surprises may pressure prices downward.
📉 US Dollar and Bond Yields Losing Momentum
The US Dollar Index (DXY) is retreating after peaking, while 10-year yields hover near 4.23% but fail to break higher.
Weakening yields and profit-taking on the dollar strengthen the safe-haven narrative for gold, particularly attractive to Indian investors during times of global volatility.
🌍 Geopolitical Tensions & Capital Flow Rotation
Ongoing concerns in the Middle East, Ukraine, and Indo-Pacific increase gold’s appeal as a hedge.
Institutions have started rotating capital from equities to safe-haven assets. ETF inflows and central bank reserves—particularly from China and India—underline long-term accumulation.
🧠 TECHNICAL ANALYSIS – STRUCTURE & SENTIMENT
On the H1 chart, XAUUSD remains within a broader descending channel but has printed a potential reversal setup from the BUY ZONE (3327–3325).
The recent drop filled a Fair Value Gap (FVG), offering strong confluence support.
Price action shows early signs of accumulation with bullish divergence on RSI and price holding above the trendline support.
Immediate resistance is seen at 3355–3360, with stronger supply anticipated near the SELL ZONE (3398–3400), aligning with a high-timeframe trendline.
🎯 TRADING PLAN – UPDATED FOR SHORT/MEDIUM TERM
🔵 BUY ZONE: 3327 – 3325
SL: 3320
TP: 3330 → 3335 → 3340 → 3345 → 3350 → 3355 → 3360 → ???
This zone aligns with key structural support and the base of FVG. A break above 3360 may trigger acceleration toward 3375–3390.
🔴 SELL ZONE: 3398 – 3400
SL: 3405
TP: 3395 → 3390 → 3386 → 3380 → 3375 → 3370 → 3360
Ideal area to fade potential spikes driven by news or sentiment. Look for rejection wicks or RSI divergence before entering.
⚖️ STRATEGY OUTLOOK
With central banks tilting toward easing, gold may reclaim dominance as a macro hedge. India’s gold imports are expected to increase if prices consolidate below 3350. Patience and discipline around key zones are critical—let price validate direction.

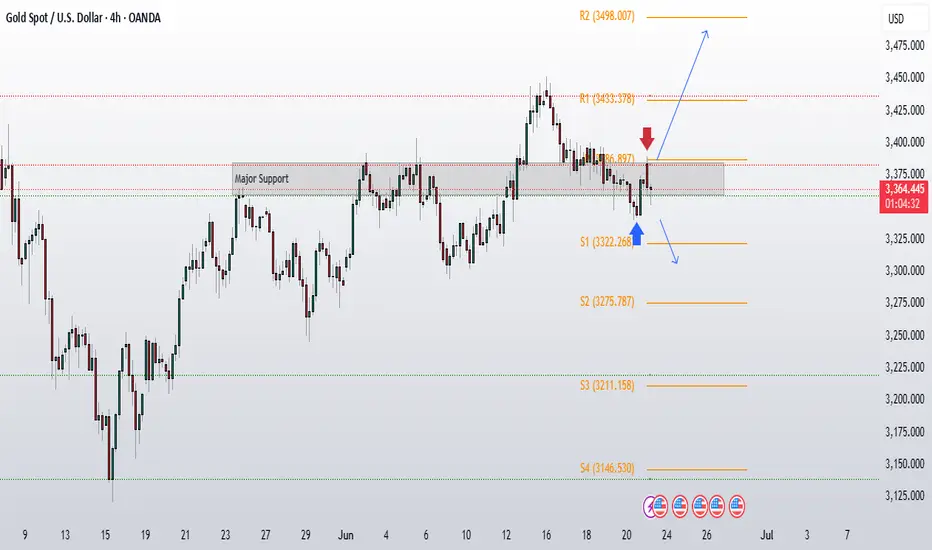
Gold Gap Up But Range Remains IntactThe price is still facing resistance at that key 3385 level we talked about in our weekly analysis video. This 3385 level is our monthly pivot (marked with the red arrow), and it's crucial for the gold bulls to not just break above this level but also sustain above it. Only then can we expect to see some fresh buying momentum kick in.
On the downside, we've a solid support zone around 3350-3360 that's worth keeping an eye on.
We did see a gap-up opening this morning, which is due to the ongoing war situation creating some safe-haven demand for gold. However, from price action perspective, gold is still trading within its range, and we need to wait for breakout from this range .
Until this range breaks definitively one way or the other, . No point in forcing trades when the market is clearly telling us it's still deciding which direction to go.but above 3360 level bulls are still in control (on Daily close).
XAU/USD Bullish Breakout from Flag PatternBullish Flag Formation: The price consolidated in a downward-sloping flag after a sharp bullish move. A breakout has occurred, signaling renewed buying pressure.
Support Zone: The breakout aligns with the horizontal support area around 3,392, reinforcing the bullish bias.
Upside Targets: Based on price structure and measured move projection:
First target: 3,435 – 3,452
Final target zone: 3,500+
Momentum Confirmation: The Ichimoku cloud supports bullish continuation as price trades above it, showing strong upward momentum.
Conclusion:
Gold appears to be resuming its uptrend after a brief consolidation. As long as price holds above the breakout level (around 3,392), the bullish targets remain valid. Ideal scenario for continuation traders looking for entries on minor pullbacks

Gold price returns to 3363 price zone, gold selling pointPlan XAU day: 20 June 2025
Related Information:!!!
Gold price (XAU/USD) is seen consolidating its intraday losses to over a one-week low and is trading just below the $3,350 level during the first half of the European session. Earlier this week, the US Federal Reserve (Fed) trimmed its outlook for rate cuts in 2026 and 2027, which is seen as a tailwind for the US Dollar (USD) and is weighing on demand for the non-yielding yellow metal.
In addition, a generally positive tone in European equity markets is another factor putting pressure on Gold prices. However, rising geopolitical tensions in the Middle East may cap market optimism amid ongoing trade-related uncertainties and help limit losses for the safe-haven XAU/USD, which remains on track for weekly losses
personal opinion:!!!
Gold price in sell zone, trend line 3362
Important price zone to consider : !!!
SELL point: 3362 zone
Sustainable trading to beat the market
