GOLD SPOT (XAU/USD) 1H ANALYSIS – BULLISH STRUCTURE HOLDING STRO📈 GOLD SPOT (XAU/USD) 1H ANALYSIS – BULLISH STRUCTURE HOLDING STRONG! 🚀✨
🔍 Overview:
Gold is currently trading within a well-defined ascending channel 📊, showing clear bullish intent. Price action has respected the lower channel support, bouncing strongly from a key demand zone highlighted in blue.
🟦 Support Zone:
The price is consolidating just above the $3,385–$3,390 support zone 🛡️, which has acted as a springboard multiple times in the past. This area aligns perfectly with the lower trendline, increasing its reliability.
📍 Key Price Targets:
🎯 $3,402 – First breakout confirmation and minor resistance.
🎯 $3,422 – Mid-level target, possible resistance.
🎯 $3,452 – High-probability target if bullish momentum continues.
🎯 $3,460+ – Extended target aligning with the channel top.
📈 Technical Structure:
Price is respecting higher lows and higher highs, maintaining bullish momentum.
A breakout above $3,402 could trigger the next leg up.
Market is forming a bullish flag/pennant consolidation—potential breakout pending ⏳.
⚠️ Risk Zone:
A break below the demand zone and the channel could invalidate the bullish setup ❌. Close monitoring of lower structure is essential.
✅ Conclusion:
As long as price holds above the key support zone and within the ascending channel, bullish continuation remains the favored scenario. A breakout above interim resistance levels could send Gold toward $3,450+! 🌟📊
🔔 Watch for bullish confirmation candles or volume spikes before entry!
📅 Chart published: June 18, 2025 | XAU/USD | 1H timeframe
🧠 Strategy: Bullish breakout play 📈
💡 Sentiment: Moderately Bullish ♻️
Metals

Gold Consolidates Ahead of Fed: Buy Signal or Bull Trap?🟡 XAUUSD 18/06 – Gold Consolidates Ahead of Fed: Buy Signal or Bull Trap?
🌐 MACRO & SENTIMENT OVERVIEW
The US Dollar Index (DXY) gained 0.7% to start the week, as markets anticipate the Fed may keep rates higher for longer due to rising oil prices and global geopolitical uncertainty.
However, with the upcoming FOMC meeting and US retail sales data, there is a strong potential for a shift in tone if growth shows signs of weakness.
Geopolitical tensions – particularly in the Middle East (Israel–Iran conflict) – continue to support gold’s defensive appeal, even as short-term profit-taking creates volatility.
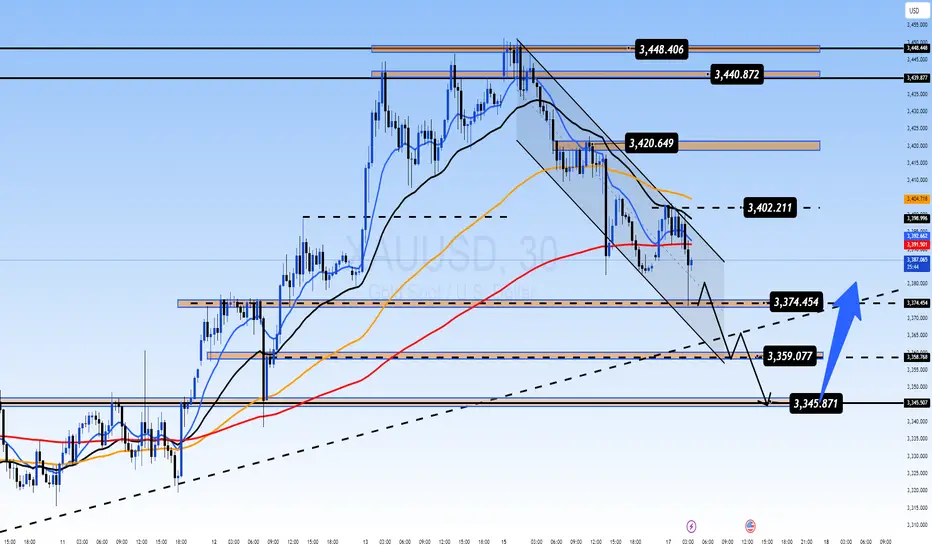
📊 TECHNICAL OUTLOOK – M30 Chart
Gold is currently trading inside a descending channel, but price structure remains above EMA 13–34–89, keeping the potential for a bullish reversal alive.
Liquidity has been absorbed multiple times near 3,345, aligning with dynamic support from trendline and horizontal structure → a key decision zone for bulls.
On the upside, resistance between 3,440 – 3,445 remains a critical distribution zone, likely to trigger sell reactions if price fails to break convincingly.
🎯 TRADE SETUPS
🔵 BUY ZONE: 3345 – 3343
SL: 3339
TP: 3350 – 3354 – 3358 – 3362 – 3366 – 3370 – 3380 – 3400 – ???
📌 This zone overlaps with trendline and recent demand areas. Watch for bullish price action confirmation (e.g., engulfing, pin bar) before entering. If confirmed, we expect a strong bounce targeting the upper channel and beyond.
🔴 SELL ZONE: 3442 – 3444
SL: 3448
TP: 3438 – 3434 – 3430 – 3425 – 3420 – 3410 – 3400
📌 This is a strong supply area that has rejected price multiple times. Look for reversal signals like bearish divergence or rejection wicks to consider short entries.
✅ SUMMARY
Gold is caught in a critical reaccumulation zone ahead of the FOMC statement. Patience is key: allow the market to react at liquidity zones and follow price behavior instead of chasing moves.
Stick to your zones – protect your capital – and let the setups come to you.

GOLD AT CRITICAL SUPPORT: FOMC Minutes Could Trigger Next moveCurrent Market Situation:
Gold opened with a significant gap up on Monday but failed to claim above the 3450 level. Since then, the price has been in pullback mode and is now sitting at a critical major support zone.
Key Support Zone:
Upper Level of support zone: 3,385
Lower Levelof support zone: 3,360
This support zone represents a crucial decision point for gold next directional move.
Today's Catalyst:
The FOMC minutes release today will likely be the key driver that determines gold's next move. This fundamental event could provide the momentum needed to break the current consolidation.
Two Potential Scenarios:
Bullish Scenario:
If gold successfully holds above the support zone (particularly above 3,360:lower level of this zone) and manages to reclaim Monday's high around 3,450, we could see a strong buying rally develop that can push price to 3500 or higher levels. This would indicate that the pullback was merely a healthy correction before the next leg higher.
Bearish Scenario:
If gold breaks below the lower support level of 3,360, it would signal further weakness and we could see the price targeting lower levels. This break would invalidate the current support structure and open the door for extended selling.
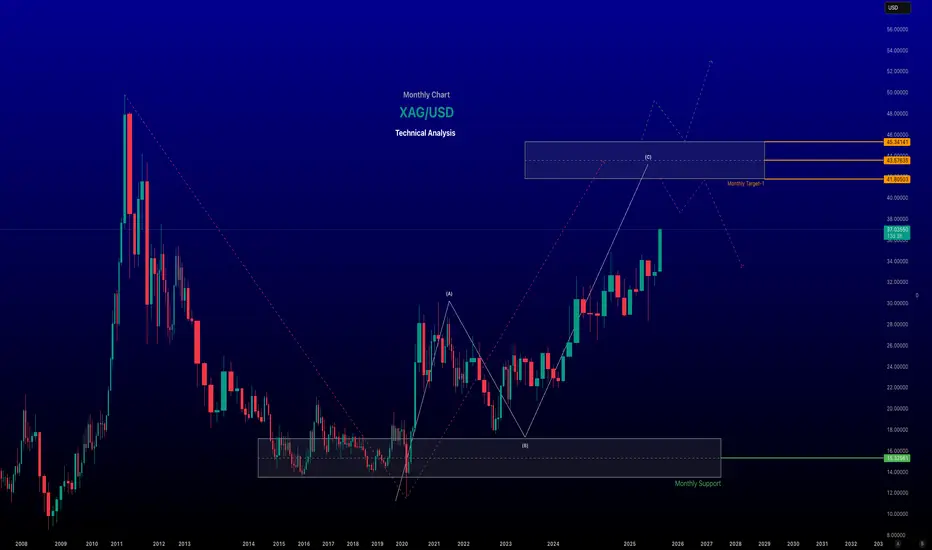
XAG/USD (Silver Spot vs. US Dollar) Analysis - Monthly Chart ~~ XAG/USD (Silver Spot vs. US Dollar) Analysis ~~
#Current Price and Recent Performance
As of June 18, 2025, the XAG/USD spot price is approximately $37.00 per troy ounce at the time of posting, reflecting a 13-year high. Silver has surged nearly 30% year-to-date in 2025, driven by heightened safe-haven demand amid geopolitical tensions, particularly in the Middle East, and global economic uncertainties. Over the past month, silver prices have risen by 12.43%, and year-over-year, they are up 23.33%.
-- Key Drivers of Recent Trends
Geopolitical Tensions: Escalating conflicts, such as Israel’s military actions in Iran, have boosted demand for safe-haven assets like silver and gold. This has been a significant catalyst for silver’s rally, with prices climbing in tandem with gold.
US Dollar Weakness: A softer US dollar, influenced by expectations of Federal Reserve rate cuts and softer inflation data, has supported higher silver prices. Since silver is priced in USD, a weaker dollar makes it more affordable for foreign investors, increasing demand.
Industrial Demand: Silver’s dual role as a precious and industrial metal (used in electronics, solar panels, and medical devices) accounts for ~56% of its demand. Growing industrial applications, particularly in green technologies, continue to support price growth.
Supply Constraints: A persistent supply deficit of 150–200 million ounces annually (10–20% of total supply) and declining above-ground inventories by nearly 500 million ounces in recent years have tightened the market, pushing prices higher.
Speculative Activity: Futures and spot market trading on exchanges like COMEX and the London Bullion Market, coupled with speculative interest, contribute to price volatility. The market is also influenced by “paper silver” (futures, ETFs), which some argue suppresses physical silver prices.
~~Technical Analysis~~
Current Levels and Trends: Silver is trading above the key support zone of $34.90–$35.15, maintaining a bullish outlook. Recent suggest a strong bullish trend, with a breakout above a downward trend line and minor resistance on the 4-hour chart.
Support and Resistance:
Support: Key levels include $34.99, $33.70, $32.67, and the 0.618 Fibonacci retracement at ~$35.00.
Resistance: Immediate resistance lies at $37.85, with further targets at $38.00 and potentially $40.34–$44.21 in the coming weeks or months.
-- Disclaimer --
This analysis is based on recent technical data and market sentiment from web sources. It is for informational purposes only and not financial advice. Trading involves high risks, and past performance does not guarantee future results. Always conduct your own research or consult a SEBI-registered advisor before trading.
#Boost and comment will be highly appreciated
Gold Consolidating at Key Support: Is the Next Move a Reversal?XAUUSD 17 June – Gold Consolidating at Key Support: Is the Next Move a Reversal?
After a strong rally to 3,448 – the highest level in 8 weeks – gold faced profit booking and pulled back sharply towards 3,385. However, price is now sitting at a critical confluence of technical zones, and smart money may be preparing for the next strategic leg. Let’s decode the structure...
🌐 Macro & Market Sentiment
Geopolitical heat remains: Israel–Iran tension is far from cooling. Trump's statements about evacuating Tehran and pushing for a new nuclear deal are fueling safe-haven demand.
Fed policy meeting + US Retail Sales ahead: These upcoming events will shape inflation expectations and rate path clarity. Traders are cautious but alert.
Capital rotation: Large funds may be temporarily exiting gold and shifting into oil and stocks—triggering short-term volatility, not trend reversals.
📊 Technical Breakdown (M30-H1 Confluence)
Trend channel: Gold is currently trading within a descending short-term channel after failing to hold above the 3,440–3,448 supply zone.
EMA alignment (13-34-89-200): Squeezing closer, indicating momentum exhaustion and possible bullish crossover if support holds.
Fair Value Gap (FVG) + historical support + ascending trendline align near 3,345 → strong liquidity pocket forming here.
🎯 Trade Setups for Today
✅ BUY Setup (Liquidity Rebound)
BUY ZONE: 3,344 – 3,342
SL: 3,338
Targets:
→ 3,348 → 3,352 → 3,356 → 3,360
→ 3,364 → 3,368 → 3,372 → 3,380+
🧠 Ideal entry if price forms bullish rejection candle in this zone, especially during London open. Look for long-tail or inside bar confirmation.
⚠️ SELL Setup (Scalp-Only if Rejected)
SELL ZONE: 3,440 – 3,442
SL: 3,446
Targets:
→ 3,436 → 3,432 → 3,428 → 3,424
→ 3,420 → 3,415 → 3,410
📌 Only short if there's strong rejection from this supply zone. No blind entry—wait for clear bearish momentum or reversal wick with high volume.
🧭 Market Psychology
Retail traders were trapped on the breakout—smart money likely unloading at highs.
Price is now retracing to gather liquidity. If the 3,344 zone holds, we could see a powerful impulsive recovery.
Don’t trade the noise — trade the zones. Volume behavior around these levels will reveal market intention.
📌 Final Thoughts
This is a classic case of controlled retracement after a breakout. If gold finds support at the BUY ZONE, the next bullish wave could target 3,400+ again. But if the 3,345 area fails, deeper correction toward 3,320 is possible.
🧘♂️ Stay patient. Let price come to you.
✅ Follow structure, respect SL, and trade with clarity.
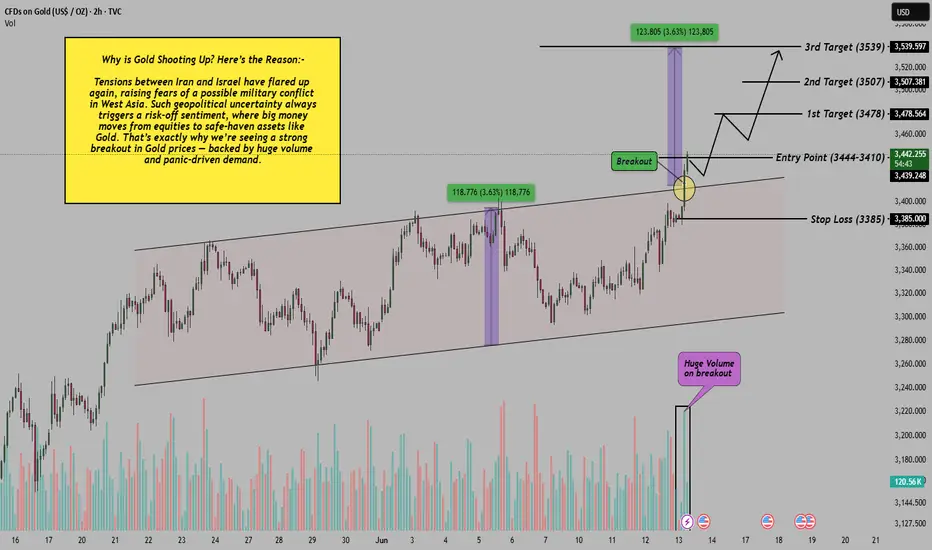
War Fear Driving Gold: Iran-Israel Conflict Fuels Breakout!Hello Evevryone, let's discuss about Gold today as it has officially broken out of its parallel (Neutral bullish) channel with a powerful candle backed by massive volume surge , confirming strong buying interest — likely driven by safe-haven demand amid the rising Iran-Israel conflict. The breakout above 3444–3410 zone indicates a potential trend continuation setup where price may now retest the breakout area before pushing higher.
This move isn’t just technical — it’s fundamentally supported by fear in global markets. Whenever war fears rise, investors rush towards Gold to hedge their capital. That’s exactly what this spike reflects.
If you liked this post, don’t forget to LIKE and FOLLOW!
I regularly share high-quality trading setups based on real analysis, OI data, and smart risk-managed strategies.
Disclaimer: This analysis is for educational purposes only. Please consult a financial advisor before making investment decisions.
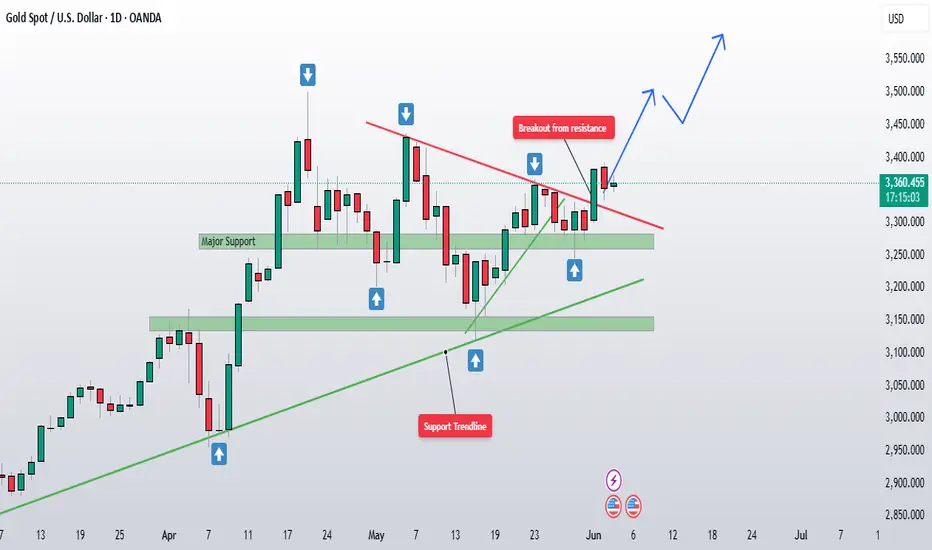
XAU/USD Bullish Continuation SetupThe chart illustrates a bullish market structure for XAU/USD, with price action currently trending upwards. Key technical observations:
Support Zone:
Price has recently bounced from a support zone around 3,399.710, indicating strong buying interest.
Bullish Projection:
A bullish continuation is expected. The chart outlines a potential scenario with a minor retracement towards 3,432.835 or 3,399.710, followed by a strong upward move.
Targets:
Immediate resistance is around 3,502.669.
If broken, price may aim for 3,550.351.
Final projected target lies near 3,680.000, which aligns with a historical supply zone.
Indicators:
The green enveloping bands suggest increasing volatility, with the price respecting the upper band, supporting bullish momentum.
Conclusion:
XAU/USD appears poised for a bullish breakout continuation. A potential pullback could offer a buy opportunity, targeting higher resistance zones as long as the structure remains intact.

Gold Drops After Asian FOMO: Bull Trap or Liquidity Grab?🟡 XAUUSD 16/06 – Gold Drops After Asian FOMO: Bull Trap or Liquidity Grab?
After a strong bullish rally in the Asian session driven by fear-based headlines and war news, gold (XAUUSD) suddenly reversed sharply — confusing many retail traders who jumped in late. But when we look deeper into price behavior and volume, the story becomes clearer...
📌 Key Fundamental Insights
🔸 Geopolitical headlines (war tensions, assassination attempts) triggered a FOMO rally in gold early in Asia.
🔸 However, the lack of follow-through volume suggests this may have been a bull trap—a smart money strategy to unload positions into emotional buying.
🔸 Big funds could be reallocating capital temporarily from gold into:
🔹 Stocks (tech & value sectors are correcting attractively)
🔹 Oil (Middle East tension = higher oil price = strong institutional interest)
🔍 Technical Outlook (M30 Chart)
The technical structure shows a textbook liquidity play:
🔻 Price spiked into resistance at 3456, then reversed
🧊 EMAs (13/34/89/200) are flattening → signs of potential bearish crossover on M15–M30
📉 Volume has been declining → confirms exhaustion of the FOMO move
📦 A large Fair Value Gap (FVG) sits below current price, acting as a magnet for liquidity
🎯 Strategy Setup
Scenario 1: BUY from FVG (Liquidity Reclaim)
Entry: 3383 – 3385
SL: 3377
TPs: 3386 → 3390 → 3394 → 3398 → 3402 → 3406 → 3410+
Structure favors a bounce from this zone if confirmed by price action during London or NY sessions.
Scenario 2: SELL if price re-tests 3456–3458
Entry: Only on clear rejection
SL: 3462
TPs: 3452 → 3448 → 3444 → 3440 → 3435 → 3430
⚠️ Avoid shorting blindly — only trade confirmed rejections with strong candle setups.
Market Psychology Right Now
Big players may be unloading gold to rotate into oil and equities
Asian FOMO = retail got trapped
Volume profile shows imbalance: market likely seeking liquidity lower before moving higher again
📝 Final Thoughts
Gold is in a volatile reaccumulation zone. Rather than chasing price, it’s better to let the market come to your planned zones. The 3383–3385 zone will be critical. If it holds, we may see a solid bounce into next week.
Discipline beats emotion. Respect your SL and stick to the zone logic.
📌 Follow for intraday updates. Will post re-entry plan during London session if price reacts early.

Gold Surges Amid Middle East TensionsXAUUSD – Gold Surges Amid Middle East Tensions | What’s Next After 3430 Break?
🌍 Macro & Geopolitical Overview
Gold prices accelerated sharply in the Asian session on June 13 after Israel launched a large-scale airstrike campaign against Iran, targeting nuclear facilities including the Natanz uranium enrichment site.
Israeli Prime Minister Netanyahu declared the mission would continue until the Iranian nuclear threat is “completely neutralized.”
Iran suffered major losses and scrambled its air force to prepare for retaliation.
WTI oil jumped over 8%, gold spiked to $3,430/oz, and US equities dropped sharply.
While the US claimed it would not participate directly in the attack, it vowed to defend its forces in the region if threatened.
This rapidly escalating geopolitical conflict has triggered a renewed flight into safe-haven assets, with gold leading the pack.
📉 Technical Outlook – M30 / H1 Chart
🔹 Trend Structure
Gold has broken out decisively above 3,392, forming a strong bullish leg and carving new short-term support around 3,412 – 3,426.
Price action is forming a Higher High – Higher Low structure within a rising channel.
🔹 Fair Value Gap (FVG)
A visible FVG between 3,405 – 3,412 has formed. As long as price holds above this zone, bullish continuation is favored.
🔹 EMA Structure
Price is well above all key EMAs (13, 34, 89, 200), confirming a strong bullish environment. EMA13 continues to guide intraday momentum.
🔹 Key Resistance Zone
Watch for potential distribution or profit-taking around 3,441 – 3,456 – a major resistance area if no further escalation occurs.
🧠 Market Sentiment & Behavior
Investor sentiment has shifted firmly into risk-off mode.
Funds are flowing heavily into gold, oil, CHF, and JPY.
Price volatility is likely to spike further, as headlines continue to drive intraday sentiment.
🎯 Updated Trade Setup – 13 June
🔵 BUY ZONE: 3384 – 3382
Stop-Loss: 3378
Take-Profit: 3388 → 3392 → 3396 → 3400 → 3405 → 3410
🔴 SELL ZONE: 3454 – 3456
Stop-Loss: 3460
Take-Profit: 3450 → 3446 → 3442 → 3438 → 3434 → 3430
✅ Conclusion
The renewed conflict between Israel and Iran is fueling gold’s rise as global risk appetite collapses. Technically, the trend remains bullish, but volatility is extremely elevated. Traders should watch key price zones closely and avoid emotional trades during event-driven spikes.
⚠️ Trade the reaction, not the prediction. Let key levels confirm bias before entering.

XAUUSD – CPI Data Pushes Gold HigherXAUUSD – CPI Data Pushes Gold Higher | Should You Follow the Trend or Sell the Top?
Gold prices surged strongly after the US CPI report came in lower than expected. This triggered a sharp drop in the US Dollar and yields, while boosting demand for safe-haven assets. The question now: Is this the beginning of a new leg higher, or a setup for a short-term correction?
🌐 MACRO & MARKET SENTIMENT
📰 US CPI (May): Increased only 0.1% MoM and 2.4% YoY vs. forecast of 2.5%.
➤ This softer inflation reading reignited expectations that the Fed may cut rates as early as September.
📉 USD Weakness: The Dollar Index (DXY) dropped ~0.4%, making gold cheaper and more attractive for global investors.
📉 Bond Yields Falling: US 10Y yields declined, further increasing the appeal of gold as a non-yielding safe asset.
💡 Market Psychology: Traders are rotating capital back into gold ahead of FOMC and geopolitical uncertainties (China, Middle East).
📈 TECHNICAL OUTLOOK – H1 & H4 STRUCTURE
🔹 Trend Structure
Gold remains in a Higher High – Higher Low formation since the 3,312 level. Price recently broke above the 3,360–3,374 resistance and is now consolidating around 3,375 — a possible accumulation before breakout.
🔹 Price Channel
Gold is respecting an ascending channel with the lower bound aligning with the key support area at 3,339 – 3,345. As long as this zone holds, bulls are in control.
🔹 EMA Indicators
EMA13 / EMA34: Price is comfortably above both — indicating strong short-term momentum.
EMA89 / EMA200: Both EMAs are well below price action, confirming a medium-term bullish trend.
🔹 Caution Zone
Resistance at 3,392 – 3,395 is a key area to watch for reversal patterns (Pin Bars, Bearish Engulfing, etc.)
If price pulls back to 3,339 – 3,345 and holds, it can offer high-probability long entries with trend continuation.
🎯 TRADE SETUPS
🔵 BUY ZONE: 3324 – 3322
Stop-Loss: 3318
Take-Profit Targets: 3330, 3334, 3338, 3342, 3346, 3350
🔵 BUY SCALP: 3337 – 3335
Stop-Loss: 3330
Take-Profit Targets: 3341, 3345, 3350, 3354, 3360, 3370, 3380
🔴 SELL ZONE: 3392 – 3394
Stop-Loss: 3398
Take-Profit Targets: 3388, 3384, 3380, 3375, 3370, 3360, 3350
🧠 CONCLUSION
The lower-than-expected CPI has given gold a short-term macro boost, and technically, bulls remain in control. However, caution is needed near the 3,392 zone — where price could face strong supply and trigger a pullback.
✅ Trade with confirmation, not assumptions. Let the price action guide your next move.

GOLD IN SIDEWAY PHASE, WAITING FOR A BREAKOUT THROUGH KEY LEVELSXAU/USD TRADING PLAN 10/06/2025 – GOLD IN SIDEWAY PHASE, WAITING FOR A BREAKOUT THROUGH KEY LEVELS!
🌍 MACRO CONTEXT – FUNDAMENTAL ANALYSIS
Geopolitical tensions and monetary policy: The market is currently in a wait-and-see phase, with major decisions pending from important meetings, especially statements from the Federal Reserve (Fed) and global conflict situations. These factors could have a significant impact on market sentiment and volatility in gold.
Weak economic data from major economies such as the U.S. and the Eurozone indicates challenging economic conditions, leading investors to view gold as a safe-haven asset.
Interest rates: Although the Fed continues its rate hike policy, financial market uncertainties could continue to support gold as a preferred asset class.
📉 TECHNICAL ANALYSIS
On the M30–H1 timeframe, XAU/USD is currently moving within a rising channel. After the correction in Wave 4, gold has bounced back in the 335x region and is now preparing to confirm the next trend. Signals from EMA indicate accumulation, potentially setting up for a strong rally ahead.
Key resistance levels: 3,338 – 3,345 (unexplored FVG region). If gold breaks above 3,345, a continued rise to 3,353 is highly likely.
Key support levels: 3,282 – 3,275. If gold retests these levels without breaking them, the chances of a rebound are strong.
🎯 TRADE SETUPS FOR TODAY
🔵 BUY ZONE:
Entry: 3,302 - 3,304
SL: 3,296
TP: 3,306 → 3,310 → 3,314 → 3,318 → 3,325
🔴 SELL ZONE:
Entry: 3352 - 3354
SL: 3,358
TP: 3,348 → 3,344 → 3,340 → 3,330 → 3,320
⚠️ NOTE:
Risk management: Expect significant volatility as the market awaits important news this week.
Wait for confirmation: Technical signals are for guidance; clear confirmation from the charts is needed before entering trades.
📌 CONCLUSION:
Gold is currently in a sideway phase and may be preparing for a breakout if these key support and resistance levels are breached.
Traders should monitor both macroeconomic factors and strategic price zones to make informed trading decisions.

Gold ,Momentum on MuteGold continues to trade within a well-defined range, showing no clear breakout or breakdown. Price remains trapped between the narrow range . Despite brief upward attempts, bearish pressure near the red trendline has kept the market capped this suggesting indecision as neither bulls nor bears have seized control. Unless we see a decisive break above 3330-40 area (previous support now resistance) red descending trendline or below the support region, price is likely to remain sideways and choppy in the short term.
This remains a non-trading zone for directional traders. Better opportunities may emerge after a volatility expansion outside this range.

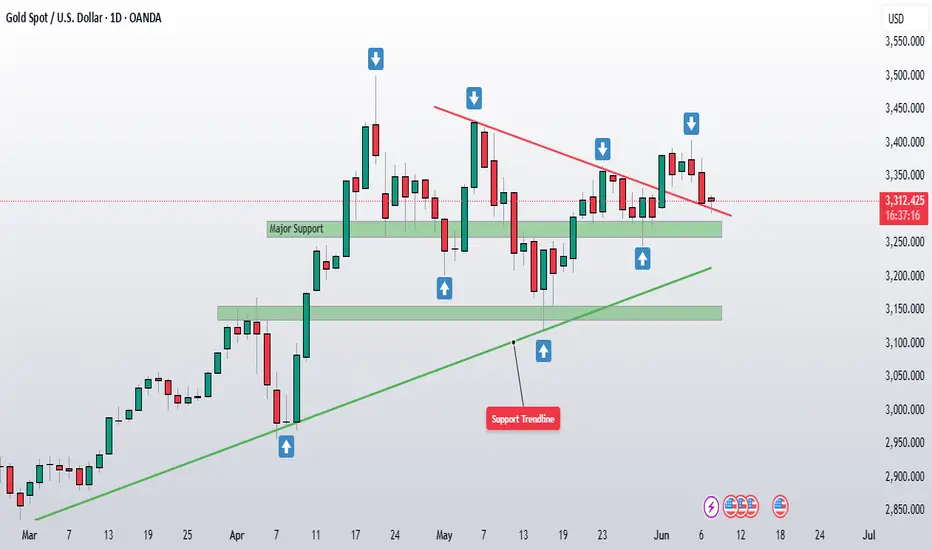
Potential Breakdown with Retest or Reversal Zone This chart represents a classic Double Top pattern, a bearish reversal signal indicating strong resistance around the 3,380 - 3,390 USD zone (marked with two white circles).
🔍 Key Zones and Levels:
1. Resistance Zone (~3,380 - 3,390 USD):
Price was rejected twice here.
Suggests strong selling pressure and buyer exhaustion.
2. Mid Support/Retest Zone (~3,337.857 USD):
Marked with a horizontal white line.
Could act as a short-term resistance if price retraces.
3. Demand Zone (~3,330 - 3,337 USD):
Highlighted green box: potential reversal/retest zone.
Bullish scenario: price bounces from here and heads back to retest resistance.
4. Current Price (~3,309.980 USD):
Price has broken below the demand zone and is approaching strong horizontal support.
5. Lower Support (~3,265 - 3,270 USD):
Highlighted with blue horizontal lines and purple arrows.
Could be the next bearish target if breakdown is confirmed.
🔄 Two Possible Scenarios:
📉 Bearish Continuation:
Price retests the broken demand zone (now resistance).
Rejects and forms a lower high.
Falls toward the lower support around 3,265–3,270 USD.
📈 Bullish Reversal:
Price reclaims the green demand zone.
Pushes above 3,337.857 USD level.
Heads back to retest the double top area (~3,380
✅ Conclusion:
The bias is currently bearish, supported by:
Double top formation.
Breakdown below key demand zone.
Momentum favoring further downside
However, a bullish reversal is possible if price reclaims the 3,337 USD zone and shows strong bullish structure.

Waiting for the Breakout: Consolidation or Trend Continuation?XAUUSD – Waiting for the Breakout: Consolidation or Trend Continuation?
Gold (XAUUSD) is trading within a narrowing range, building momentum after rebounding from the 3.276 support area. Despite short-term uncertainties, the overall macroeconomic landscape continues to favor bullish scenarios — though key resistance levels must be cleared to confirm continuation.
🌍 MACRO & MARKET SENTIMENT
USD Weakness: The DXY continues to trade under pressure, increasing the appeal of non-yielding assets like gold.
US–China Trade Talks: Ongoing high-level negotiations in London could either ease geopolitical tensions or fuel safe-haven demand, depending on outcomes.
Global Risk Appetite: With US debt ceiling concerns still looming and the Fed showing hesitancy to cut rates soon, gold remains in focus as a hedge.
📈 TECHNICAL OUTLOOK (30M–H1)
The price has formed a descending wedge structure and is hovering near key EMAs (13–34–89–200).
A breakout above 3,334 could trigger a short-term bullish wave, while failure at this zone would likely lead to deeper correction toward 3,276 or lower.
📍 STRATEGIC KEY LEVELS
Resistance: 3,334 – 3,336 – 3,362 – 3,390
Support: 3,300 – 3,276 – 3,250
🧭 TRADING SCENARIOS
🔵 BUY ZONE: 3,276 – 3,274
SL: 3,270
TP: 3,280 → 3,284 → 3,288 → 3,292 → 3,296 → 3,300
🔻 SELL SCALP: 3,334 – 3,336
SL: 3,340
TP: 3,330 → 3,326 → 3,322 → 3,318 → 3,314 → 3,310
🔻 SELL ZONE: 3,362 – 3,364
SL: 3,368
TP: 3,358 → 3,354 → 3,350 → 3,346 → 3,340 → 3,335 → 3,330 → 3,320
✅ SUMMARY
Gold remains in a critical range, and traders should focus on well-defined zones to capitalize on volatility. Use confirmation-based entries and respect risk parameters — especially as macro headlines and technical patterns align for a potential breakout.

Sideways Gold, Stronger Dollar: A Pause Before the BreakGold attempted a bullish breakout recently but failed to sustain momentum and is now back within a consolidation zone between 3,250–3,350. The repeated failure to break above descending trendline resistance suggests weakening buyer strength. It is currently forming lower highs, indicating distribution or sideways movement rather than a clear rally.
On the other hand, DXY has bounced from a key demand zone near 99.00, showing signs of short-term strength. It is now targeting the 102.60–104. resistance zone, which aligns with a Fibonacci retracement. If DXY continues higher, it could put pressure on gold prices in the near term.
Given this context, it is wise to remain on the sidelines for the next 2–3 weeks and wait for one of two scenarios:
1. DXY rejection from the 102.60–104 area – This would support a bullish case for gold.
2. Gold breakout above 3,400 with strong volume or need another bounce from lower support area as marked on chart which can provide confirmation of bullish continuation.
Until then, gold is likely to stay in a range or face minor downside due to DXY strength.
NFP STORM BREWING: WILL GOLD BREAK HIGHER OR DIVE LOWER?XAUUSD – NFP STORM BREWING: WILL GOLD BREAK HIGHER OR DIVE LOWER?
Gold enters a highly sensitive phase ahead of tonight’s Non-Farm Payrolls (NFP) release – one of the most influential data points for global financial markets. With US-China trade tensions rekindling and sovereign debt concerns mounting in the US, the yellow metal could experience a major breakout or a sharp reversal during the New York session.
🌍 MACRO & FUNDAMENTAL OUTLOOK
US-China trade talks have resurfaced, with concerns around tariffs and strategic metals dominating headlines. China's recent stance signals it may take stronger defensive actions.
The US national debt is projected to hit $55 trillion by 2034, prompting global central banks to ramp up gold purchases as a strategic hedge.
Fed Chair Powell reiterated a “no rush to cut” stance, yet political pressure is mounting – especially with Donald Trump urging immediate rate cuts following the weakest ADP job growth in two years.
Unemployment Claims released today came in slightly better than expected (236K vs. 240K), adding fuel to speculations around a softer NFP print – potentially bullish for gold.
🔍 TECHNICAL ANALYSIS (H1 – EMA 13/34/89/200)
The chart shows a clean impulsive wave structure. After hitting the resistance zone at 3408–3410, gold entered a consolidation range.
Price is currently hovering around EMA 89–200, suggesting trend divergence and uncertainty ahead of NFP.
A breakdown below the 3344–3332 support zone could push price down to the FVG (Fair Value Gap) at 3320, which may act as a strong liquidity pool for buyers.
⚠️ KEY LEVELS TO WATCH
Resistance: 3380 – 3392 – 3408 – 3436
Support: 3365 – 3350 – 3344 – 3332 – 3320
🧭 TRADE SETUPS
🔻 SELL ZONE: 3408 – 3410
Stop Loss: 3415
Take Profit: 3404 → 3400 → 3395 → 3390 → 3380 → 3370 → 3360 → 3350
🔵 BUY ZONE: 3318 – 3316
Stop Loss: 3310
Take Profit: 3322 → 3326 → 3330 → 3335 → 3340 → 3350 → 3360 → ???
✅ CONCLUSION
Gold is poised for a volatile breakout with NFP acting as the key catalyst. A soft jobs report may trigger a breakout above 3410, while stronger-than-expected numbers could fuel a bearish reversal. In this sensitive phase, traders should stick to defined zones and wait for confirmed liquidity reactions rather than chasing price impulsively.

Analysis on Silver : XAGUSDSilver run halts at immediate resistance $36.12698
On breakout, upside targets are T1, T2 and T3 as mentioned respectively.
If price rejects this and falls below the Immediate support, then the 2024 year's high level will be a strong support to invalidate bullish sentiment.
Below S2, it will still be a weak bullish zone instead of a reversal or bearish knock.
IMO, a pullback is quite possible before hitting the upper targets. A valid close is important above the immediate resistance level.
There is a slight negative divergence in RSI to support the pullback.

Silver also looking good from HereThis is the only time frame where I am watching silver as on now (On Monthly )
Chart is self explanatory, All we need a break above 35 , closing above this level can start a much awaited bull run on silver from here.
and if we see good momentum from silver , gold also goig to follow the same in short term to mid term basis.

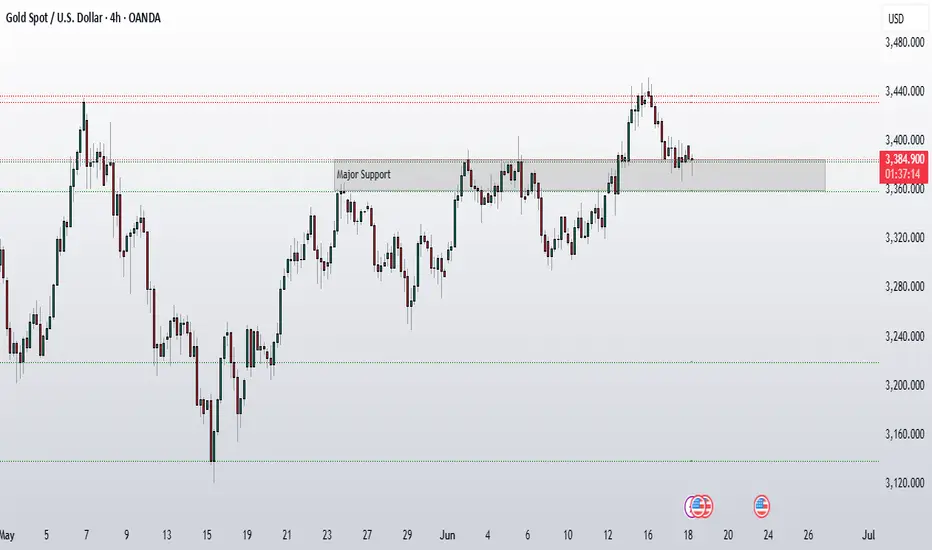
Gold : Looking good so far ...No Change to chart
Support Levels that we have to watch:
Immediate Support : 3345-50(PDL and 50)
Secondary Support : 3330-35
Major Support : 3280-90
Immediate resistance : Current Week High(3390-92)
secondary Resistance : 3440-45
Major Resistance : ATH (3500)

Gold Stalls Ahead of Key Trade TalksGold Stalls Ahead of Key Trade Talks – Will Price Explode Out of the 3345–3370 Range?
After Monday’s explosive rally, gold is currently consolidating within a tight price range. The market is at a critical juncture, awaiting high-level trade talks between the U.S. and China — an event that could serve as a major catalyst for the next directional move.
🌍 MACRO OUTLOOK & MARKET SENTIMENT
A major trade call between Trump and President Xi Jinping is on the horizon. This conversation could reset global trade expectations and potentially trigger large moves in risk assets.
Last week’s strong U.S. jobs data (NFP) pushed back expectations of Fed rate cuts. Treasury yields remain elevated, which is temporarily capping gold’s upside.
Market sentiment is neutral-to-cautious, with traders waiting for confirmation of a breakout or breakdown before committing capital to new positions.
📈 TECHNICAL ANALYSIS (H1 – EMA 13/34/89/200)
Gold appears to be in a wave 4 correction, consolidating after completing wave 3.
EMAs remain aligned to the upside (bullish), suggesting the broader trend still favors buyers.
Key range:
Above 3370 → breakout confirmation → momentum push toward 3400–3410
Below 3345 → breakdown → fast dip to 3310–3300 to complete wave 4 and initiate wave 5 upward
🧭 STRATEGIC ZONES
🔵 BUY ZONE: 3317 – 3315
Stop Loss: 3310
Take Profits:
3322 → 3326 → 3330 → 3334 → 3338 → 3345 → 3350 → 3360
This zone aligns with a strong FVG + EMA89 support. A bullish reaction here could provide a high-probability entry for the next impulsive leg upward (wave 5).
🔻 SELL ZONE: 3372 – 3374
Stop Loss: 3378
Take Profits:
3368 → 3364 → 3360 → 3356 → 3350 → 3345
3370 is a critical resistance zone. Any rejection at this level with weak momentum or divergence could open a short-term bearish correction back toward 331x levels.
✅ SUMMARY
Gold is trapped in a decision zone between 3345–3370. The market awaits clarity from macro headlines and technical breakout signals. Until then, traders should watch key levels closely, stay patient, and position accordingly based on price action confirmation at strategic zones.

Gold Holding Strong Looks Like It’s Building Power AgainPrice appears to be consolidating just above the breakout trendline, forming a new bullish base between 3350–3365 on the daily timeframe. This is a healthy sign ,it indicates that buyers are absorbing supply and not allowing price to fall back into the old range.
As long as this consolidation holds, the setup remains bullish, with upside potential still targeting 3445 and then ATH at 3500. If we get a decisive breakout above ATH, we might see a continuation rally. However, if a double top starts forming there, it will be time to book partial profits and wait for confirmation.
For Invalidation Level: I am Watching the 3380–3390 zone closely (Monday’s low). A strong move below this level could signal a failed breakout and invalidate the current bullish structure.
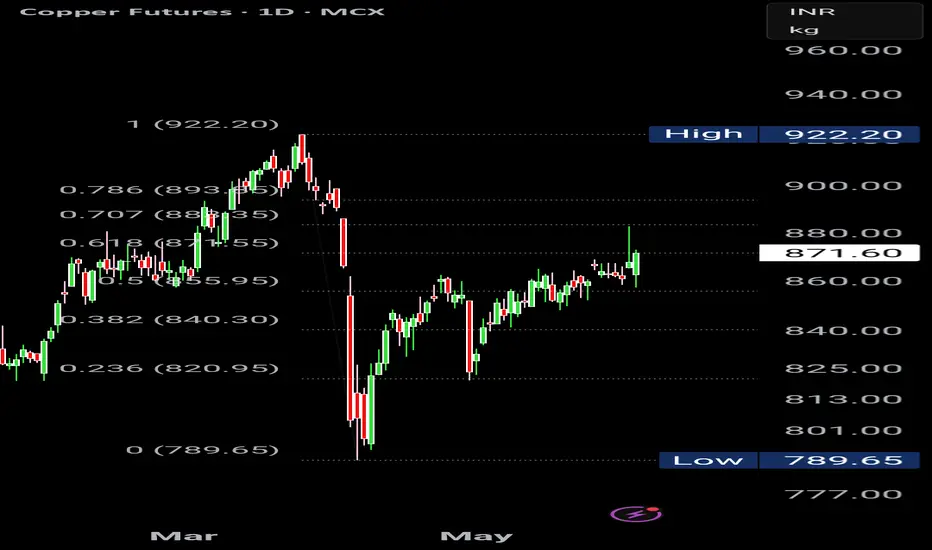
MCX COPPER CLOSES ABOVE 61.8 Fib Level. Today is an important GANN DATE for MCX COPPER. LETS SEE IF IT GOES INTO A BULLISH TRAJECTORY.
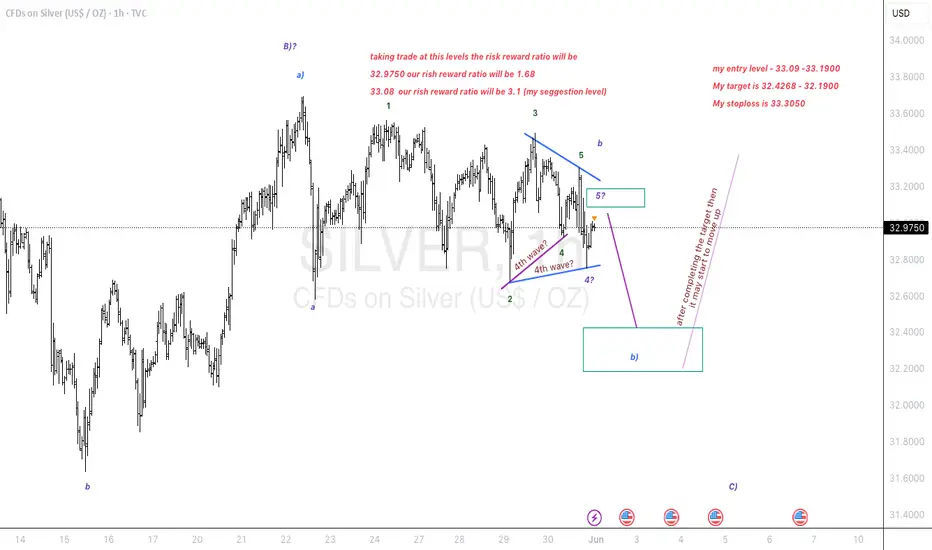
Triangle breakout in silver. Down to earth..
Elliott Wave Analysis:-
1st possibility:- (look Previous chart published)
Silver is in a triangle breakout. if it is getting towards upside breakout then we have a nice opportunity of pullback and and we can add it if the pullback occurs. else we can enjoy this journey quietly.
2nd possibility:-
Silver had already made a pullback towards down side breakout. Once it start the way it will fly towards downside and then it will complete a C wave in whole B wave then upside C wave will be impulsive.
My Entry, Stop, Target all have been discussed.
My suggestion to take a trade at this place to reduce the risk better reward.
I just spoke what chart whisper's in my ear.
I am not a SEBI registered advisor. Before taking a trade do your own analysis or consult a financial advisor. I share chart for education purpose only. I share my trade setup.