Best Commodity layoutBest Commodity layout
Crafting Your Optimal Commodity Technical Chart Layout in TradingView
The "best" commodity technical chart layout in TradingView is highly personalized, depending on your trading style, strategy, and the specific commodities you're analyzing. However, a well-structured layout should provide a clear, comprehensive view of price action and key technical indicators to aid in decision-making.
Here's a guide to creating an effective commodity technical chart layout in TradingView, incorporating common practices and versatile tools:
1. Choosing Your Main Chart Type:
Candlestick Charts: This is the most popular choice for most traders. Candlesticks provide detailed information about the open, high, low, and close (OHLC) prices for a specific period, making it easier to identify patterns and market sentiment.
Bar Charts: Similar to candlesticks, bar charts also display OHLC data but in a different visual format.
Line Charts: Useful for a quick overview of the overall trend, typically plotting the closing prices.
Heikin Ashi: These charts can help filter out market noise and make trends easier to identify by averaging price data.
Renko or Kagi Charts: These focus solely on price movement, ignoring time, and can be useful for identifying support and resistance levels.
Recommendation: Start with Candlestick charts for their detailed information. You can always switch to other types for different analytical perspectives.
2. Essential Technical Indicators for Commodities:
While the "best" set of indicators is subjective, here are some widely used and effective ones for commodity analysis in TradingView:
Moving Averages (MAs):
Types: Simple Moving Average (SMA) and Exponential Moving Average (EMA) are common. EMAs react faster to recent price changes.
Use: Identify trend direction, support/resistance levels, and potential crossover signals. Common periods include 20, 50, 100, and 200.
Layout: Add 2-3 MAs of different lengths directly onto your main price chart. For example, a 21-period EMA for short-term trends and a 50-period EMA for medium-term trends.
Volume Indicators:
Types: Volume (displays trading activity) and On-Balance Volume (OBV).
Use: Confirm the strength of price movements. A significant price move accompanied by high volume is generally considered more valid.
Layout: Typically displayed in a separate pane below the main price chart.
Oscillators (for identifying overbought/oversold conditions and momentum):
Relative Strength Index (RSI): Measures the speed and change of price movements. Values above 70 often indicate overbought conditions, while below 30 suggest oversold conditions. Standard period is 14.
Moving Average Convergence Divergence (MACD): Shows the relationship between two moving averages of an asset's price. It consists of the MACD line, signal line, and histogram.1 Used for trend identification and momentum.
1.
medium.com
medium.com
Stochastic Oscillator: Compares a particular closing price of an asset to a range of its prices over a certain period. Also used to identify overbought/oversold conditions.
Commodity Channel Index (CCI): Identifies cyclical trends and can signal overbought/oversold levels.
Layout: Oscillators are usually placed in separate panes below the main chart. You might choose 1 or 2 that best suit your strategy (e.g., RSI and MACD).
Volatility Indicators:
Bollinger Bands: Consist of a middle band (typically an SMA) and two outer bands representing standard deviations. They help identify volatility and potential price breakouts or mean reversion.
Keltner Channels: Similar to Bollinger Bands but use Average True Range (ATR) for the outer bands. Can be used for breakout and trend-following strategies.
Average True Range (ATR): Measures market volatility. Useful for setting stop-loss orders.
Layout: Bollinger Bands and Keltner Channels are overlaid on the main price chart. ATR is usually in a separate pane.
Trend-Following Indicators:
Ichimoku Cloud (Ichimoku Kinko Hyo): A comprehensive indicator that defines support/resistance, identifies trend direction, and provides trading signals. It includes several components like the Kumo (Cloud), Tenkan-sen, and Kijun-sen.
Donchian Channels: Plots the highest high and lowest low over a set period. Useful for identifying breakouts and trend direction.
Layout: Ichimoku Cloud and Donchian Channels are overlaid on the main price chart.
Recommendation for a Balanced Layout:
Main Chart: Candlesticks, 2-3 EMAs (e.g., 21, 50, 200), Bollinger Bands or Keltner Channels.
Pane 1 (below main): Volume.
Pane 2 (below main): RSI (14) or MACD.
Pane 3 (optional): CCI or ATR if your strategy heavily relies on them.
3. Drawing Tools:
Effective use of drawing tools is crucial for technical analysis:
Trendlines: Connect swing highs or lows to identify the direction and strength of trends.
Support and Resistance Levels: Horizontal lines drawn at key price levels where the price has historically struggled to break above (resistance) or fall below (support).
Fibonacci Retracement and Extension Levels: Help identify potential support/resistance levels and price targets based on Fibonacci ratios.
Channels: Parallel trendlines that can define a price range.
Chart Patterns: Use tools to identify patterns like head and shoulders, triangles, flags, and pennants.
Layout Tip: Keep your most frequently used drawing tools easily accessible in the TradingView drawing panel.
4. Multi-Timeframe Analysis & Multi-Chart Layouts:
Analyzing commodities across different timeframes can provide a broader market perspective. TradingView allows you to set up multi-chart layouts (the number of charts available depends on your subscription plan).
Common Setup:
Chart 1 (Long-Term): Weekly or Daily chart to identify the major trend.
Chart 2 (Medium-Term): 4-hour or Daily chart for more detailed trend analysis and identifying key levels.
Chart 3 (Short-Term): 1-hour or 15-minute chart for entry and exit signals.
Synchronization: TradingView allows you to synchronize symbols, crosshair, interval, and drawings across multiple charts in a layout, which can be very efficient.
5. Customization and Saving Your Layout:
Appearance: Customize chart colors (background, candles, grids), scales, and lines to your preference for better visual clarity and reduced eye strain. Access these via Chart Settings (the gear icon).
Saving Layouts: Once you have a setup you like, save it as a chart layout in TradingView. You can create multiple layouts for different commodities, strategies, or analytical purposes.
Indicator Templates: Save combinations of indicators as templates for quick application to new charts.
Tips for the "Best" Layout:
Keep it Clean: Avoid cluttering your chart with too many indicators. Focus on a few that you understand well and that complement your strategy.
Consistency: Use consistent settings for your indicators across different charts and timeframes.
Practice: The "best" layout is one that works for you. Experiment with different indicators and setups on a demo account or through backtesting to see what yields the best results for your trading style.
Stay Informed: Be aware that some commodities (e.g., agricultural products) can be influenced by seasonal patterns or specific reports (like USDA reports for crops, EIA for oil). While not a direct part of the "chart layout," integrating this knowledge with your technical analysis is crucial. TradingView has features to display key events like earnings reports or dividends, which can be relevant. Some community scripts on TradingView even offer overlays for planting and harvesting seasons for agricultural commodities.
By following these guidelines and experimenting to find what suits your individual needs, you can create a powerful and effective commodity technical chart layout in TradingView. Remember to regularly review and refine your layout as your trading strategies evolve.
Metals
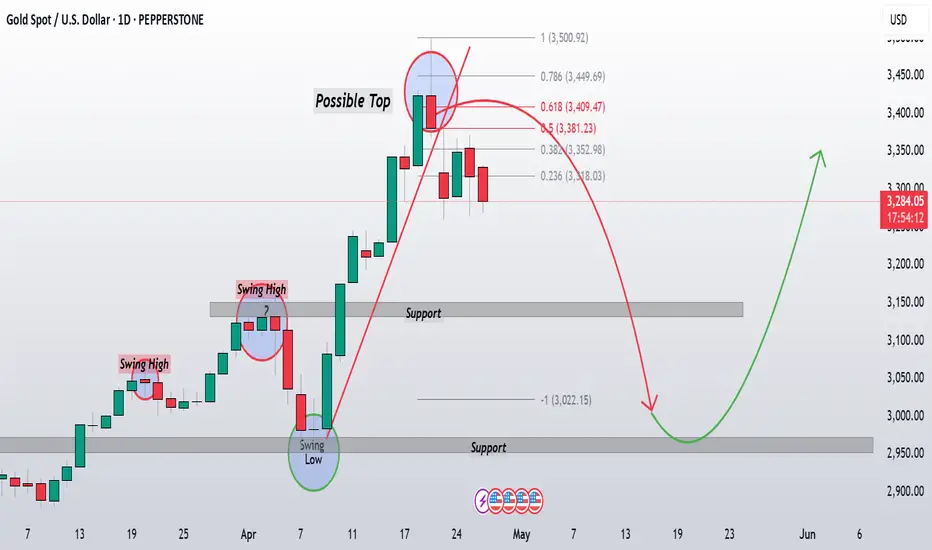
Gold Bounced But Resistance Awaits....Gold has surprised many after last Friday’s session. I was initially expecting the correction to continue, but the reversal Doji that formed near support triggered a strong bounce, invalidating my short-term bearish outlook. Since then, price has shown decent strength on the daily timeframe, pushing higher toward a major resistance zone around 3434–3440.
Now, this horizontal resistance is a key area to watch. It has previously acted as a supply zone, and price action around it will be crucial. Although the structure still looks strong, we’re entering a potential exhaustion zone, and I’m keeping an eye on the possibility of a double top forming near the all-time high at 3500.
Today is a major fundamental day with the Fed’s rate decision and Powell’s speech lined up. I’m expecting volatility, and most likely, a clearer signal for the next big move in gold. My bias remains the same ,I’m waiting for bearish confirmation near this resistance area before entering fresh shorts. If we see rejection, I’ll target the 3200–3215 zone first, and if that breaks, the 3140–3160 zone comes into play next.
In short, I’m staying patient and letting the chart do the talking. Price is approaching a critical area, and the next move could offer a high-probability setup. Waiting for confirmation is key.

Gold Plunges from 3435 After China Rate Cut FOMC Storm Incoming?Gold Plunges from 3435 After China Rate Cut – FOMC Storm Incoming?
📅 May 7, 2025 | XAU/USD Intraday Outlook
Gold faced a sharp decline in early sessions today, dropping nearly 800 PIPS from 3,435 down to the 3,36x range. While the fall appeared aggressive, the macro backdrop may provide clues — especially ahead of tonight's high-stakes FOMC meeting.
🔍 What Triggered the Sell-off?
1️⃣ China Cuts Rates by 10bps Unexpectedly:
Just ahead of U.S.–China trade talks, China slashed its benchmark interest rate by 10bps. While the move supports Chinese markets, it also boosts the U.S. Dollar (DXY), creating headwinds for gold.
2️⃣ Investors Awaiting FOMC Clarity:
Traders are hesitant to buy gold near recent highs, especially with the Fed expected to signal rate direction tonight. There’s growing speculation that today's events are part of a broader setup for potential Fed easing.
3️⃣ Geopolitical Tensions Not Helping Gold – Yet:
Despite renewed tensions between India and Pakistan, and a volatile global climate, gold hasn't responded bullishly — a sign that technicals and macro shifts are temporarily outweighing news-based fear.
📈 Technical Analysis – Dual Scenarios in Play
Gold is now moving in a wide, volatile range. Liquidity grabs at both ends are likely, and traders should adopt a flexible, confirmation-based approach rather than sticking to one directional bias.
🔺 Key Resistance Zones:
3,390
3,402
3,416
3,432
3,444
3,468
🔻 Key Support Zones:
3,365
3,356
3,332
3,314
🎯 Trade Plan – May 7, 2025 (Pre-FOMC Strategy)
🔵 BUY SCALP
• Entry: 3,355
• SL: 3,350
• TP: 3,360 → 3,364 → 3,368 → 3,372 → 3,376 → 3,380
🔵 BUY ZONE
• Entry: 3,332 – 3,330
• SL: 3,326
• TP: 3,336 → 3,340 → 3,344 → 3,348 → 3,352 → 3,358 → 3,365
📌 KEY BUY LEVEL to Watch:
→ 3,314 – 3,312
⚠️ This is a critical Fibonacci zone. If broken, trend structure may be compromised. Use wide SL (~6 PIPS) with open TP structure.
🔴 SELL SCALP
• Entry: 3,430 – 3,432
• SL: 3,436
• TP: 3,425 → 3,420 → 3,415 → 3,410 → 3,400
🔴 SELL ZONE
• Entry: 3,468 – 3,470
• SL: 3,474
• TP: 3,464 → 3,460 → 3,455 → 3,450 → 3,445 → 3,440 → 3,430
⚠️ Final Thoughts:
Today’s FOMC statement will likely dominate market direction for the rest of the week. Volatility is expected to increase sharply. With both macro and geopolitical catalysts in play, risk management is non-negotiable.
🔐 Stick to key zones. Avoid trading the news blindly. Wait for price action confirmation — and remember: capital protection beats every setup.
📌 Follow this post to get real-time updates after FOMC and new breakout zones for Thursday.

XAUUSD Bullish Continuation Setup 📊 Chart Overview:
Asset: Unspecified (likely XAUUSD or a crypto asset).
Timeframe: Looks like 4H or Daily.
Tools Used:
EMA 50 (🔴 Red Line) — 3,283.978
EMA 200 (🔵 Blue Line) — 3,185.603
Resistance & Support Zones (🔴 Highlighted boxes)
Price: 3,335.415
🔍 Technical Analysis:
🟩 Trend Direction:
📈 Uptrend Confirmed: Price is above both EMA 50 and EMA 200 → Strong bullish momentum.
✅ Golden Cross: EMA 50 is above EMA 200, confirming long-term bullish bias.
📌 Key Levels:
🧱 Main Support Zone (🟥 Bottom Box - ~2,950–3,050):
Historical strong bounce zone.
Acts as a bullish base in case of a deeper pullback.
🔄 Mid Resistance/Support (~3,180–3,260):
Now acting as support after price bounced above it.
Also aligns with EMA 200 ➕🟦 – adds confluence.
📌 Main Resistance Zone (~3,300–3,380):
Current area of consolidation.
If broken, price likely to retest upper resistance.
🚧 Top Resistance Zone (~3,450–3,500):
Target area if bullish breakout continues.
✈️ Next take-profit zone for bulls.
🧭 Market Forecast:
🔁 Retest Expected: Price might pull back slightly to the main resistance area (~3,300), retesting previous resistance as support.
🚀 Upside Potential: Upon successful retest, price is projected to head toward the upper resistance (~3,480).
📉 Bearish Scenario: If price breaks back below 3,260 and EMA 50, expect a dip toward 3,180 or even the main support zone.
📈 Summary:
Bias: ✅ Bullish
Watch for:
🔍 Retest of 3,300 zone
✅ Breakout above 3,380
❌ Breakdown below 3,260 invalidates bullish scenario

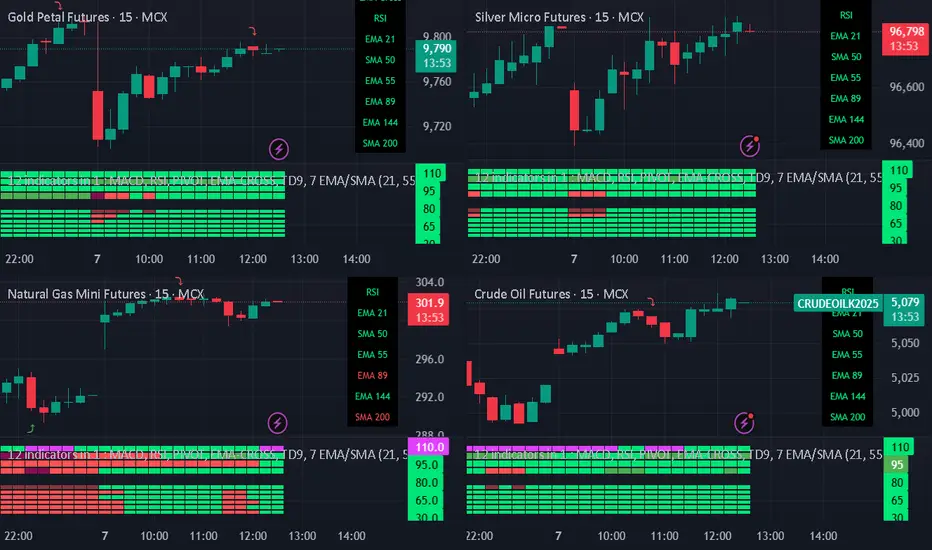
Gold surges thanks to China buying goods, waiting for FED waveInternational gold prices jumped to 3,332 USD/ounce, up more than 72 USD compared to the bottom of last night's session. The main driving force came from the wave of gold buying in China, when concerns about the weakening economy caused people to massively turn to gold as a safe haven. The H4 chart shows a strong increase, EMA34 has crossed EMA89, establishing a clear short-term uptrend. If gold surpasses 3,340 USD, it is likely to head towards the old peak around 3,420–3,500 USD.
Crude oil prices are still fluctuating strongly around 57.2 USD/barrel, creating an unstable foundation for the commodity market. The FED will announce its policy in the early morning of May 8. Although it is expected to not change interest rates, any statement can move the market. This will be the next big catalyst for gold.

XAUUSD Bullish Breakout with Retest & Rally Setup (1H Chart) Pair: XAUUSD (Gold vs US Dollar)
Timeframe: 1 Hour (1H)
Market Bias: Bullish
Strategy Type: Trendline Breakout + Order Block Retest + Liquidity Sweep + Momentum Continuation
📊 Technical Analysis:
🔹 1. Trendline Breakout:
A major descending trendline (bearish structure) was cleanly broken with strong bullish momentum.
This is a market structure shift and indicates potential trend reversal or at least a short-term bullish rally.
🔹 2. Break of Structure & Demand Zones:
Price broke above a key resistance zone (previous supply) around 3360, turning it into support/demand.
A new bullish order block (OB) is visible just below current price (~3340–3350), now acting as an entry zone.
A lower OB zone (~3300–3320) has been left unmitigated, which could act as a second deeper entry point if price retraces further.
🔹 3. Imbalance/Fair Value Gap (FVG):
There is a clean imbalance left between the current price and the lower OB. Price may wick into this zone before rallying.
This imbalance is acting like a magnet and could invite a retracement into the 3340–3320 zone.
🔹 4. Liquidity Engineering:
Buy-side liquidity was likely swept above the trendline break and recent highs.
Sellers trapped above the trendline may give fuel for a deeper push toward the next supply zone.
🔹 5. Target Supply Zone:
A clean and unmitigated supply zone lies between 3480–3500, the ultimate target for bulls if momentum sustains.
📍 Key Levels:
Type Price Range (Approx)
Current Price 3360.90
Entry Zone 1 (OB 1H) 3340 – 3350
Entry Zone 2 (OB 1H) 3300 – 3320
Target Supply Zone 3480 – 3500
Invalidation Below 3300
🎯 Trade Idea:
Entry: On bullish confirmation at 3340–3350 or deeper at 3300–3320
Stop Loss: Below 3300 (structure break + OB invalidation)
Target: 3480–3500 (clean supply zone above)
Risk-to-Reward (R:R): ~1:3 to 1:5 depending on entry zone
✅ Confluences Supporting This Setup:
✅ Trendline break + retest setup
✅ Price flipped previous resistance into support
✅ Strong bullish impulse breaking structure
✅ Bullish Order Block + Fair Value Gap (FVG) below price
✅ Clean upside liquidity pool in untested supply zone
✅ Momentum breakout candle confirms buyer strength
⚠️ Invalidation Criteria:
Breakdown and 1H close below 3300 invalidates the OB and bullish structure.
Be cautious around NFP or Fed-related news, which may spike volatility.
🔁 Potential Scenarios:
📈 Bullish Continuation:
Price retests OB (3340–3350), finds support, and rallies directly to 3480–3500.
🔁 Deeper Retracement:
Price may wick into the lower OB at 3300–3320 to grab liquidity, then rally.
❌ Invalidation:
Breakdown below 3300 = bearish reversal or deeper correction incoming.
📘 Summary Table:
Parameter Value
Bias Bullish
Entry Zone(s) 3340–3350 (primary), 3300–3320
Stop Loss Below 3300
Take Profit 3480–3500
Strategy Trendline Break + OB Retest + Imbalance
Confluences Break of Structure, Demand Zones, FVG, Trendline Break

Gold Surges Amid War Tensions Is This the Start of a New Bull 🟡 Gold Surges Amid War Tensions – Is This the Start of a New Bull Run?
📈 XAU/USD Weekly Outlook – May 6, 2025
Gold made a strong comeback this morning, jumping over 600 PIPS as investor demand surged in response to escalating geopolitical risks and massive physical demand in Asia — particularly from China and Japan. The current breakout momentum suggests a high probability of new ATHs if macro and political tensions continue.
🔥 Why is Gold Rising Again?
1️⃣ Geopolitical Flashpoint:
19+ Ukrainian UAVs struck Moscow overnight.
The attack came just ahead of Russia's Victory Day (May 9) — a symbolic blow that rattled global markets.
2️⃣ China Ramping Up Gold Imports:
Reports show China has been quietly stockpiling gold at aggressive levels.
Institutional and retail demand has returned strongly to the Asian bullion market.
3️⃣ Fear and FOMO in the Market:
Asian investors are driving early-session buying frenzies.
Technical retracements are being ignored as price accelerates without respecting classic resistance zones.
📊 Technical Outlook – H4 + D1 Focus
Gold has successfully defended the 3312 zone and surged past resistance zones with ease. Current MA13/MA34/MA89 crossovers on higher timeframes confirm a trend reversal and sustained bullish momentum.
🔑 Key Technical Zones to Watch:
🔻 Support Levels:
3355
3335
3313
🔺 Resistance Levels:
3380
3405
3443
3470
🎯 Trade Plan for May 6 – BUY Bias Dominant
🚫 Avoid SELL positions unless confirmed exhaustion appears — momentum is extremely bullish and politically driven.
🔵 BUY ZONE #1:
Entry: 3314 – 3312
SL: 3308
TP: 3318 → 3322 → 3326 → 3330 → 3340 → 3350 → ???
🔵 BUY ZONE #2:
Entry: 3335 – 3332
SL: 3329
TP: 3340 → 3344 → 3348 → 3352 → 3356 → 3360
🔴 SELL ZONE (High Risk):
Entry: 3343 – 3345
SL: 3359
TP: 3339 → 3335 → 3330 → 3326 → 3320
🧭 Final Thoughts
Gold is currently in hyper bullish mode. Key level 3313 is now confirmed as a volume-based support (VPOC + FIBO 0.5) and will likely be the base for the next wave. As global headlines point to uncertainty, investors are shifting capital back into gold, supported by physical buying from China.
💬 Patience and proper entry are key. Avoid early sell traps. Focus on the Asia-led FOMO rallies and align your strategy with safe-haven flows.

"Silver – Bearish Move Toward Support"🧠 Market Overview:
Instrument: Likely Silver (based on file name).
Chart Context: The price is currently trading below both the 50 EMA (red) and 200 EMA (blue), indicating bearish momentum and a possible shift in market structure.
📊 Key Technical Components:
🔹 Exponential Moving Averages (EMA):
50 EMA (32.614) is above the 200 EMA (32.526) but both are above the current price.
This crossover is recent and could indicate the beginning of a larger downtrend if confirmed by continued price action below both EMAs.
🔹 Market Structure:
POI (Point of Interest) marks a previous swing high where selling pressure emerged.
The chart shows internal liquidity (INT.LQ) sweeps both above and below consolidation areas, hinting at smart money manipulation to grab liquidity before making a move.
🔹 Resistance Zone:
Clearly defined between approx. 33.4–34.0, where price was rejected after a failed attempt to break higher.
Multiple rejections from this zone show strong selling pressure.
🔹 Support Zone:
Sitting between approx. 30.8–31.2.
Price previously consolidated here before a bullish move, making it a likely target for a return test or a potential bounce.
📉 Bearish Scenario & Projection:
The price broke below a short-term structure and failed to hold above EMAs.
The current price action shows a bearish pullback likely to form a Lower High (LH).
The projected path shows a pullback to previous support-turned-resistance, followed by a breakdown targeting the support zone.
✅ Bias:
Short-term bias: Bearish
Medium-term bias: Bearish, unless price reclaims the 200 EMA and consolidates above the resistance zone.
🔍 Confluences Supporting Bearish Outlook:
Price below EMAs (dynamic resistance).
Failed higher highs with liquidity sweeps (indicating smart money selling).
Clear market structure shift to the downside.
Anticipated retest of support zone around 30.8–31.2.

GOLD - Will Geopolitical Shocks Fuel a Bigger Rally?🚨 GOLD SURGES IN ASIA OPEN – Will Geopolitical Shocks Fuel a Bigger Rally?
Gold opened the week with a powerful bullish spike in the Asia session, rallying nearly $30/oz amid renewed global tensions and policy uncertainty. The strong upside momentum marks a potential shift in sentiment after recent corrections.
🌍 What’s Driving the Market?
🔺 Geopolitical Risks Back on the Radar:
Tensions are rising again between Russia–Ukraine and India–Pakistan with no clear diplomatic resolution in sight.
This reintroduces safe-haven demand for gold as global uncertainty climbs.
🔺 Trump’s Pressure on the Fed:
Former President Trump has urged the Fed to cut interest rates sooner, adding further speculation ahead of the FOMC meeting this week.
These combined factors have sparked strong buying interest right from the Asia open, with the yellow metal attempting to reclaim lost ground from previous sessions.
📈 Technical Overview (H1 – H2 Focus):
🟢 Key Support Zones:
3250
3246
3238
3224
3204
🔴 Key Resistance Zones:
3278
3288
3301
3314
🎯 Trade Setup for the Day:
🔵 BUY ZONE: 3246 – 3244
SL: 3240
TP: 3250 → 3254 → 3258 → 3262 → 3266 → 3270 → 3280
🔴 SELL ZONE: 3300 – 3302
SL: 3306
TP: 3296 → 3292 → 3288 → 3284 → 3280 → 3270
⚠️ Final Notes:
With the FOMC meeting ahead and geopolitical developments unfolding, traders should expect heightened volatility this week. Gold may continue to attract safe-haven flows if headlines escalate, but any dovish surprise from the Fed could accelerate the rally even further.
📌 Stay alert. Let price come to your zones. Trade the reaction, not the assumption.

Gold price suddenly accelerates, approaching the 3,300 USD/ounceAfter two consecutive weeks of decline, the world gold price is showing strong signs of recovery when it skyrocketed to 3,266 USD/ounce - an increase of 25 USD in just one session. Although still quite far from the peak of 3,500 USD/ounce, the increase this morning shows that investor sentiment has begun to change direction.
The increase occurred at the beginning of the session despite previous negative forecasts, reflecting the sensitivity of gold to geopolitical and economic information such as US-China trade negotiations or the strength of the USD. The daily chart shows that gold has bounced strongly from the EMA34 support zone and returned to the resistance zone around 3,320–3,340 USD, opening up an opportunity to retest the 3,400 USD mark if the current increase is maintained.

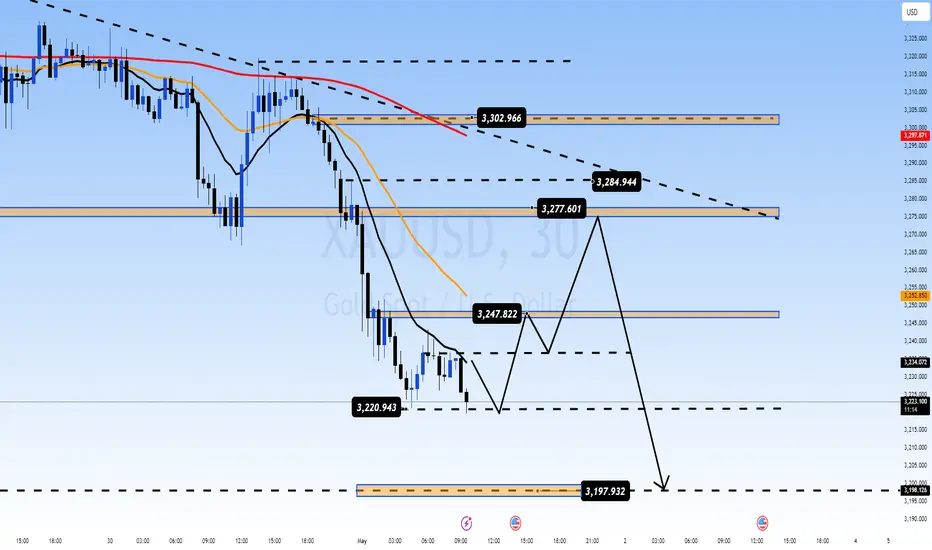
XAU/USD Market Outlook – Key Levels & Scenarios (May 2025)📊 Market Overview
Asset: XAU/USD (Gold vs. USD) – likely
Timeframe: 🕒 4H or Daily
EMAs:
🔴 50 EMA = 3,281 (short-term trend)
🔵 200 EMA = 3,179 (long-term trend)
🧱 Key Zones
🔺 Main Resistance Zone (🚫 Supply Area)
📍 ~3,320–3,400
🔍 Observation: Strong rejection zone with multiple failed attempts. 🚧 Price struggles to break and hold above here.
⚖️ Mid Support & Resistance Zone
📍 ~3,200–3,250
🧭 Current Action: Price is consolidating here. This is a key decision zone. A bounce or breakdown will likely decide the next big move. 🤔
🟦 Main Support Zone
📍 ~2,980–3,030
🛑 Observation: Major demand zone. If price falls here, it might attract buyers 👥 for a potential rebound.
📉 EMA Analysis
🔴 50 EMA is above 🔵 200 EMA → Trend still technically bullish ✅
🟡 BUT: Price is currently below 50 EMA, showing short-term weakness ⚠️
⚡️ 200 EMA is nearby (~3,179): Acting as dynamic support — a critical bounce zone! 🛡️
🔮 Scenarios
🐂 Bullish Path
✅ If price bounces from 3,200 support zone and reclaims 🔴 50 EMA:
🎯 Target: Retest of 3,320–3,400 🔺 zone
📈 Confirmation: Strong candle closing above 3,281 🔴 EMA
🐻 Bearish Path
🚨 If price breaks below 3,200 & 200 EMA:
🕳️ Expect drop towards 2,980–3,030 🟦 zone
📉 Confirmation: Candle closes below 3,179 with weak retest
✅ Conclusion
📍 Key Level to Watch: 3,200
⚖️ Market Sentiment: Neutral → Bearish bias unless price reclaims 50 EMA
🔒 Risk Tip: Avoid longs until price confirms bullish structure again 🔐

GOLD - Will FOMC and Tariff Talks Decide the Next Big Move?💥 GOLD WEEKLY OUTLOOK – Will FOMC and Tariff Talks Decide the Next Big Move?
As we head into a critical trading week, gold is at a crossroads, navigating through conflicting macro signals and important structural levels. Last week’s developments — ranging from strong US NFP data to China’s unexpected SGX:40B tariff waiver — have significantly reshaped sentiment in the precious metals market.
🌐 Macro Backdrop – Shift in Global Risk Tone
🔹 China’s Tariff Waiver on selected US goods hints at improving trade ties. This eases geopolitical risks and reduces the urgency for safe-haven assets like gold.
🔹 Stronger-than-expected NFP (Nonfarm Payrolls) further solidifies a hawkish bias for the Fed. A robust labor market may push the Fed to maintain higher rates for longer.
🔹 DXY & Bond Yields are holding firm. A stronger USD and rising yields typically weigh on gold — unless major risks re-emerge.
📌 FOMC Meeting This Week – Traders are now watching the Fed’s next move closely. Any dovish tone could fuel gold’s rebound. A surprise hawkish tone? Expect further selloffs.
🔍 Technical Landscape (H4 + Daily Focus)
Gold is currently forming a descending wedge pattern, with lower highs and solid support holding around the 3,224 – 3,204 zone.
Last week’s rejection at the 3,277 resistance aligns with macro-driven selling pressure. However, price continues to respect key Fibonacci levels and internal trendline dynamics, suggesting a potential for large breakout movement after FOMC.
🔺 Key Resistance Levels:
3,240
3,250
3,264
3,277
3,311
🔻 Key Support Levels:
3,224
3,210
3,204
🎯 Trade Plan – Week of May 6th, 2025
🔵 BUY ZONE A: 3,204 – 3,202
SL: 3,198
TP: 3,208 → 3,212 → 3,216 → 3,220 → 3,225 → 3,230
🔴 SELL ZONE: 3,276 – 3,278
SL: 3,282
TP: 3,272 → 3,268 → 3,264 → 3,260 → 3,250 → 3,240
⚠️ Key Risks to Monitor This Week:
🏛 FOMC Statement & Powell’s Press Conference
→ Any hint of rate cuts = Gold bullish
→ Any reaffirmation of higher for longer = More downside
💼 Trade Developments (US–China)
→ Further easing of tariffs = Negative for gold
→ Any new friction = Potential rebound
📉 DXY & Bond Yields
→ Keep an eye on Dollar strength. If DXY breaks above 106.5, gold may face deeper pressure.
🧠 Final Thoughts:
The gold market is no longer driven by one-sided risk-off flows. As macro tensions ease, gold is transitioning into a more range-bound, news-driven phase.
This week is all about reaction, not prediction.
Let the market come to your zone. Wait for confirmation before executing. The best trades come from discipline — not prediction.
📌 Follow this account for real-time updates during FOMC and Friday’s CPI preview.

Gold recovers after deep fallWorld gold prices recovered to 3,238 USD/ounce on the morning of May 2 after hitting a bottom of 3,205 USD/ounce last night. The reason came from the sell-off when the Chinese market was on a long holiday, causing a lack of physical buying power.
However, investors quickly took advantage of this opportunity to buy, amid expectations that the FED would lower interest rates and central banks would continue to collect gold as a safe haven asset. The 4-hour chart shows that the price has bounced back from EMA89, heading towards the EMA34 resistance zone - a positive sign for a short-term recovery.

Sellers Take Over as Gold Breaks ConsolidationGold is moving exactly as I mapped out in my previous updates,and Breaks Down from Consolidation following the path accurately that we discussed in last updates....
Yesterday’s monthly close gold closed below 3300 level, which gave sellers more confidence. As a result, we’ve seen a solid drop today, with the price now at 3132 on the daily chart, down 1.73% .
The Price Action confirms the bearish momentum I’ve been talking about. We’re now approaching some key levels for intraday . The 3220-3225 HVN area and the 3200-3210 psychological support zone are spots where we might see a short-term bounce. However, the larger trend remains in correction mode, just as I projected earlier.
For stronger support, I’m keeping an eye on the 3135-3150 zone, and if the decline continues, the 2980-3000 area could be a great spot for a potential swing buy, as marked on the chart.As of now I am still expecting the correction to play out toward 3000 in the bigger picture!

NFP & White House Comments to Spark Heavy Volatility?🚨 Gold Pauses at Crossroads – NFP & White House Comments to Spark Heavy Volatility?
Gold is entering the US session with a quiet rebound after an intense selloff phase. Following its historic rally to $3,500/oz, the yellow metal has come under significant pressure — not from fundamentals alone, but from massive profit-taking across Asia, especially from retail investors in China.
Such sharp pullbacks are not abnormal after parabolic runs. Instead, this pullback seems like a healthy technical reset before the market processes two major catalysts later today:
1️⃣ The US Nonfarm Payrolls report (May edition)
2️⃣ Official White House comments on tariffs and trade direction
Together, they’re likely to dictate where Gold is heading next — either a retracement deeper into the demand zones, or a renewed upside attempt toward recent resistance.
📊 DXY & Macro Lens:
The US Dollar Index (DXY) has rebounded strongly from its base near 98.xx, now reclaiming levels near 100.00. Whether it continues higher depends largely on labor data and economic signals from the White House tonight.
For now, traders should remain neutral-biased but responsive — and treat every key level with surgical precision. Use the H1–H2 timeframe for intraday bias and structure-based execution.
🔺 Key Resistance Levels:
3260
3275
3285
3312
🔻 Key Support Levels:
3244
3230
3215
3200
🎯 Trade Plan for Today – May 3rd, 2025:
🔵 BUY ZONE A: 3232 – 3230
SL: 3226
TP: 3236 → 3240 → 3244 → 3248 → 3252 → 3256 → 3260
🔵 BUY ZONE B: 3214 – 3212
SL: 3208
TP: 3218 → 3222 → 3226 → 3230 → 3235 → 3240
🔴 SELL ZONE: 3276 – 3278
SL: 3282
TP: 3272 → 3268 → 3264 → 3260 → 3250
⚠️ Final Notes:
Volatility today could spike sharply during the US session. With nonfarm data + political headlines colliding at once, this is the kind of session where fortunes are made — or lost.
📌 Avoid emotional trades. Let price reach your zones, wait for confirmation, and stick to your TP/SL rules like a professional.
🚀 The real move hasn't happened yet — but it's coming.
Be ready. Be sharp. Trade with discipline.

Gold’s Calm Before the US Data Storm – Are You Ready?Consolidation Continues Amid Global Holidays – Is Gold Gearing Up for Another Leg?
🌐 Fundamental Insight:
After last week’s historic rally toward $3,500/oz, gold has entered a cooling phase as markets digest evolving geopolitical developments and economic signals. The recent de-escalation in US-China trade tensions, triggered by President Trump’s plan to ease tariffs on auto parts and imports, has reduced immediate risk sentiment.
China’s response — lifting retaliatory duties on select US goods — further eased tensions, leading to a safe-haven selloff in precious metals. However, with uncertainty still looming ahead of this week’s US labour data (ADP + NFP), investors remain cautious.
Adding to this, today’s Bank Holidays in parts of Asia and Europe are contributing to reduced trading volumes. A sideways market with erratic moves is likely until the US session opens, where higher volume and stronger direction may emerge.
🔍 Technical Picture (H1 – H4 Outlook):
Gold is currently forming a compression pattern between the 3278 resistance zone and the 3196 demand area. Price is holding above key structure support near 3192, indicating buyer interest remains intact.
The market may continue to oscillate in this tight intraday range before US traders step in. All eyes are now on upcoming ADP employment data — often a lead indicator for Friday’s NFP — which could provide the next directional push.
🔺 Key Resistance Zones:
3248
3260
3278
🔻 Key Support Zones:
3230
3225
3215
3196
🎯 Trade Strategy – April 30
🔵 BUY ZONE: 3198 – 3196
Stop-Loss: 3192
Take-Profits: 3202 → 3206 → 3210 → 3215 → 3220 → 3225 → 3230
🔴 SELL ZONE: 3276 – 3278
Stop-Loss: 3282
Take-Profits: 3272 → 3268 → 3264 → 3260
🧠 Note: Short-term traders may consider scalping within the range, while swing traders can wait for a break and retest of either key zone before committing with volume.
⚠️ Things to Watch Today:
Thin liquidity due to Labour Day holidays across Asia & Europe
ADP report release in the US session (potential volatility spike)
End-of-month candle close — watch out for liquidity grabs and false breakouts
US 10Y bond yields and DXY movements will continue to influence gold sentiment
📌 Final Thoughts:
Gold is in pause mode, but not for long. The market is clearly building energy ahead of high-impact US data. With the broader trend still bullish and structure holding above 3190s, we stay cautiously optimistic — but flexible.
Risk management will be critical today. Expect the unexpected during low-volume sessions and be prepared for sharp moves when the US opens.
📈 Stay disciplined. Respect your zones. And let the data lead the way.
Gold continues to lose value, pressured by USD and China dataWorld gold prices fell to $3,279/ounce, down $31 from the previous session's peak. The USD increased slightly along with the decline of crude oil and US stocks, making gold less attractive.
In addition, weak economic data from China raised concerns about falling physical gold demand - contributing to the price decline. On the daily chart, gold is falling from the peak, approaching the EMA34, warning of the risk of a deeper correction if it fails to hold this support level.

Gold Still Dropping What I’m Watching This Week....Following my last update, gold price action continues to align with the bearish short-term outlook I projected. The weekly close on April 27, 2025, as seen in the chart, confirmed the bearish sentiment with a red candlestick, well below the recent highs and the golden Fibonacci zone (3380-3408). This reinforces that sellers remain in control.
Today, gold is still trading , below the golden Fib zone, which continues to act as a resistance. The price has not yet tested the first support level at 3150-3165, but the downward trajectory suggests it may approach this zone soon. If this support holds, we might see a temporary bounce; however, a break below 3150-3165 could accelerate the decline toward my target of 3000, as indicated by the chart projected path.
The weekly close below the recent swing highs and the failure to reclaim the golden Fib zone strengthen the bearish case. For the short term, I expect gold to continue its downward movement unless a significant reversal pattern emerges.
Gold weakens under pressure from USD and bonds
On the morning of April 30, the world gold price fell to 3,318 USD/ounce, down 20 USD compared to the same time the previous day. The strong increase in USD and high US bond yields at 4.23% made gold lose its appeal in the eyes of investors.
The recovery of US stocks and the decline in oil prices further depressed market sentiment. On the H4 chart, gold has not yet escaped the sideways zone around EMA34 - a sign that buying power is weakening.

Gold Monthly Close Today : Range Bound and Ready for a Move...Since my last update, not much has changed, Gold is still stuck in that range-bound movement we’ve been watching. ,Price continuing to trade in triangle pattern I mentioned before. It’s definitely tightening up, which means we’re getting closer to a breakout.
Right now, 3300 is holding strong as a good support level, while 3350 is acting as a major resistance, keeping the price in wide range. My view hasn’t shifted , I’m still leaning bearish for the short term, as the price remains below the golden Fibonacci zone (3380-3408), and the weekly close earlier this week already confirmed the sellers are in control.
Today’s monthly close is important, and it could set the tone for what’s next. If gold closes below 3260-75, it’ll strengthen my case for a drop toward 3000. But if we see a surprise breakout above the triangle and 3350, we might need to rethink the short-term direction. For now, I’m sitting tight, waiting for the breakout from this range to get a clearer picture. Let’s see which way gold decides to go on month closing...

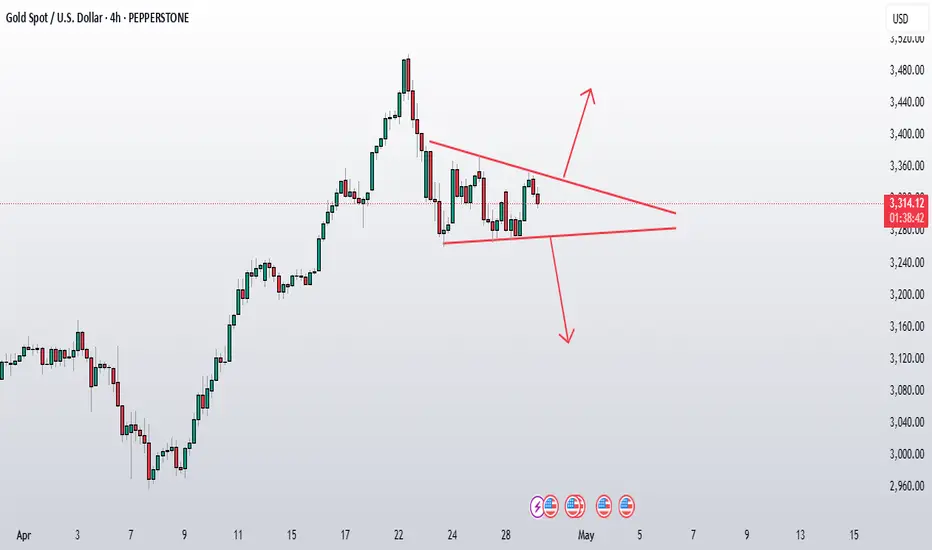
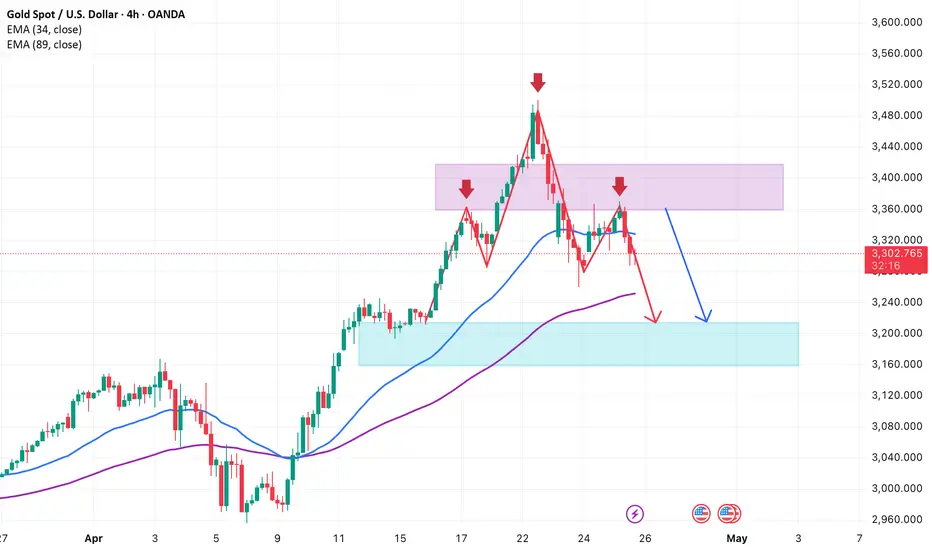
Gold forms a top patternOn the H4 chart, the gold price chart is forming a clear bearish structure after forming a three-peak pattern in a row around the $3,435–$3,470 range. Each time the price touches this range, it is strongly rejected, indicating that selling pressure controls the market. The fact that the price cannot maintain above the EMA34 and EMA9 at the same time is also a sign of confirmation of a weakening trend in the short term.
Although gold recovered slightly to the $3,365 range in the Asian session on April 25 thanks to news of PBOC money injection and a weakening USD, the buying pressure was not enough to break the bearish structure. The price quickly reversed and fell below the $3,300 mark, confirming the possibility of further correction in the near future.
Currently, the price has cut below the two EMAs and broken the nearest bottom at $3,290, triggering a bearish signal according to the “small head and shoulders” pattern on the H4. The next target is the strong support zone of $3,180–$3,220. If this zone is broken, the correction trend may extend deeper to the $3,100 area.
The appropriate short-term strategy at this time is to wait for the price to retrace to the $3,310–$3,330 area, cut losses above $3,350 and take profits around $3,200. The bullish scenario will only happen if the price breaks above $3,370 and closes above the old resistance – then the bearish structure will be broken.
XAU/USD Outlook – Will This Tight Range Explode Soon?🔥 XAU/USD Outlook – Will This Tight Range Explode Soon?
📊 Technical Overview:
Gold (XAU/USD) has entered a consolidation phase after last week's sharp swings. The market is currently trapped within a tightening structure between 3,274 and 3,336, forming a potential wedge or triangle pattern. This type of structure often precedes a breakout.
Price is still hovering below the 200 EMA on the H1 timeframe, while key support zones are starting to show signs of buying interest. A hold above 3,301 could lead to a potential rally toward the upper resistance levels at 3,352 – 3,366.
🔺 Key Resistance Levels:
3,336.767
3,352.159
3,357.689
3,366.067
🔻 Key Support Levels:
3,301.370
3,291.885
3,274.779
🎯 Trade Setups:
🔵 BUY ZONE:
Entry: 3,274 – 3,276
SL: 3,270
TP: 3,284 – 3,291 – 3,301 – 3,336
🔴 SELL ZONE:
Entry: 3,357 – 3,366
SL: 3,370
TP: 3,336 – 3,301 – 3,291
📰 Today’s Market Focus:
No major economic data is expected today. However, markets may begin pricing in expectations ahead of this week’s key releases — ADP Employment Change and Nonfarm Payrolls (NFP).
Geopolitical tensions in South Asia and statements from FED officials may act as surprise catalysts for gold volatility.
🧭 Conclusion:
Gold remains stuck in a tight sideways channel. Traders should continue range trading while waiting for a confirmed breakout. A strong breakout above 3,366 or breakdown below 3,274 will set the tone for the next directional move.
👉 Trade smart and manage your risk. All eyes on U.S. data and geopolitical headlines!

Still Bearish on Gold – Watching Triangle Breakout Gold price continues to exhibit a bearish short-term outlook, with price action remaining range-bound. As observed on the 4-hour chart shared today, gold is currently forming a triangle pattern, indicating a consolidation phase. The price is trading at 3146.13, still well below the golden Fibonacci zone (3380-3408), reinforcing that sellers maintain control.
The triangle pattern suggests an impending breakout, and the direction of the breakout will likely dictate the next significant move. Given the bearish context from ,my previous analysis supported by the weekly close below recent swing highs and the failure to reclaim the Fib zonemy bias remains toward a downward breakout.
If the price breaks below the triangle's lower trendline, it could test the key support at 3150-3165. A break below this level would likely accelerate the decline toward my target of 3000, as previously projected.
However, if gold breaks above the triangle's upper trendline, it could signal a potential short-term reversal, possibly retesting resistance around 3380. For now, I lean toward the bearish scenario, expecting lower levels to be tested soon unless a strong bullish sign appear outside of this range formation .