MFSL

Bearish divergence in MFSL after new ATHThe monthly chart signals a possible pullback in the MFSL price this month. Already a new all-time high is made, 1666.90
Immediate support to invalidate the fall will be 1579.50 to 1564.85 range, which also makes st target for the fall.
The other levels' downside are 1511, 1470 and 1376.50
If price bounces from the support range and closes above 1648, the bullish trend will continue for new higher highs.

Max Financial - Positional Short SetupCMP 1305 on 02.05.25
In the last 2 months, the stock price has increased by around 30%. This time forming a double top-like pattern. If the price is rejected from these levels, a bearish move may come ahead.
If the price remains below the 1300 levels, targets of 1245/1210 and 1165 may be seen.
One should wait for the confirmation for a short setup, while considering risk management.
The setup fails if the price sustains above 1330.
All these illustrations are only for learning and sharing purposes, not a trading recommendation. It is only for paper trading.
All the best.

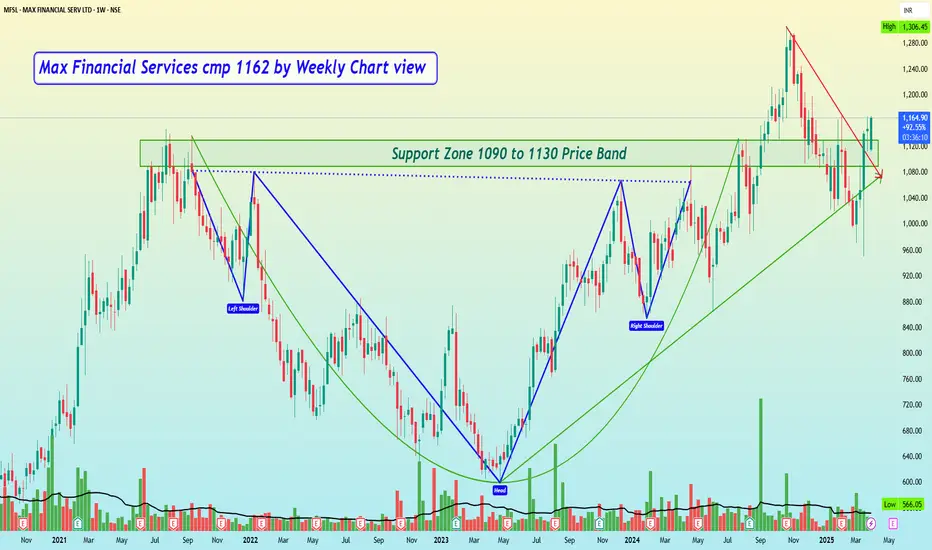
Max Financial Services cmp 1162 by Weekly Chart viewMax Financial Services cmp 1162 by Weekly Chart view
- Support Zone 1090 to 1130 Price Band
- Resistance Zone 1200 to 1245 Price Band
- Volumes getting in close sync with average traded quantity indicating demand based buying
- Price respecting Rising Support Trendline and sustaining Breakout above Falling Resistance Trendline
- Support is going thru the test and retesting phase with a faint breakout in the making process seen clearly
- Multiple intertwined Bullish Patterns of Rounding Bottom, Cup & Handle, Head & Shoulders, as one may observe and interpret
Max Financial Services Ltd – Trend Reversal in Play?🚀 Technical Analysis Breakdown:
The yellow trendline shows a long-term support, which has held well despite recent corrections.
The red downtrend line indicates a recent bearish phase, which has now been broken with a strong bullish candle.
The stock has bounced from the trendline support, showing signs of strength.
Above all the strong Pinbar candle looks amazing for a candle close .
🔎 Your Take? Do you see further upside or a pullback? Comment below! 👇

MFSL - Looks ready to finally bounceStock has broken the trend line with excellent candle making a fresh demand zone area of 1070-80
It also contains a lower strong zone at 1020-30
Chart suggests to bounce from current levels
If happens it may try to reach near its first target area of 1190 - 1200
As market seems too volatile, take confirmation on lower time frame before opening a new positions, also trade with strict stop loss

Tight Range Breakout | MFSLFor Education Purpose only!!!!
**MFSL stock is already up by 3%, but it’s holding up well in this falling market. I'm charting this stock just for my own perspective and clarity, though I may not be 100% accurate.**
FIIs are playing their old trick:
1️⃣ Push prices down 📉
2️⃣ Buy cheap stocks 💰
3️⃣ Wait for rate cuts 📊
4️⃣ Profit big in the next bull run! 🚀
Retail investors, don’t fall for the fear!
✅Stay invested—smart money knows a bull run is coming!
News has circulated about the index predicting a target of 24,000 for Nifty and 50,500 for Bank Nifty. The price has already been quoted in the reports.
⭕️ Swing Trading opportunity: Price Action Analysis Alert !!!⭕️
💡FNO Stocks Trading📉📈📊
✅Check out my TradingView profile to see how we analyze charts and execute trades.
💡✍️Applied Tools:-
✅Strong Chart Pattern Breakout
✅Channel Pattern
✅Range Breakout
✅Resistance becomes support
🙋♀️🙋♂️If you have any questions about this stock, feel free to reach out to me.
📍📌Thank you for exploring our idea! We hope you found it valuable.
🙏FLLOW for more !
👍LIKE if useful !
✍️COMMENT Below your view !

MFSL looking good on a monthly timeframeMFSL has given a breakout at 1150 on a weekly timeframe. Upside potential: 30-40%. Stop loss: 1120. This is not a buy/sell recommendation. Research carefully and invest at your own risk

MFSLENTRY TARGET SL Mention in the chart.
ALWAYS TAKE TRADE WITH CONFIRMATION
Note : Trading in any financial market is very risky. I post ideas for educational purpose only. It is not financial advice. Do not hold us responsible for any potential loss you may incur. Please consult your financial adviser before trading.

Stock: MFSL (Max Financial Services Ltd)Stock: MFSL
Trend: Bullish
Setup: Rounding Bottom Breakout
Timeframe: Weekly Chart
Analysis:
MFSL has exhibited a classic bullish reversal pattern, the rounding bottom. This formation typically signals a transition from a bearish to a bullish trend. The stock's recent breakout above ₹1,150 confirms the completion of this pattern, suggesting a strong upward trajectory.
Key Takeaways:
1. Upward Trend: The price's position above the 50-week EMA indicates a positive long-term trend.
2. Breakout Confirmation: The successful breakout from the rounding bottom pattern reinforces the bullish outlook.
3. Volume Support: The surge in trading volume accompanying the breakout suggests robust buying interest.
Recommendation:
Given the strong bullish signals, **MFSL is a buying zone **. Traders and investors may consider entering positions with short-term targets of ₹1,250 to ₹1,300. For long-term investors, holding the stock could potentially yield even higher returns.

Keep the eyes open of MFSLOn the weekly chart, this seems worth watching as a breakout took place after the good consolidation. Below the horizontal line, it will again enter in week zone.t
This is not a suggestion to buy and sell, shared for educational purposes only. I am not a SEBI-registered technical analyst.

MFSL GIVES BRAKE OUT ON DAILY CHARTNSE:MFSL
MFSL gives brakeout on daily chart
I am buying this stock
Near 1030
And follow sl on 980
My target will be 1130
My risk reward ratio is 1:2
Return on capital 10%

MFSL - Bullish Consolidation with VolumesNSE: MFSL is closing with a bullish consolidation candle supported with volumes.
Today's volumes and candlestick formation indicates strong demand and stock should move to previous swing highs in the coming days.
The stock has been moving along the horizontal support for the past few days which is indicating demand.
One can look for a 8% to 12% gain on deployed capital in this swing trade.
The view is to be discarded in the event of the stock breaking previous swing low.
#NSEindia #Trading #StockMarketindia #Tradingview #SwingTrade

Bullish signs for MFSLOn the breakout of the pennant pattern in MFSL, Target is projected at 1049.50 and 1062.50 (spot prices).
Immediate resistance at 1005.90-1006 for any possible reversal in trend, making it an important level to watch while taking a buying entry.

MFSLAfter a small retracement this script looks well set for a good move to the targets mentioned in green

MFSL COMING OUT FROM RANGEMFSL coming out from a range box
with good volume
trading above 20 ema
educational idea only

risky buytargeting rate 910-912
buy entry triggered based on my ichimoku study
bit of risky trade
disclaimer = trade @ own risk

MFSL - Perfect bullish chart patternWe are looking weekly chart at this moment. MFSL is looking promising for the upside at the current level. First, the Stock has given the breakout of the long bearish trend line, and after it has given the break-out of the resistance zone. The chart structure is good, keep an eye on it.
Disclaimer - I am not a SEBI-registered technical analyst and advisor so contact your financial advisor and make a self-decision. I will not be responsible for any profit or loss.

M F S L MFSL fut broke out of ascending triangle pattern with decent OI on an hourly charts.
Could be bought with metioned stoploss & targets.

MFSL the MFSL share price is trading at 703.2, which is higher than the price on June 20, 2023. The price has also been moving up in the past few days, and it is currently trading above the 50-day moving average.
The technical analysis that I provided earlier was based on the price data from June 20-22, 2023. Since then, the price has moved up, and the trend is now bullish. The price is still forming a double top pattern, but it is possible that the bears will lose momentum and the price will start to move higher.
Here are some of the factors that could influence the price of MFSL in the near term:
The overall market sentiment
The performance of the company's earnings
Any news or announcements from the company
Any changes in the political or economic environment
It is important to note that technical analysis is not a perfect science, and it is not always accurate. The price of MFSL could continue to fall, even if the technical analysis suggests that the trend is bullish.

MFSL Breakout BUY!MFSL LONG SETUP
Attached: Daily Chart as of 21st June 2023
- Price has activated an Inverted Head & Shoulders/ Cup & Handle/ Bull Flag Breakout today on the back of High Volumes (Price Volume Pattern BO)
- Laggard from Insurance is finally joining in the Sectoral Rally (Sector Tailwinds)
- The previous Dip halted at 0.382, ABC corrective (Wave 3 or Wave C upside pending)
- Daily RSI crossed above 70 today
- Daily MACD gave a Buy Signal today
Upside Target= 785/ 807🎯📈
Stop Loss= Today's Low (< 710)


