1 Support and 1 Breakout trade idea for 26 July Markets I daily make educational content videos for swing / positional trading
MGL

MGL SWING Trade Long As shown in the chart drawing study I predict my study to be right in future
Disclaimer - This is not a Stock recommendation.
Investments in securities are subject to market risk. The value and return on investment may vary because of changes in interest rates, foreign exchange rates, or any other reason.
It's an educational post for analyzing, learning & discussing general and generic information related to stocks, investments, and strategies.

intraday, swing, short term, MGLThere is a possibility for big move
instead of intraday its better to go for 3 to 4 days of holding
with proper risk management.
.
.
.
entry: 895
stoploss: 830
.
.
refer old idea attached below


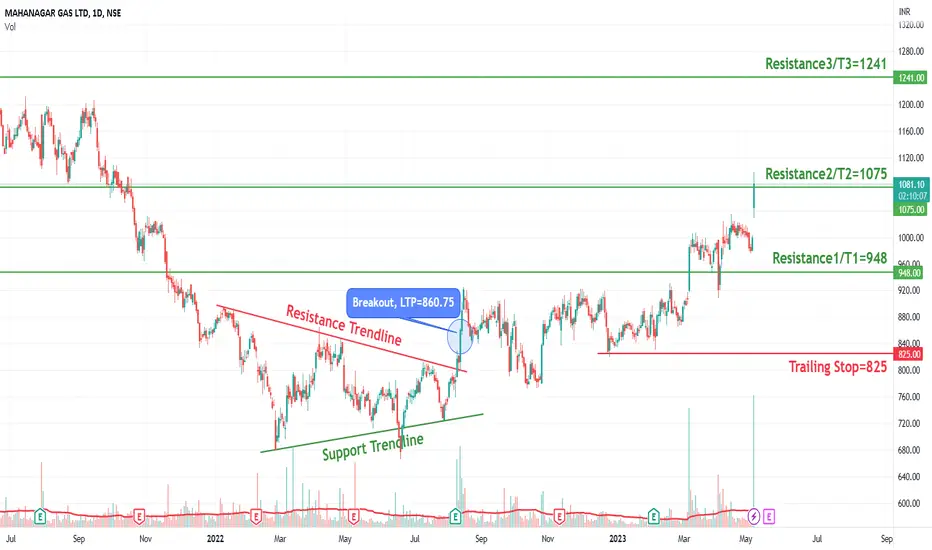
MGLMGL:- If the stock breakouts from the trendline, it can show an upside moment. Keep an eye on the stock.
Hello traders,
As always, simple and neat charts so everyone can understand and not make it too complicated.
rest details mentioned in the chart.
will be posting more such ideas like this. Until that, like share and follow :)
check my other ideas to get to know about all the successful trades based on price action.
Thanks,
Ajay.
keep learning and keep earning.

MGL - Long Setup, Move is ON..NSE:MGL
✅ #MGL trading above Resistance of 1075
✅ Next Resistance is at 1241
Related charts:
Charts are self-explanatory. Levels of breakout, possible up-moves (where stock may find resistances) and support (close below which, setup will be invalidated) are clearly defined.
Disclaimer: This is for demonstration and educational purpose only. This is not buying or selling recommendations. I am not SEBI registered. Please consult your financial advisor before taking any trade.
watch MGL for massive for 1 day move in coming weekNSE:MGL #MGL has become sideways at previous high level/previous resistance on daily timeframe and it is trading in the same range in which it was stuck before crashing massively,
if MGL crosses 1030 level or opens above it, we might see a sudden rise of 5%+ move in a single day ,
ih it goes below 1000 again, we might see downside move again, watch both levels closely for breakout

will this time GAIL finally succeed?GAIL in the past couple of sessions, made multiple attempts to kick out the resistance zone of 105-110
it failed
will it be successful now? and make a move towards 140?

MGL Rising wedgeMGL has given a good breakout above 930 two weeks back, however post breakout follow through is missing and price has started showing weakness due to absence of any follow through, and is facing resistance in 50 to 61.8% fibo pullback zone from June 21 high to June 22 low.
Chart is also showing a rising wedge formation on weekly timeframe, and current weekly candle has closed below the doji of previous week's low which is also a sign of bears taking control of this after the breakout.
If the price start sustaining below and even breaks down support trendline then it can even correct upto 850 and below levels.

BANKNIFTY INTRADAY entry for either side is after breaking the "yellow" box mentioned above
.
entry is recomended after breakout and retracement complete
.
incase of long entry target is small for shortterm
.
for short entry target is mentioned
.
both side target is for this next week expiry
6/04/2023
.
.stay for next update
.
time frame 15 min or 1hr
fake outs will be there, trade carefully

MGL : Positional Call👉 #MGL : Weekly Chart
📌 Positional call : (3-6 Months)
>> Ascending Triangle Breakout with Volumes
>> Buy @cmp or near Supply zone if it Retraces
>> Good Strength & Volumes in Stock
Like , Share & follow for more such Analysis
Keep Learning & Keep Growing


MGL : STOCK FOR INTRADAYHere comes another Stock for Day Trading for 17 Feb 2023. The Chart is breaking out Ascending Channel @ 920.85. In hourly Time frame, it is already showing price action at this level. Thus, signaling that we may have a new support @ 920.10. Thus, we may see a breakout with new targets as 975 and 1065. Entry Level is 933 not before that , with a small SL of 915.
Please Boost my study and motivate me, so that I can bring more ideas to you.

MGLMGL:- Rounding bottom pattern is formed, stock is about to give breakout after 1 and half year, if breakout occurs then we can see upside movement, till then keep your eye on stock
Hello traders,
As always, simple and neat charts so everyone can understand and not make it too complicated.
rest details mentioned in the chart.
will be posting more such ideas like this. Until that, like share and follow :)
check my other ideas to get to know about all the successful trades based on price action.
Thanks,
Ajay.
keep learning and keep earning.

MGLHi guys, In this chart i Drew My Best Levels in MGL for Short, Observed these Levels based on price action and Demand & Supply. Don't Take any trades based on this chart/Post...because this chart is for educational purpose only not for Buy or Sell Recommendation.. Thank Q

MGL CHART ANYLYSISMgl At Daily Time Frame Stuck on Resistance which is previously acted as Major Support
If 15Min Candle can Break This Resistance and Hold To Support Will See The Big Trend In Next Session,

swing trade for short termyou can enter in this trade or you can wait for retest . target 900
time frame : 30min
follow your risk management and RRR

MGL LONGMGL LONG VIEW
Beautiful chart pattern forming rounding bottom. Formed triangle and retraced back successfully . Now expecting a good move after 900.
tgt - 964 - 1024 - 1260 with short to medium term view.
No recommendation. Just view.

IGL: On the verge of breaking outIGL
- Since Nov 28, the stock has seen some consolidation at current levels
- 21 day EMA and 63 day EMA are at 430 and 415 respectively
- Once above the red resistance zone, the stock can potentially move towards 480 / 502 levels
Depending on your risk appetite and time horizon, you can use the 21 day EMA or 63 day EMA as SL
Take care & safe trading...!!!
Like and share if you find the analysis helpful
Disclaimer
- The view expressed here is my personal view
- Past performance is not a guarantee for future predictions
- Use this for educational purpose
- Any decision you take, you need to take responsibility for the same
- It's your hard earned money. Treat it wisely
- Trade / Invest keeping in mind your trading style, goals and objectives, time horizon & risk tolerance
- if trading in F&O, understand that F&O trading involves risk
- Do take proper risk management measures
- Do your own analysis and consult your financial adviser if need be

MGL Wedge pattern on Daily TimeframeMGL likely to trade in between this wedge pattern before breakout or breakdown.
Trend mostly indicate breakout but downward retracement is expected as per RSI

IGL Short to long term upside opportunityBuy IGL above 422 for trading purpose for target 432-445-460
With sl at 414
For long term by above 422 for target 515-600
Stop loss at 398 NSE:IGL NSE:IGL1!

MGL: Technical Analysis at it's best😀MGL
Day before yesterday when markets looked difficult, charts indicated that MGL is at Support and that odds are in favor of going Long...
In 2 days the stock has rocketed and even in an overall down market this stock is holding up firmly...
Note this is not any recommendation now. Just to showcase how technical analysis can improve our trading....!!!
The original idea despite being spot on... has no Likes 😒
Do Like, Follow and Share🙏🙏
