MIDCAP NIFTY CAN HIT 22-25% Long period Head and Shoulder pattern breakout and retest and upward breakout seen in MIDCAP NIFTY suggest minimum 20-25% upside.
Midcapindex

NIFTY MIDCAPNIFTY MIDCAP formed with DOUBLE TOP with DIVERGENCE with first target 14,403, and next support at 13,995. If it didn't take supports at 13,995 we can see further downside with FINAL TRAGET 13,900.

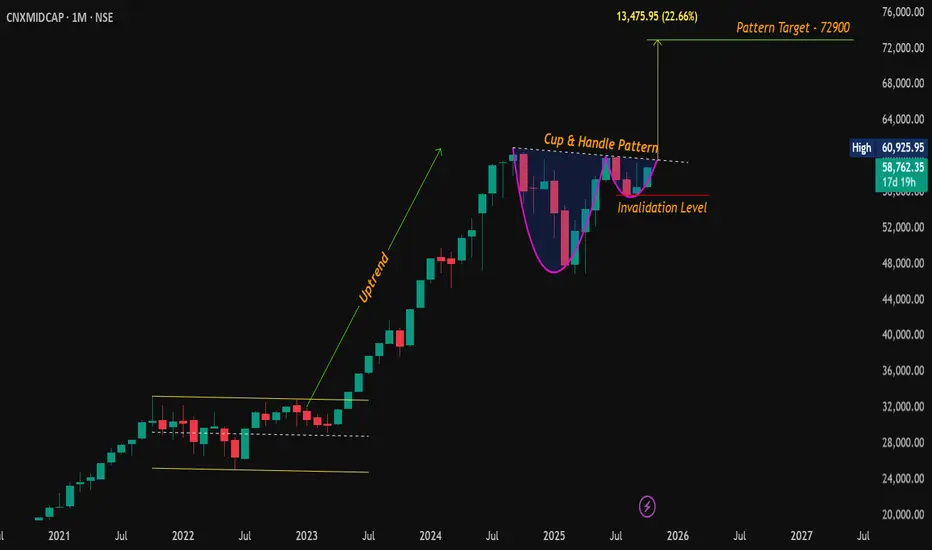
#CNXMidCap | Monthly Cup & Handle Breakout Setting Up!Classic Cup & Handle pattern is forming on the monthly chart of Nifty Mid Cap Index , signaling potential for a strong bullish continuation if key resistance levels are cleared.
🔹 CMP: 58,762
🔹 Pattern: Cup & Handle (Monthly Time Frame)
🔹 Breakout
🔹 Resistance Zones: 59,678 – 60,381 / 60,926 (All-Time High)
🔹 Support: 56,113
🔹 Pattern Target: 72,900 (+24% from CMP)
🔹 Invalidation Level: 55,660 (Monthly Close Below)
Watch for a strong breakout above 60,926 . M onthly close above this level could trigger a fresh rally into uncharted territory.
#CNXMIDCAP | #MidCap | #MidCapIndex | #CupAndHandle | #ChartPattern | #PriceAction | #BullishContinuation
📌 Disclaimer: This analysis is shared for educational purposes only. It is not a buy/sell recommendation. Please do your own research before making any trading decisions.
Nifty MidCap Index short term targets
The Nifty MidCap Select Index is currently trading at 11,198.90, down 1.69% for the session ,despite the short-term downtrend, the index recently rebounded from a key support zone (10490 – 10390) if this level holds next week then their is chances of up side .
Important Resistance Levels
Immediate Resistance1 : 11,600 – A breakout above this level may indicate further bullish momentum towards 11,800 – 11,830.
Resistance2 : 11,800 – 11,830 – A significant supply zone where sellers may step in.
Major Resistance1: 12,100 – 12,170
Important Support Levels
Support1 : 11,068.60 – 11,015.55 – The key support zone holding the index.
Major Support1: 10,390 – 10,493.55 – A strong demand zone where buyers may re-enter.
Extended Support: 10,060.20 – 9,995.05 – A strong demand zone Extension where buyers may re-enter.

Midcap ETF forming Dual Rounding PatternThe ICICI Prudential Midcap ETF is currently exhibiting a technically significant dual rounding pattern on its chart, with one smaller rounding top pattern nested within a larger, longer-term rounding formation. The 21 level has emerged as a strong support zone. A breach of this level would likely activate the smaller rounding top pattern, potentially leading to a further decline toward the 19 level.
The ETF initially displayed a bullish structure characterized by higher highs and higher lows, but has now shifted to forming lower highs and lower lows, a common early indicator of a trend reversal from bullish to bearish. This suggests that while the market is in the early stages of this reversal, it's too soon to definitively call the transition.
Volume analysis plays a crucial role in confirming price action, as volume tends to be a more reliable indicator. In the recent chart movement, a clear volume divergence was observed during the last upward move, indicating weakening buying interest. Conversely, there has been volume agreement during the recent price decline, further supporting the possibility of a bearish shift. Close monitoring of volume trends will be essential in confirming this potential reversal and avoiding any price manipulation signals.
****Nifty Midcap forming same pattern but we analyze this because we will do Price Volume Analysis***

MIDCP Bullish harmonic MIDCP, midcap nifty now Bullish harmonic pattern is found reversal possiblities are there RSI oversold with positive divergence trendline support oscillators are bullish. expecting 12100,12220,12350++

NIFTY MIDCAP Making in W pattern HourlyHello,
Indian indices fall 2 to 4% after trump oth Nifty midcap 100 spot 52700 making in W pattern if support taken then bounce upto 55000 possible RSI is oversold with positive divergence ocsillators are bullish below 52000 more panic possibilty for 51000, 50000, 48500.

Sector AnalysisHello & welcome to this analysis
In this video I have covered
Nifty Next 50
Nifty Small Cap Index
Nifty Mid Select Index
Nifty Energy Index
Bank Nifty
Nifty Metal Index
All analysis are based on the multi time frame study of Ichimoku and Harmonic Trading Patterns
Hope it helps you in identifying trend direction with support and resistance for the coming days and weeks
Best Regards

Midcap Momentum: Will Resistance Break or Bears Take Control?This chart depicts a technical analysis of the NIP IND ETF MIDCAP 150, likely with daily candlesticks. Here's a detailed breakdown:
### Key Observations:
1. **Support and Resistance Levels**:
- **R3 (Blue)**: Significant resistance near 220.82.
- **R2 (Green)**: Intermediate resistance around 215.99.
- **R1 (Orange)**: Support at 209.87.
- **S1 and S2 (Yellow and Purple)**: Further support levels at 204.00 and 199.79, respectively.
2. **200-Day SMA**:
- The blue line represents the 200-day Simple Moving Average (SMA) at 206.18, a crucial long-term trend indicator. The price is currently above the SMA, suggesting bullish momentum in the longer term.
3. **Price Action**:
- The price recently rebounded from a support zone near 204 and is now testing intermediate resistance levels.
- The formation of red candles near resistance (R2) indicates selling pressure, but a break above could indicate further upside potential.
4. **RSI Indicator**:
- The RSI (Relative Strength Index) at 39.20 is in the lower neutral zone, suggesting slight bearish momentum. However, it is rising, indicating potential recovery.
### Potential Outlook:
- **Bullish Scenario**:
- A close above 215.99 (R2) could lead to a retest of 220.82 (R3). Sustained momentum above R3 could indicate further upside.
- **Bearish Scenario**:
- Failure to hold above 209.87 (R1) might see the price revisit 204.00 (S1) or even 199.79 (S2).
### Recommendation:
- Monitor RSI and the price reaction near resistance levels.
- For a long trade, consider entering on a breakout above 215.99
- For a short trade, watch for a rejection at current levels and target supports near 204.00 or 200.
Would you like further analysis or specific trade setups based on this chart? Comment down

MIDCP nifty making Head and shoulder and near support dailyMidcap nifty index MIDCP making head and shouler pattern in daily timeframe also at crucial trendline support breaking below create more panic till 11850,11600,11380.

Nifty Midcap150 -At make or break level?Nifty Midcap is standing on a confluence of support of trendline as well as horizontal support.
22000 looks like a make or break level for Nifty Midcap.
If this support breaks, we might see a quick fall to 21650, 21480, 21300 levels.
If this support is sustained, we can expect a bounce to 22200, 22500+ levels
Keep this chart in focus for further swing trades. Fibonacci levels will be crucial now.


#CNXMIDCAP100 INDEX ANALYSISIn line with CNXSMALLCAP 100 CNXMIDCAP100 Still have some upside at least till touch of RSI trendline at this point of time. Daily candle is bearish but looking at RSI trendline line , i can see some upside left.

MIDCPSELECT INTRADAY| SWING levelsMIDCPSELECT levels to watch for today's expiry and upcoming sessions. Time frame is 1HR you can also work on 15 mins.
NOTE: I'm not a SEBI REG. Study before investing.

Mid Cap Nifty
Nifty Midcap Elliot counts shows a bullish move
If the market opens with a gap then the market may go sideways.
If market opens sideways then can expect sideways to Bullish

MIDCAP Select Analysis & Many reasons to short with Small SLWe have explained everything in the chart. Please refer to it.
Let us know your thoughts in the comment section.
Thanks,
Team Wavemoku
Disclaimer: We are not SEBI registered. The content presented here is based on our personal opinions. Conduct your own research and consult with a qualified financial advisor before making any investment decisions.

MIDCP NIFTY INDEX LEVELSMIDCP LEVELS for trading and positional based. Follow these for support/resistance and make your setup easy.
NOTE: I'm not a SEBI REG. Study before investing.

MidCap is at the crucial point. It's a (Tug of War)1) Followed by the SmallCap, MidCap is also under the strong selling pressure.
2) Currently It took the support at the trendline. If It breaks down the level of 45600 & closes below the trendline then It will lead to another 4.5% fall.
3) There's a Probability that MidCap may bounce from it's current level and lead the next uptrend.

Nifty Midcap Select Index Rising Channel BreakdownThe Nifty Midcap Select Index (NIFTY_MID_SELECT) is showing a rising channel breakdown, indicating potential bearish movement.
Breaching lower trendline - traders may consider this as a caution period until the next bullish confirmation forms.

MIDCAP MATHEMATICAL LEVELS FOR THIS EXPIRYThese Levels are based on purely mathematical calculations.
Validity of levels are upto expiry of current week.
How to use these levels :-
* Mark these levels on your chart.
* Safe players Can use 15 min Time Frame
* Risky Traders Can use 5 min. Time Frame
* When Candle give Breakout / Breakdown to any level we have to enter with High/Low of that breaking candle.
* Targets will be another level marked on chart
* Stop Loss will be Low/High of that Breaking Candle.
* Trail your SL with every candle.
* Avoid Big Candles as SL will be high then.
* This is one of the Best Risk Reward Setup.
For Educational purpose only

Bounce Back Brilliance: Riding the MIDCAP Nifty TrendlineMIDCAP Nifty is showing signs of bouncing back as it consistently finds support and resumes its upward trend along the trendline. Consider buying opportunities when it bounces off the trendline support. Keep a close eye on the trendline for continued support.

Nifty Mid Cap Index Hello and welcome to this analysis
The index has always performed in line with the Nifty except in the brief period of 2018-2020 when it underperformed.
Currently attempting to break above the rising trendline formed in the Monthly time frame with crucial support near 42000 and next resistance near 45000
Check out the outlook of the Nifty Small Cap Index from the link below
Happy Investing

Hanging Man In Nifty Midcap 100Perfect Hanging Man In Nifty Midcap 100
Sell On Any Weekly Close Below 39445
SL - 41700 ( Weekly Closing Basis )
