L&Tinfotech : double bottom breakout in progressL&T infotech : double bottom breakout in progress. Momentum and trend bullish on all timeframes .
latest daily candle is open = low bullish pattern and likely to trend up.
stop loss could be close below breakout neckline. trailing could be done on daily trendline breach and close also could be indication
for short swing trades.
Momentumstrategy

#daburindia weekly momentum at bullish support within trendline #daburindia weekly momentum at bullish support within trendline channel
weekly holding within a trendline channel since long
momentum and trend bullish on all timeframes. sector is bullish.
momentum taking support near 60 multiple times on weekly indicating a medium term range shift.

#tataconsumer :breakout from resistance with good momentum,trend#tataconsumerproducts. Short ,medium and long term momentum bullish with trend indicator showing rising in strength .
Last daily candle is a breakout wide range bullish breakout from past resistance zones with good volume making a new all time high level
and also making high high pattern In a trendline channel

#Bataindia watchlist stock for potential short term breakout#bataindia watchlist stock for potential short term breakout
all timeframes are bullish in momentum and trend.
at a 2 year old major resistance zone and daily volume spikes seen that could be attempting to breakout.
momentum showing a bounce from the support on daily after range shifted from sideways to bullish
rounding bottom on daily seen.earlier june attempt failed and so entry with tight slop loss and only after green close above resistance.
trade for short swing /short term since another resistance exit 100-200 points away

#PiramalEnterprises:rounding pattern and flag breakout candidate#PiramalEnterprises #PEL : rounding pattern seen on weekly at verge of breakout. Earlier bullish reverse divergence worked like charm to meet target.all timeframes have good momentum and trend. Flag pattern seen on daily timeframe .keep stop loss at candle on neckline and enter on confirmation only.12% up move happened on earlier post made on Aug 5th.

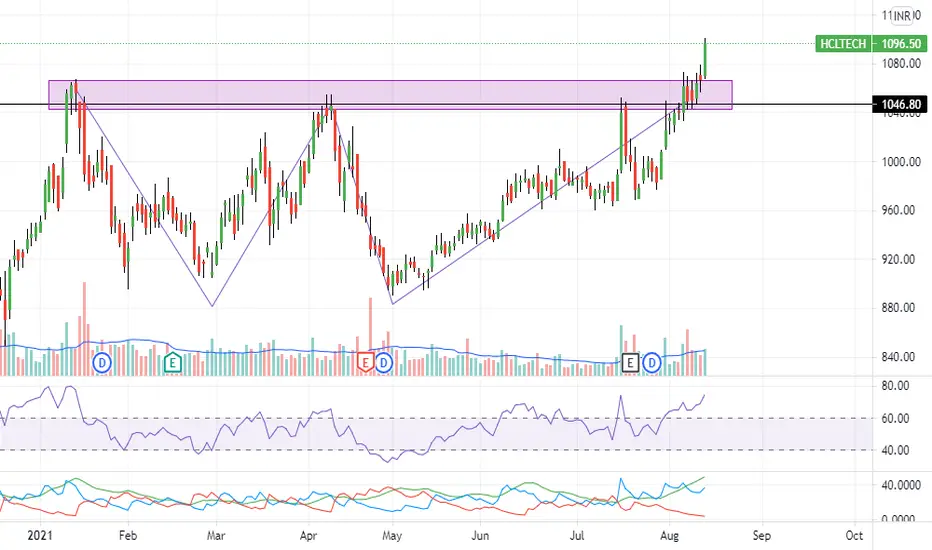
HCL Technologies : Breakout from resistance with momentum #HCLTECHNOLIGIES looks like a breakout of previous resistance after a W pattern. Momentum and trend on all timeframes looks good.Dollar beneficiary move
#deepaknitrate both momentum and trend is bullish on all TF#deepaknitrate both momentum and trend is bullish on all timeframes indicate it has more to go on upside
previous resistance zones/Fibonnacci 50 could act as support during any retracements

Sunpharmaceutical:Cup&Handle weekly breakout+bullish divergenceSunpharmaceutical : cup and handle breakout and momentum bullish reverse divergence on weekly timeframe.Sector also has similar bullish divergence

FRESH BREAKOUT IN DLF AFTER SUSTAING ABOVE RESISTANCE LEVELBUY DLF BETWEEN 350-355 SL 335 TGT 420
DLF is bullish in Monthly and Weekly and now it gave break out after sustaining above resistance level.

Contraction Near Old Supply ZonesWhenever A Stock Starts Getting Tighter Near An Old Supply Zone , It Can Be A Good Buying Opportunity.
Gati Here Started Getting Tighter Near Its Supply Zone From March 2019 In February 2021. The Contraction Was So Tight That The Stock Moved Only Between The Range Of 94.5 ( High ) & 90 ( Low ) For The Entire Week. I Went Long @ 95, The Stock Made A Big Move of 22% In the Next week and hit another supply zone at 119.4 but never came below my buy price, infact it started getting tighter again and broke through that zone too. The Story has just been repeating itself since then.

Punjab National Bank BreakoutPunjab National bank has tested the resistance zone/ supply zone multiple times. Hence the sellers are becoming weak now and buyers are getting stronger. If the buyers are able to close the price above the supply zone, the stock may show a good upmove.

Swing trade in NBCCOn weekly chart , NBCC showing a great momentum. Also, volume support is there. All targets are mentioned in the chart. SL based on your risk (2%).
Disclaimer:- This is just for learning purpose author is not liable for any loss.

CAMLIN FINE SCIENCES ( darling speciality chemicals sector)stock is has a lot of potential for growth in a very fast growing industry.(until over allocation and misallocation of capital happens by the management this industry will be very good, moderate entry barriers profit pools most likely to stay
just like WB said a shitty stock in a great industry is greater than a great stock in a shitty industry
levels are all mentioned on the chart
like the idea and follow me if you want more such ideas
cheers

Bandhan Bank is shaping up to be a good longExperimenting with Bollinger Bands here. We can see that price has closed above the UB and the bands have started to expand. With RSI just under 60 and price a smudge under 50DMA, NSE:BANDHANBNK could be a good momentum pick. Tomorrow's price action might validate the idea and give confirmation.
Given that this trade is based on momentum, an SL below today's low seems fair, with T1 being 334 and T2 being 351. Important to note the hurdle at 324.
Note: I already hold Bandhan Bank so my view may be biased.


NIFTY TRADE SETUP FOR TUESDAY Tomorrow I will trade carefully as per opening. If market opens above 14620 ..Then again I will buy on dip till market trade above 15550 -15520.
If Market opens below 15520 then I will sell on rise till 15620 . If market open between 115520- 15600 . we might see a range bound market .
Let the market set a range in 30 min and then set your trade accordingly.

IIFL Securities - Ascending Triangle Pattern BreakoutIIFL Securities has given a ascending triangle pattern breakout with breaking its all time high price of 65.5 on weekly chart.
CMP : 75.85
Target : No Target, Let your profits run as long as your trailing stop isn't hit.
Trailing Stop : 60.5 (10 weeks EMA), will go up every week.
Merits:
1. Ascending Triangle Pattern Breakout
2. Weekly closing above "All time high"
3. Increase in volume by 10 times (Crosses ATH with a weekly volume of 22mn as against an average of 2mn per week).
Happy Trading!!!

SAIL IS GOING TO BE A RAIL AGAINSAIL is creating a base again to be a bulllish RAIL ---------------------------------------->
As you can see , it has already broken its falling wedge few times(unlike JSW and TATA Steel as they are strictly following the falling wedge), also the momentum increased creating a bullish divergence. So we can expect a good spike in upcoming days.(Can be a swing/positional trade after few days)
FOR INTRADAY TRADERS( only for 31-05-2021)
1- It was totally bearish last day and CREATED A DOJI(could be a sign of reversal) as last candle (on hourly frame).
2- Also , since it came again to support, so it can jump again as momentum is increasing.
LASTLY ITS UP TO YOU WHETHER TO TAKE A TRADE OR NOT, BUT FOR A SAFER SIDE, CAN EXPECT A PROFIT OF 4-4.5 Rs per share.......
Happy Trading ..... :)

All time high has broken !!! Nifty50NSE:NIFTY
Nifty 50 Has broken an all-time high now the question is will it sustain there or get liquidated there only.
I have gone much deeper to feel the real momentum of the index whether the trend can be rideable from here or start booking profit from this point.
If you go through my previous posts, I have tried to show the approach of a practical mindset which includes more data that we cannot see or feel on the chart but very much effective to decide the probability of the trend or direction along with the momentum.
Now let's come towards Nifty50 current status. The index has given a breakout with a positive cumulative volume. If we go through the open interest data of the past one week, that the preparation of breaking the last highest point has triggered from a week back only, but the price-volume analysis of the last 2 months has shown that smart traders are still in the buying mood. It is very important that the index must trade above the 15385 to15432 range to keep this momentum up.
It was very important for the Nifty index to come out from the Top Flat channel (TFC) and which has done perfectly. You may have seen that India VIX has also substantially decreased immediately after breaking the TFC.
So, as per data and the sentiment analysis, I can see there is a probability Nifty to touch the 16000 levels very soon.
But if it breaks the 15385 levels then the 15000 levels could be the major support zone, and once again top flat situation may arise with higher volatility.
So trade safely... and let me know your views also...

High Momentum Breakout - Chambal Fertilizers- Fundamentals are strong
- Breakout at a level of 265 with heavy volumes
- Stock may retest the levels before gaining more momentum
- 265-280 can be good entry levels
- Huge momentum in the stock
- RSI showing 80, may break a bit

FDC Ltd - Cup and Handle breakout pattern- Fundamentally good stock with good results
- Cup and Handle pattern supported by volumes
- Breakout pattern
- Stock might correct to 320 levels as Relative strength index shows 77, and then might gain momentum again

Triple Digit Move In IIFL After A Weekly Inside Bar BreakawayAfter A Quick 55% Move in 3 Weeks. A very Tight Weekly Inside Bar Formed On The Chart Of IIFL. The 10 WMA Was Right Below The Price Making It The Perfect Setup. The Stock Moved 204% in 3 Months From Here After The Breakaway.
Very Fast Triple Digit Returns Were Available Here. One Good Trade !

