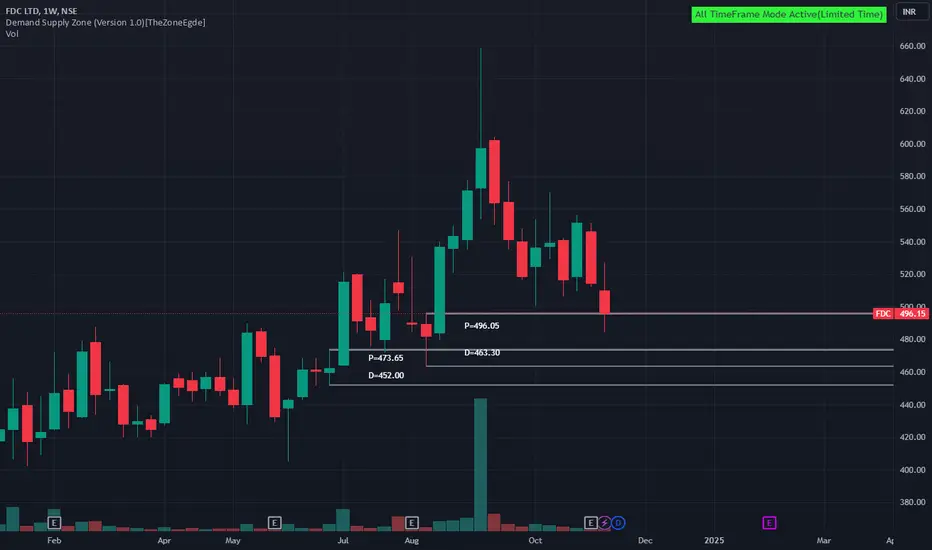
FDC Trading Above Fresh Weekly Demand ZoneFDC is currently trading at ₹496.15, slightly above its demand zone between ₹493.95 and ₹463.3, identified on 23rd August 2024. This fresh zone has not been tested yet, suggesting potential buying interest if the stock price dips back into this range. Investors may watch for a pullback, which could
Next report date
—
Report period
—
EPS estimate
—
Revenue estimate
—
19.45 INR
3.05 B INR
19.38 B INR
49.04 M
About FDC LTD
Sector
Headquarters
Mumbai
Founded
1936
Website
ISIN
INE258B01022
FIGI
BBG000GL8L82
FDC Ltd. engages in the provision of pharmaceutical business. It operates through the following geographical segments: India, USA, and Others. It involves therapeutic segments, such as, anti-infectives, gastrointestinals, ophthalmologicals, vitamins, minerals, dietary supplements, cardiac, anti-diabetes, respiratory, gynaecology, dermatology, analgesics and others. The firm's products are sold under the brand names, Electral, Enerzal, Vitcofol, Pyrimon, Zocon, Zoxan, Zathrin, Zipod, Zefu, Cotaryl and Mycoderm. The company was founded by Anand L. Chandavarkar on December 7, 1936 and is headquartered in Mumbai, India.
FDCDate 14.08.2024
FDC
Timeframe : Day chart
Remarks : At strong support trendline with confluence of 100 ema, looks good for buy.
Regards,
Ankur

FDC 49752 wik hi
Target 550,690 SL 409
This is my pre market analysis and my trading journal. Not a suggestion to buy or sell.
You are responsible for whatever you do.
Price was falling for few days and now it is trying to consolidate and move up. Price has formed a wedge pattern.

FDC | Swing Trade📊 DETAILS
Sector: Pharmaceuticals & Drugs
Mkt Cap: 6,919 cr
FDC (Fairdeal Corporation) Ltd Limited (found in 1936) is among India’s leading fully integrated pharmaceutical companies. The Company is a pioneer in the manufacture of specialized formulations, and among the world’s foremost manufa

Buy Call For FDCsymbol FDC
company fdc ltd.
type long term & swing trade
price 466.45
date of entry 07-02-2024
risk market slowdown

FDC- VCP in Making by SG GallantispatFDC- VCP in Making by SG Gallantispat
1) COnsolidation
2) Well known name
3) May breakoup

Possibility is high that it will break 8 year old resistance📈 FDC @425
✅ Possibility is very high that it will break 8 year old upside trend
✅ Resistance breakout in Daily TF
✅ Earlier RSI was in overbought zone that's why didn't sustained above but now it's perfect
✅Also taking support from lower trend
✅Strong closing in weekly TF (Hammer)

FDCDuring last 20 session, it is in consolidation period. Now it is trying to break that consolidated zone.
In my view, it will easily cross mybtarget.

FDCBUY @ 438.15 RS
TARGET @ 530 RS
BUYING CONFIRMATION: Rounding bottom
Expected returns are around 20.00 %


See all ideas
Displays a symbol's price movements over previous years to identify recurring trends.
Frequently Asked Questions
The current price of FDC is 503.55 INR — it has decreased by −1.29% in the past 24 hours. Watch FDC LTD stock price performance more closely on the chart.
Depending on the exchange, the stock ticker may vary. For instance, on NSE exchange FDC LTD stocks are traded under the ticker FDC.
FDC stock has fallen by −2.24% compared to the previous week, the month change is a 2.35% rise, over the last year FDC LTD has showed a 21.28% increase.
FDC stock is 3.09% volatile and has beta coefficient of 0.88. Track FDC LTD stock price on the chart and check out the list of the most volatile stocks — is FDC LTD there?
Today FDC LTD has the market capitalization of 81.89 B, it has decreased by −0.98% over the last week.
Yes, you can track FDC LTD financials in yearly and quarterly reports right on TradingView.
FDC LTD is going to release the next earnings report on Feb 7, 2025. Keep track of upcoming events with our Earnings Calendar.
FDC net income for the last quarter is 720.41 M INR, while the quarter before that showed 1.19 B INR of net income which accounts for −39.48% change. Track more FDC LTD financial stats to get the full picture.
FDC LTD dividend yield was 0.00% in 2023, and payout ratio reached 0.00%. The year before the numbers were 0.00% and 0.00% correspondingly. See high-dividend stocks and find more opportunities for your portfolio.
As of Dec 15, 2024, the company has 6.66 K employees. See our rating of the largest employees — is FDC LTD on this list?
EBITDA measures a company's operating performance, its growth signifies an improvement in the efficiency of a company. FDC LTD EBITDA is 3.57 B INR, and current EBITDA margin is 17.72%. See more stats in FDC LTD financial statements.
Like other stocks, FDC shares are traded on stock exchanges, e.g. Nasdaq, Nyse, Euronext, and the easiest way to buy them is through an online stock broker. To do this, you need to open an account and follow a broker's procedures, then start trading. You can trade FDC LTD stock right from TradingView charts — choose your broker and connect to your account.
Investing in stocks requires a comprehensive research: you should carefully study all the available data, e.g. company's financials, related news, and its technical analysis. So FDC LTD technincal analysis shows the sell today, and its 1 week rating is neutral. Since market conditions are prone to changes, it's worth looking a bit further into the future — according to the 1 month rating FDC LTD stock shows the buy signal. See more of FDC LTD technicals for a more comprehensive analysis.
If you're still not sure, try looking for inspiration in our curated watchlists.
If you're still not sure, try looking for inspiration in our curated watchlists.