MINDACORP - Monthly chart analysis - Multiyear breakoutThe analysis is done on Monthly TF hence price may take few weeks to several months in order to reach the targets.
Trade setup is explained in image itself.
The above analysis is purely for educational purpose. Traders must do their own study & follow risk management before entering into any trade
Checkout my other ideas to understand how one can earn from stock markets with simple trade setups. Feel Free to comment below this or connect with me for any query or suggestion regarding this stock or Price Action Analysis.
Monthlychart

PFC: Shorting opportunity on Daily TimeFramePFC is in a channel pattern on 1 moth TF since 2010.
On a Daily TF it is following a downward trend line and recently formed a bearish engulfing candle at the trend line, so it could be a good opportunity to short.
Short term target: 104 (next strong support).
Long term target: 80-85 (monthly channel support).
P.S: If market continues uptrend then we might need to look for another opportunity on this.

GOKEX | 16Yr CUP Breakout Candidate |Huge Bull Run AheadNSE:GOKEX
16 Yr Long Rounding Bottom Pattern or CUP Pattern Formation in Monthly Charts
Stock near Resistance Zone
Consistent Buying Volume & Strong Momentum
Once Breakout above resistance zone on Monthly Closing Basis
Tgt : 610 - 751- 981
However, using Fibonacci Tgt is upto 1700
SL : 315
GOKEX is major exporter and rising export demand for textile is good for this gem company

Mayur Uniquoters| C&H nd All Time High Breakout| Target 100% NSE:MAYURUNIQ
In Monthly Charts we have confirmed BO around 520
Cup and Handle as well as All Time High Breakout
Pattern Targets : 721 - 856
Beyond 856 Targets via Fibonnaci : 1075 - 1210 - 1430
SL : 440
Time Horizon : 12-24 Months
Monthly RSI>70
Continuous Buying and Accumulation since Jan2021

SPECIALITY RESTAURANTS MONTHLY CHART ANALYSIS NOV 12 2021SPECIALITY RESTAURANTS as per monthly chart analysis the stock was in continuous down trend channel and this month stock has once again moved up breaking the channel. Resistance 115 once broken then target 140 is achievable.

Lovable Lingerie Near Monthly BO | 50%-90% UpsideNSE:LOVABLE
Current Price near Breakout Neckline on Monthly Chart.
If December 2021 Monthly Closing is above 210-212 zone then BO is confirmed.
Upside : 50% - 90%
Next Targets : 253 - 293 - 382
SL : 160
Monthly RSI > 60
Selling Pressure from 382 to 30 now over.

ASTRAZENECA PHARMA - RSI breakoutPharma stocks back in action with Astrazeneca pharma coming out of it demand zone, has formed a congestion pattern in the monthly timeframe, RSI already broken out of the box. is a good option to buy and hold

PAGEIND - Breakout after 3 plus years - Investment + Swing TradeThe analysis is done on Monthly TF hence price may take few months to even couple of years in order to reach the targets.
Trade setup is explained in image itself.
The above analysis is purely for educational purpose. Traders must do their own study & follow risk management before entering into any trade
Checkout my other ideas to understand how one can earn from stock markets with simple trade setups. Feel Free to comment below this or connect with me for any query or suggestion regarding this stock or Price Action Analysis.

NETWORK18 - Breakout after 7 plus years - Monthly Chart - Swing The analysis is done on monthly TF hence price may take few months to even a couple of years in order to reach the targets.
Trade setup is explained in image itself.
The above analysis is purely for educational purpose. Traders must do their own study & follow risk management before entering into any trade
Feel Free to comment below this or connect with me for any query or suggestion regarding this stock or Price Action Analysis.

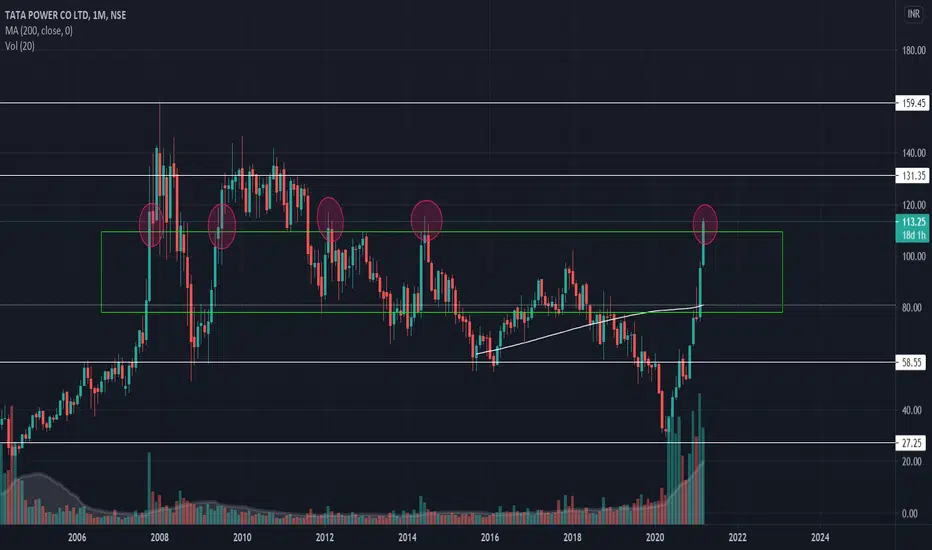
Tata Power Monthly chart Break Out from 2007 range.Analysis :-
1. 2007 old range break out on the monthly chart.
2. Monthly breakout is really strong.
3. Only things need to see the price action this whole month that it is sustainable or not. And then make Entry.
4. If it's in comes in old range then use buy om dip strategy.
5. Diploy not more than 3% to 5%.
Mahindra & Mahindra Bullish Flag Breakout M&MBullish Flag breakout in M&M after six months consolidation on monthly chart & on weekly chart as well.
Auto index also gave breakout and looks bullish on daily chart.
Resistance levels to watch is 822, 850.

breakout on monthly chartits monthly chart of Jindal stainless ltd. , breaking resistance with huge volume.

CIGNITTEC - MONTHLY PRICE ACTION ANALYSISCignittec is giving a monthly breakout of horizontal rectangle channel.
Comment your queries

AAVAS - Potential mover 🔰 Studied waited and took a good entry in this one :)
🔰 {Some info}
➼My name is Apoorv and I am a 2nd year Engineering student, I want to pursue trading as my career, and thus whatsoever setups or trades I potentially see on my charting platform, I post it here and share them with you all.
➼I hope you will love my simple analysis style.
➼Feel free to suggest your view on this as learning is earning here :)
➼I take my trades on my Zerodha account :)
➼These charts are my and only my work, my thought process, just from an educational point of view and no calls.
<<<<<>>>>>

SAIL 9 Yr MEGA BreakoutSAIL is sitting on a 9 year breakout.
Look at the volumes in the recent months.
The entire sector moved today.
This can easily give 30-40% returns
in the next few weeks.


FEDERAL Bank - Near resistance zone at monthly chartFEDERAL Bank - Near resistance zone at monthly chart
Disclaimer : All charts are purely for educational and information purpose only. Invest or Trade at your own risk.

BHARTI AIRTEL -Ascending broadening wedge pattern at monthly TF BHARTI AIRTEL -Ascending broadening wedge pattern formation at monthly TF
Always trade what you see, never trade what you feel. Make this a habit, you won't be requiring any seminar, webinar, or mentor, you will be self-sufficient.
Disclaimer : All charts are purely for educational and information purpose only. Invest or Trade at your own risk.

Long term and short term investment idea on L&T Few pointers from my analysis on L&T :
Long term view :
1.Major trendline : It has taken support on major trendline "S1" and historically whenever it has touched it the stock has gone up at least 137.06% !! So far it has rallied about 56% only ,so I believe it has lot of room and steam still left in it.
2. Fibonacci 0.5 level : has been crossed decisively with good Volume (remember this is a monthly time frame , thus indicating solid strength.)
3.RSI : Historically whenever RSI touched near 30-35 levels it has given a good bounce , same can be noticed now.
4.100 day moving average : crossed with good Volume.
Short term view :
5. It is also evident that on a daily timeframe the stock has made a bullish flag pattern and broken out of it , and now currently facing the immediate psychological resistance near 1200-1230 and immediate psychological support near 1075-1100. (check out the comments)
Conclusion : Ideally those who are looking for some good long term bet can go for it and those looking for some quick buck can make note of immediate levels and take action at their own discretion.
Personal disclosure : invested for long term.
Time frame used : monthly and daily.
Disclaimer : This idea was to just give you an insight about my own view and personal observations. Please do your own research or consult an investment advisor before doing any investment or trading.


CNXSMALLCAPSMALLCAP (MONTHLY):- SMALLCAP INDEX NEED TO CLOSE ABOVE 6200 THEN 7000+++ LEVEL COMES
STOPLOSS 5300 DCB

Triveni Turbine Fresh Impulse and start of Wave 3 Stock looks bullish with Impulse 1 and 2 completed and started Wave 3.
Break and close above 82.2 on daily chart confirms up move.
All dip towards 80-75 long opportunity Stop Loss 60/58 on daily closing basis, target 130-135 in short term.
Long term 250-270+ since fresh rally should break previous high and continue up move
Disclaimer: Small cap share so don't invest too much capital in it. Equity investment is highly Risky asset class for investment. This investment may not be suitable for all investors or analysis can be wrong so ask your financial advisor before investing.

10 Interesting Monthly Charts10 Monthly CHarts
---------------------------------
Below are the 10 charts on an intersting point in their lives.
BEML--> Testing Median
LUPIN--> Hovering on lifetime 618 FIB
TATASTEEL--> Testing Resistance/Supp Line
TATACOMM--> Testing Res/Sup Line
CEAT --> Testing Sup/Res Line
ADANI POWER--> Testing lifetime lows made 3 years ago
SHRIRAM TRANS FIN--> CHannel top edge
AMBUJA CEMENT--> Broke 9 year trendline
J&K Bank--> Testing low sup/resitance Line
PTC--> CHnnel Bottom edge
