UNIONBANK: Cup & Handle Sets Stage for UpsideThe chart for Union Bank of India Limited (NSE: UNIONBANK) shows a classic "Cup and Handle" pattern forming over a multi-year period, which is a bullish technical setup supported by steadily increasing volume and positive price action.
• The cup portion covers a deep, rounded bottom with a gradual recovery, fulfilling classic characteristics of the pattern.
• The handle is a minor consolidation after the uptrend, with no deep pullback, which matches a bullish setup.
• Volume increases during the breakout, confirming upward momentum as per technical analysis norms
• The moving averages are trending up, further reinforcing the bullish sentiment.
Entry Target:
The ideal entry is around the breakout level of the handle, which is close to ₹148-150 per the latest monthly close shown on the chart, with a swing target of 160 on immediate basis.
Breakout Level:
The breakout occurs as price closes above the handle’s resistance, which aligns with the ₹160-162zone and provides confirmation. For better risk to reward ratio buyout above 162 levels is suggested.
Investor Targets:
• Target-1: ₹205, which is the first target based on the pattern's height projection.
• Target-2: ₹250, the next logical resistance level using the pattern’s depth and typical bullish extension.
• Price Target: ₹300-304, which is a long-term target if the momentum sustains and the bullish breakout persists.
Stop Loss:
• Place a stop loss below handle support, marked at ₹108 o n a closing basis to manage risk.
📌 Thanks a ton for checking out my idea! Hope it sparked some value for you.
🙏 Follow for more insights
👍 Boost if you found it helpful
✍️ Drop a comment with your thoughts below!
Monthlystructure

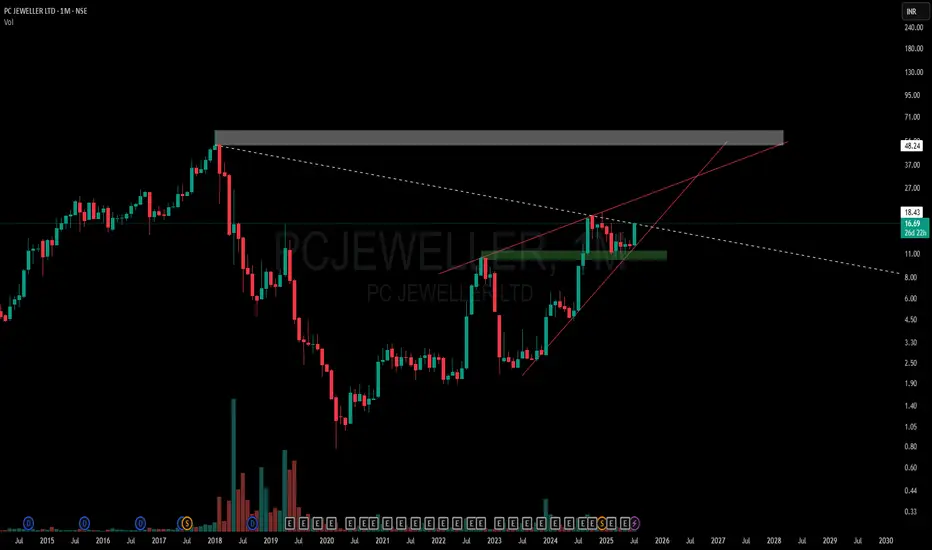
PC Jeweller at a Make-or-Break Zone: Structure Never Lies🔸 A long-standing Multi-Timeframe Compression Trendline (white dotted) remains active, and price is currently retesting this zone.
🔸 The grey supply zone marks the all-time high resistance, while the green box shows a recent zone that flipped from supply to demand — supported by a strong base formation.
🔸 A hidden structural pattern is emerging —
• One line forming a (HL - Hidden Line ) acts as rising resistance
• The other trendline offers solid ascending support
🔸 Price is getting tighter within this converging structure, while respecting historic levels.
📌 No forecast here — just highlighting key levels and behavior for context-driven traders.

Atul Retest Done Now ready to flyAtul has recently given monthly breakout. and this month it has tested that breakout. now it is ready to cross previous ATH and can reach to 12000+ in next 1 year.
I am very bullish on ATUL

LIKHITHA👉 LIKHITHA
👉 Short Term Holding
👉 Buy Above : 340/351 { If price comes 300/315 Then add more quantty }
👉 Target : 400/465
👉 sl update later
👉 weekly breakout with good volume

Flag pattern in monthly chartWhat is resisting to fedbank for going up?
I am looking for big up move pending for this share as monthly chart activated flag pattern.
Strong support 120.
Target : OPEN
SL : 118
Risk is yours and Reward is too yours.
Time Frame : 1 to 3 years, or more than it for wealth creation

Amazing swing trading idea for 12 January Markets I daily make educational content videos for swing / positional trading

RattanIndia Ent Ltd Ascending Triangle breakout RattanIndia Ent Ltd Ascending Triangle breakout on monthly timeframe. Entry at breakout candle high and stoploss at recent swing low.

4 Potential Monthly time frame stocks for 1 December I daily make educational content videos for swing / positional trading

CAMS LongFor Educational Purpose..
#CAMS IS READY TO BUY LONG
Long Above - 2360-2375
SL - 2200 (6%)
Target - 2450, 2550, 2650, 2750...
Thank you

ITI triangle pattern breakoutITI has broken out of Symmetrical triangle pattern on monthly time frame. Entry above breakout candle high and stoploss will be the recent swing low or for safe traders the stoploss will be the breakout candle low.
Entry-214
SL-87.25
Safe traders SL-118.65

ITI bullish breakout monthly chart resistance trendlineBullish View
SL : 116.80
Target : 161.25, 199.6+++
Risk is yours and Reward is too yours totally

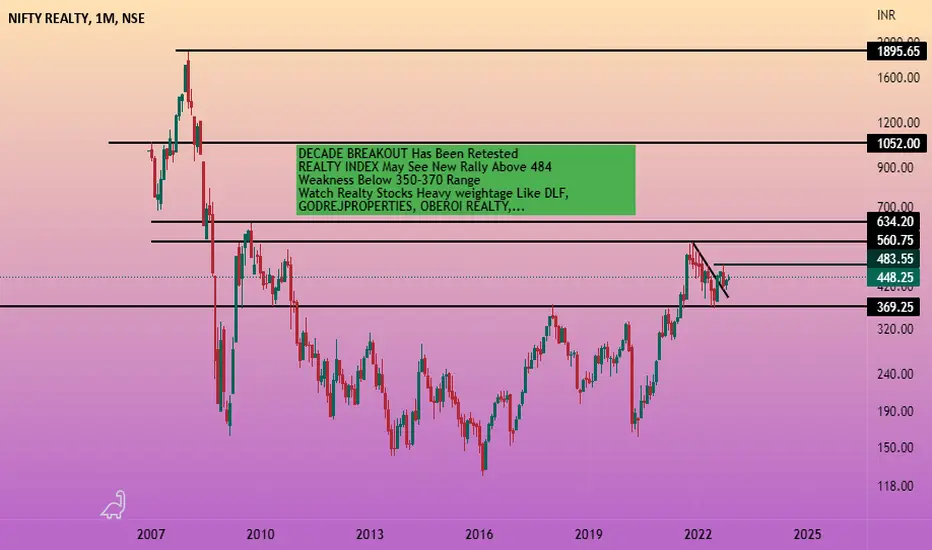
Nifty Realty Long term trend analysisThe nifty reality is the long term consoldiation phase this time the index is the brackout & than the pull back, 510 is support level and above 600 is bullish level

NIFTY -- 3 BLACK CROWS vs MORNING STAR Chart patterns looks interesting from both bull and bearish point of view
REASONS
BEARISH VIEW
1. 3 Black crows (perfect closing) with rise in volumes ( www.tradingview.com)
2. February monthly candle looks like BREAKDOWN candle with low tested the next month
3. Weekly H&S pattern in progress
4. Bullish flag Breakout candle (october 2022 candle) low got tested....sign of bears strength
BULLISH VIEW
1. Overall it is in uptrend(making higher highs and higher lows)
2. Morning star pattern (www.tradingview.com)
3. DAILY time frame Inverted H&S pattern given Breakout
4. April 2023 candle looks like a breakout candle (volume only concern)
Let's wait and watch whether it is bulls or bears turn !!!!
NOTE- Just Sharing my view....not a tip nor advice!!!!
- mmjimm

IDFC FIRST BANK - LongIDFC Fist bank is moving up after building base. It will soon make a new ATH. Fundamentally sound as well.


IDFC Limited Fresh BreakoutThis is massive: IDFC Limited is coming out of a very very long consolidation. Keep a Stop Loss at 82 and go long for the medium to long term. Do not miss this big breakout.
ILong

#GMRINFRA MONTHLY STRUCTURETrade Or Invest Wisely.
We Can Just Predict.
Disclaimer: I am not a SEBI registered advisor, so before entering on my view please ask your SEBI registered advisor. Profit is your and loss is yours.
Please like and share if you agree with the idea.

Is NIFTY REALTY ready for another bull run??Trade Or Invest Wisely.
We Can Just Predict.
Disclaimer: I am not a SEBI registered advisor, so before entering on my view please ask your SEBI registered advisor. Profit is your and loss is your.
Please like and share if you agree with the idea.
Time To Invest In PVT BANKS The chart is showing good uptrend on MTF
IF THE TREND continues we can Invest In Private Banks
NSE:NIFTYPVTBANK

REXNORD ELECTRONICSHighest volume ever traded for the stock in the month of Oct,2022. Operating margins are v.good. An uptrend has begun for the stock.

trendline Trading: SudarshanNSE:SUDARSCHEM is again taking the support at the monthly timeframe trendline.

IS EMAMILTD READY FOR ATH? BULLISH.
INVEST OR TRADE wisely.
WE CAN JUST PREDICT.
Disclaimer: I am not a SEBI registered advisor, so before entering on my view please ask your SEBI Registered Advisor. Profit is your and loss is yours.
