MOTILALOFS - LongIn this chart, price has formed a lower low near the support zone, but RSI has made a higher low. This is called positive divergence and it shows that selling pressure is weakening even though price dipped. It often appears near the end of a down move.
Near the same area, a Morning Star pattern is visible. First, there is a strong red candle showing panic selling. Then a small candle appears, showing indecision. Finally, a strong green candle closes well into the body of the first red candle, indicating that buyers are stepping in.
What makes this setup more interesting is that it is forming at support, with high volumes, and along with RSI divergence. When price, volume, candles, and momentum align like this, it increases the chances of a short-term reversal or a relief rally.
This is for educational purposes only and not a buy or sell recommendation. Markets involve risk, and always use proper risk management before taking any trade.
Morning Star

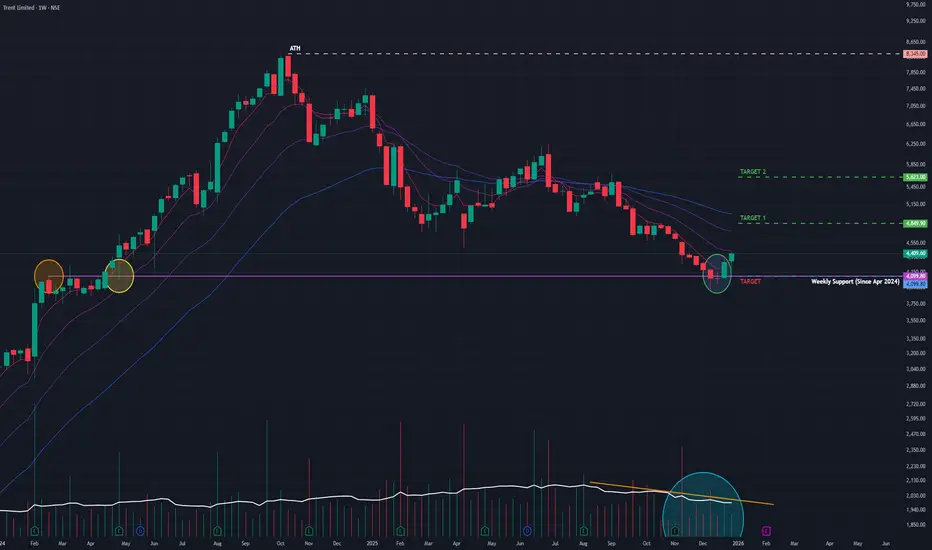
Trent (W): Bullish Reversal, Trend Reversal at Major SupportTimeframe: Weekly | Scale: Logarithmic
The stock is staging a classic reversal after a brutal 2-month correction. The "Morning Star" and "Hammer" combination at the 200-day EMA equivalent support signals that the "Panic Selling" is over and "Smart Money" accumulation has begun.
🚀 1. The Fundamental Catalyst (The "Why")
The reversal is driven by a shift in market perception:
> Valuation Comfort: After correcting ~50% from the top, the stock's valuation has cooled off significantly, attracting long-term institutional buyers who missed the earlier rally.
> Q3 Expectations: Investors are positioning for strong Q3 FY26 numbers, driven by the heavy wedding season demand in December, which directly benefits Westside and Zudio sales.
📈 2. The Chart Structure (The Complex Bottom)
> The Floor: ₹3,865 – ₹4,100 zone was a resistance in early 2024 and has now flipped to become a rock-solid support (Polarity Principle).
> The Pattern:
- Week 1 (Dec 8): Formed a long-legged Doji/Hammer at support (Stopping Volume).
- Week 2 & 3: Followed by a Morning Star formation (a bullish reversal pattern).
- Current Action: The confirmed Hammer this week shows that every dip is being bought aggressively.
📊 3. Volume & Indicators
> Volume: Volume was low during the drop (weak selling). The recent uptick in volume on bullish candles confirms Accumulation .
> RSI: The Weekly RSI turning up from the "Oversold" zone (near 30-40) is a high-probability buy signal in strong uptrends.
🎯 4. Future Scenarios & Key Levels
The stock is primed for a relief rally that could turn into a new trend.
> 🐂 Bullish Targets (The Recovery):
- Target 1: ₹4,850.
- Target 2: ₹5,625
- Blue Sky: If it clears ₹5,625, the structure shifts back to a full bull run targeting ATHs.
> 🛡️ Support (The "Must Hold"):
- Immediate Support: ₹4,100 . The "Shoulder" of the reversal pattern.
- Stop Loss: A close below ₹3,850 would invalidate the Morning Star and suggest a deeper fall to ₹3,400.
Conclusion
This is a Grade A Reversal Setup.
> Refinement: The structure is "Oversold Bounce" turning into "Trend Reversal."
> Strategy: This is an ideal entry point. Accumulate near ₹4,200–4,300 with a stop at ₹3,850 for the ride back to ₹4,850+ .
Morning Star in meesho Can give good returns in less time
stay invested with proper stoploss and mentioned target for low risk players
Can go beyond the target

#UNIVPHOTO: Reversal Alert at Falling Channel Midline!CMP: 286
UnivPhoto found support ✅ & bounced strongly off the mid-line of the falling channel (245–266 zone), forming a textbook Morning Star on the weekly chart — a classic bullish reversal! ⭐️🔥
Now testing key resistance 310–337 + downtrend line. A breakout could fuel a rally to 484 → 747/818 → 988 (ATH) 🚀🚀
Could this be the end of the multi-year downtrend? Watch closely! 👀✨
#UNIVPHOTO #MorningStar #CandleStickPattern #PriceAction #LongTerm #Investing
📌 #Disclaimer: This analysis is shared for educational purposes only. It is not a buy/sell recommendation. Please do your own research before making any trading decisions.

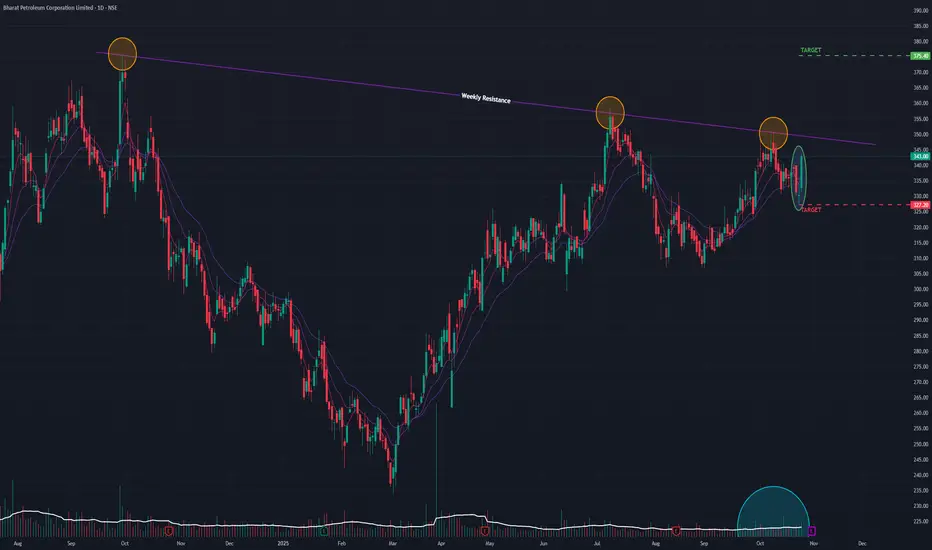
BPCL (D): Forms Bullish MorningStar, Challenges Major ResistanceAfter reversing from a short-term downtrend, BPCL (Bharat Petroleum Corporation Ltd) has flashed a powerful bullish signal. However, this newfound momentum is now running directly into a major, long-term resistance trendline that has capped its progress, setting the stage for a critical battle.
The Bullish Setup: A Morning Star at Support
Today's price action (Monday, October 27, 2025) was highly constructive for the bulls:
- Price & Volume Surge: The stock rallied +3.80% on a strong volume of 11.77 million shares .
- Classic Reversal Pattern: This move completed a "Morning Star" candlestick pattern . This is a classic three-candle bullish reversal pattern that often signals the bottom of a downtrend and a new shift in momentum.
Broad-Based Technical Strength
This bullish pattern is strongly supported by a powerful alignment of indicators across all major timeframes (Monthly, Weekly, and Daily):
- Short-Term EMAs: All three timeframes are in a bullish Positive Crossover (PCO) state.
- RSI (Relative Strength Index): The RSI is also in a rising trend on all three timeframes.
This multi-timeframe alignment indicates that the underlying momentum is broad, synchronized, and strengthening.
The Immediate Hurdle: Long-Term Resistance
Despite these bullish signals, the stock is now positioned less than 2% below a major long-term resistance trendline formed since its All-Time High. This line represents a significant historical barrier for the stock.
Outlook and Key Levels to Watch
The stock is at a clear "prove it" moment. The outcome of the battle at this resistance will likely determine the next major move.
- Bullish Breakout Scenario: A decisive close above the long-term resistance on high volume would confirm the breakout and validate the Morning Star pattern. This would signal a continuation of the new uptrend, with a potential next target of ₹375 .
- Bearish Rejection Scenario: If the stock fails to breach this resistance and momentum fades, it could be rejected. The first key support level would be the bottom of the Morning Star pattern, around ₹325 .
In conclusion, the price action in the coming days is critical. All eyes should be on this key resistance level for either a confirmed breakout or a rejection.
Whirlpool (W) - A Bullish Reversal Faces Its First Major testAfter a significant downtrend, Whirlpool of India is now exhibiting strong signs of a bullish reversal, highlighted by a classic candlestick pattern and a powerful weekly surge. However, it has now arrived at a formidable resistance level that will determine if this new momentum can be sustained.
The Bullish Reversal Signals
The foundation for this potential turnaround has been building systematically:
- Higher Lows: The stock has begun forming a pattern of Higher Lows , indicating that selling pressure is abating and buyers are stepping in at progressively higher prices.
- Morning Star Pattern: Crucially, a Morning Star candlestick pattern recently formed at a key support trendline. This is a classic and reliable three-candle bullish reversal signal.
Last Week's Explosive Confirmation
The bullish reversal signal was powerfully confirmed by last week's price action:
- The stock surged by an impressive +18.38% for the week.
- This move was supported by a high volume of 14.62 million shares .
- This single week's advance erased the losses of the previous five weeks , signaling a dramatic and decisive shift in market sentiment.
This renewed strength is supported by a rising Relative Strength Index (RSI) on both the Monthly and Weekly timeframes.
The Key Hurdle Ahead
The primary obstacle for the bulls is a strong horizontal resistance trendline that has been in place since May 2025. This level has successfully rejected several previous rally attempts, making it a proven barrier.
Outlook and Key Levels to Watch
The price action in the coming week will be critical, as it will reveal the outcome of the battle between the new bullish momentum and the established resistance.
- Bullish Scenario: A decisive breakout above the horizontal resistance on high volume would confirm the reversal and clear the path for a potential move towards the ₹1,700 level.
- Bearish Scenario: If the stock fails to breach this resistance and momentum fades, it could be rejected and pull back to test its primary support at ₹1,146.
In conclusion, while all signs point to a powerful bullish reversal, confirmation now requires a successful break of the key overhead resistance.

BRITANNIA INDUSTRIES LTD. – INTRADAY ZONE ANALYSIS📈 BRITANNIA INDUSTRIES LTD. – INTRADAY ZONE ANALYSIS
📆 Date: July 1, 2025 | ⏱ Timeframe: 15-Minute Chart
🔍 Educational Breakdown – For Learning & Study Use Only
________________________________________
🔹 Price Action Zones
🔴 Top Range (Resistance): ₹5869.50
🟢 Bottom Range (Support): ₹5721
⚪ Neutral Zone: Between ₹5732 – ₹5804 (No clear directional bias until breakout from either zone)
________________________________________
🧩 Chart Pattern: No
There’s no prominent chart pattern (e.g., flag, wedge, triangle) seen in the current snapshot. This is primarily a demand-supply structure with price action analysis.
________________________________________
🔁 Reversal Candlestick Patterns:
🔴 Top Range: No textbook reversal candle observed yet. However, the previous rejection from ₹5822–₹5804 still makes this zone valid for bearish observation.
🟢 Bottom Range: ✅ Morning Star pattern identified near ₹5721.
This is a strong bullish reversal pattern indicating potential buyer strength emerging from the demand zone.
________________________________________
🧠 1. Trade Plan (Based on Reason and Logic)
🔼 Bullish Trade:
Idea: Go long if price retests ₹5732–₹5721 and holds with bullish confirmation (preferably another higher low or volume spike).
Stop Loss: Below ₹5715
Risk-Reward: 1:1 | 1:2+
Logic: Presence of a valid Morning Star reversal at demand zone suggests buyer strength and potential upside toward ₹5800+.
________________________________________
🔽 Bearish Trade:
Idea: Short if price rallies to ₹5822–₹5804 and shows rejection (bearish wick, reversal candle, volume drop).
Stop Loss: ₹5827.25
Risk-Reward: 1:1 | 1:2+
Logic: Previously reacted supply zone with strong rejection. If tested again without volume confirmation, short setup is valid.
________________________________________
📦 2. Trade Plan Based on Demand/Supply Zones
🟥 Supply Zone: ₹5822 – ₹5804
SL: ₹5827.25
Plan: Enter short only if price rejects the zone again with bearish confirmation.
Risk-Reward: 1:1 | 1:2+
🟩 Demand Zone: ₹5732 – ₹5721
SL: ₹5715.60
Plan: Enter long if the zone holds, ideally using the Morning Star as confirmation.
Risk-Reward: 1:1 | 1:2+
________________________________________
📌 Disclaimer
This analysis is shared for educational and study purposes only. It does not constitute investment advice. The author is not SEBI-registered. Please consult a SEBI-registered advisor before making trading decisions. Always use proper risk management and trade only with confirmation.
________________________________________
💬 Comments
What’s your view on Britannia?
Will the Morning Star at the demand zone lead to a reversal, or will supply pressure dominate again?
Drop your thoughts and chart setups below 👇
________________________________________

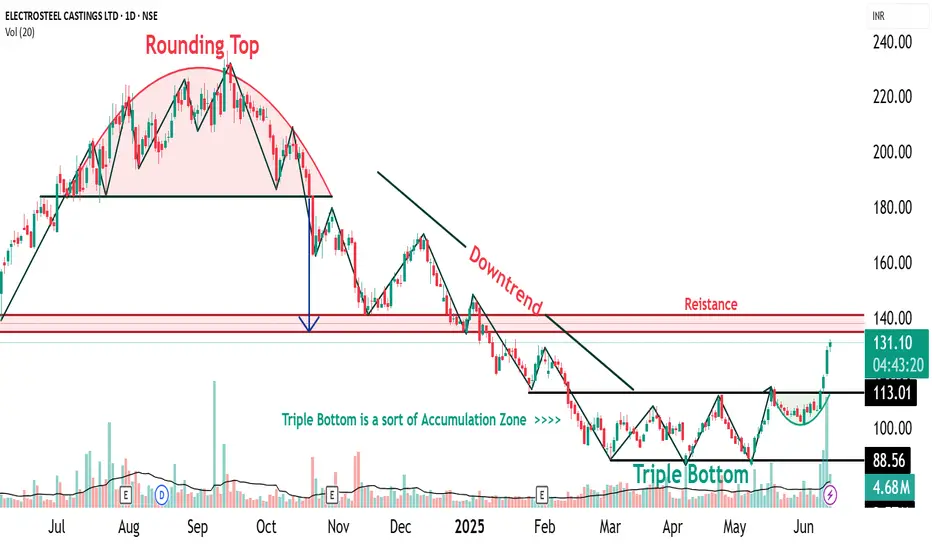
ELECTCAST Triple Bottom Pattern🔍 1. Understanding the Triple Bottom
The Triple Bottom is a classic bullish reversal pattern that typically forms after a prolonged downtrend or consolidation phase. It signifies strong buying interest at a consistent support level, leading to three distinct price lows (or “bottoms”) occurring near the same price zone.
📌 Key Characteristics:
Formation Time: Typically spans 2–6 months
Touchpoints: Three distinct lows formed at or near the same support level
Pattern Zone (for ELECTCAST): ₹87 – ₹88
Trade Entry: Entry is typically considered on a breakout above the neckline, which is the horizontal resistance connecting the interim highs between the bottoms. In this case, a breakout confirmation would be around ₹96.
Stop Loss (SL): Just below the third bottom, e.g., ₹85
Target: Based on pattern depth projection, conservative ₹104, aggressive potential up to ₹120–₹140, once momentum sustains
📉 2. Triple Bottom Formed at ₹87–₹88 Zone
Electrosteel Castings has tested the ₹87–₹88 level three times, showing that this price zone has acted as a strong accumulation support. The repeated defense of this level suggests significant buying interest by institutional players or informed investors.
1st Bottom: Initial rejection near ₹88
2nd Bottom: Retest with similar rejection zone
3rd Bottom: Confluence with bullish reversal candlestick (Morning Star)
The pattern is visually symmetric and clean, enhancing its reliability.
At the third bottom near ₹87, a Morning Star was observed, marking the first visual confirmation of bullish reversal. This adds significant strength to the pattern because the third bottom often acts as a psychological pivot point, triggering buying from traders watching for a reversal.
📈 3. Higher Top – Higher Bottom Structure Emerging
Following the Morning Star, the stock has started forming a higher bottom and higher top structure—a fundamental trait of an uptrend. However:
🟡 Caution: One more higher bottom formation is required to confirm the start of a sustainable uptrend.
Once the uptrend is firmly established, a close above ₹140 will act as a major breakout signal, potentially propelling the price toward new 52-week highs or an all-time peak.
🧠 4. Accumulation Zone and Triple Bottom – The Relationship
An Accumulation Zone is a price range where informed investors quietly accumulate shares over a period, usually when a stock is undervalued or consolidating.
🔗 Connection to Triple Bottom:
The Triple Bottom pattern often forms within the Accumulation Zone
Each dip to the support level attracts buyers, revealing hidden demand
The formation acts as a transition from accumulation to markup phase
The breakout from the Triple Bottom signals the end of accumulation and the start of an uptrend
Hence, the Triple Bottom is not just a technical pattern, but a visual representation of accumulation dynamics playing out.
📝 Disclaimer
This report is intended purely for educational and training purposes. It is not a recommendation to buy or sell securities. Always conduct your own research or consult a certified financial advisor before making trading decisions.
Fino payment bank is on bullish reversal mode.Fino payment bank is on bullish reversal mode.
As per chart it forms double bottom pattern with divergence and also showing confirmation of morning star on monthly chart.
It may test level 444 soon, 80% returns.

RCF is in bullish mode.RCF is forming evening star candle stick pattern on monthly chart.
As per chart it may test 240 soon as it is previous high level.
Returns around 78%.
As per report upcoming monsoon session will be better than expectation.
It is in Demand zone can long it for next 2-4 months.

Coforge-A perfect watchlist stock!Coforge is an IT services company providing end-to-end software solutions and services and is among the top-20 Indian software exporters according to Screener data. Stock has give 20% compounded sales growth in last 5 years which is quite remarkable.
Hence, It can be a good stock to be kept in watchlist for medium to long term.
Stock had given breakout of cup and handle pattern in weekly time frame and is now retesting the same.
Stock has formed a kind of morning star pattern at the retest support zone. Need to watch if it sustains above this zone.
As you can see, retest zone also coincides with 50% fib retracement which makes it even stronger.
If we see good buying in this stock from here, we can see ATH levels soon and even bigger levels in coming years.
However, If stock goes below 61.8% retracement, it is not advisable to hold.

HINDOILEXP - Triangle Breakout A short triangle pattern has been forming since October 2024, and today it broke out decisively with a strong bullish engulfing candle on the daily timeframe. Additionally, a morning star candlestick pattern is evident on the weekly timeframe, reinforcing the bullish outlook.

GAEL - Price near Major Support lineThe price has been consolidating since 2022 and is currently trading near a key support level around the 110 range. Previous pullbacks near this support level, as indicated by the green arrows, have shown significant reversals. Currently, a morning star candlestick pattern is forming near the support zone, suggesting potential bullish momentum. However, confirmation of the pullback will require waiting until this weekend's close.

GSFC - Trendline breakout and Good Morning star candle formationThe price has been consolidating since March 2024, respecting the 188 range on the daily timeframe. Last week, it broke out of the trendline within the wedge. On the weekly timeframe, the candlestick formation resembles a morning star, which is a positive signal. We can expect the price to reach the resistance line of the wedge, around 288 INR. This setup is suitable for swing trading.

BALMLAWRIE - Wedge formation and Morning starThe price has been consolidating since January 2024, forming a wedge pattern. Recently, a morning star candlestick formation has appeared, which could be considered as a potential signal. However, it might be better to wait for a trendline breakout for additional confirmation.

BEML - Price at support line and Morning star formationPrice respect the black color trendline since May 2023 and it remains in 3700 for quite some time. Also, it forms morning star previous week in Weekly Timeframe. We can have stoploss at 3679 if it closes below that line in weekly timeframe.

CGCL - Breakout and Monring StarPrice consolidate in 185 range since July 2023 and it breakout the black color trendline wtih good volume and greend candle looks good in weekly timeframe until today. We can expect short rally in this stock with stoploss at 185.

CREDITACC- Price at support line forming Morning StarThe 850 range has been a significant support level for this stock since 2020. After a decline from its all-time high of 1750 to the 850 range, the price is now forming a Morning Star pattern on the weekly timeframe. An entry opportunity is available only on Friday if the green candle formation is good without long wick, with a stop-loss placed below the hammer candle.

TATACONSUM - Morning star near supportline900 Range acting as resistance line since 2021 and it breakout on October 2023 and need to act as support. Now price returns to same range (900) and formed Good Morning Star structure near that line in daily time frame.

Silver Commodity - breakout and retestSilver near support line and it formed hammer candle yesterday in day timeframeand formed Morning star in 4 hour timeframe.

VERANDA - Breakout and RetestPrice breakout triangle and came back inside the triangle and it formed hammer like candle now (Weekly Timeframe). We should consider entering a trade only if a strong green candle forms in the next session. On the daily timeframe, it appears to be forming a morning star-like structure.

CENTRUM CAPITAL - Have this stock in your RadarPrice respects red color resitance line from 2018 and the price is near the resistance now. Candlestick formed monring star in daily timeframe and it is near short term support line. Also, if it breaks the resistance we can expect more returns.

Morning Star at several Fib clusters in HINDPETRO Wave C of Flat correction has fulfilled the rule of equality (Wave A and Wave C are equal).
There is also a Fib level of fib retracement of the previous impulse at this level.
We can also see the Morning Star pattern forming at this cluster.
This suggests a high probability of a buy trade in HINDPETRO .
Stop-loss for this trade can be put below 61.8%, i.e., around 360 level.
This analysis is for educational purposes only.
