#ADANIPOWER – Double Top Danger Zone!📉⚡ #ADANIPOWER 🚨
ADANIPOWER has formed a monthly double top 🔝 near the 179–183 (ATH) zone and is now slipping toward its rising trendline 📉
Price is also trading inside the September monthly candle (182.70–120.00). MCB or sustained close below 120 will signal major weakness ⚠️👇
If selling continues, price may head toward 112.50–124, 92–96 , and the breakout retest supports at 83–87 .
Bulls must defend the trendline to avoid a deeper correction 🛡️🔥
Resistances: 151.20 / 179–183 (ATH)
#ADANIPOWER #PriceAction #DoubleTop #ChartPattern #InsideBar #CandlestickPattern
📌 #Disclaimer: This analysis is shared for educational purposes only. It is not a buy/sell recommendation. Please do your own research before making any trading decisions.
Motherbar

Inside Bar Reloaded: 5 Years of Silence Before the Storm?🔍 #OnRadar
#SagarCem (Sagar Cements Ltd.)
Inside Bar Reloaded: 5 Years of Silence Before the Storm?
CMP: 264
📊 Technical Structure (For Educational Purposes Only):
The stock has formed a repeating #InsideBar pattern, a price action setup often observed during consolidation phases.
🔄 Pattern History:
📍 Previously, the stock consolidated for 9 years within a defined Inside Bar range (also called the #MotherBar ) before giving a +240% breakout move .
📍 Currently, it's again consolidating for the past 5 years within a similar Mother Bar structure.
🔑 Key Levels:
Inside Bar Range: 128 – 319
Breakout Level (Above Mother Bar): 319
Pattern Projection (If Breakout Happens): ~510 (Range Projection)
📎 Observation Note:
While history doesn’t always repeat, price structures like these are closely watched for signs of momentum post-breakout.
⚠️ Disclaimer: This is not a buy/sell recommendation. Shared strictly for educational and observational purposes. Consult your financial advisor before making any investment decisions.
#TechnicalAnalysis | #ChartPatterns | #InsideBar | #MotherBar | #PriceAction | #LongTerm

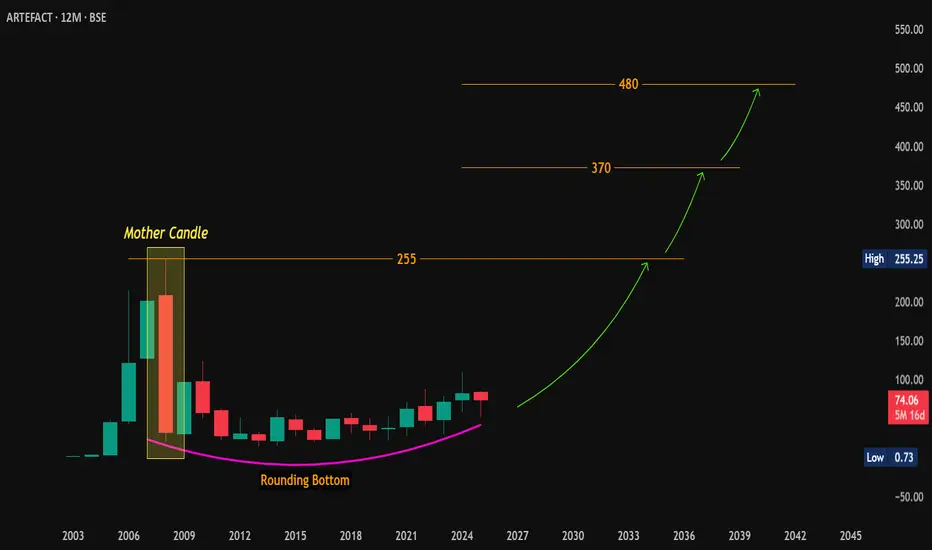
#Artefact – 17Y Pattern in Play | Big Base Forming?🔎 #OnRadar
📌 #Artefact (Artefact Projects Ltd.)
CMP: 74.06
📈 Technical Outlook (Yearly Chart):
Stock has been consolidating within a large #MotherBar formed in 2008, with a range of 255.25 – 21.05.
Currently displaying a classic #RoundingBottom formation on the yearly timeframe — a long-term bullish pattern indicating accumulation.
🎯 Potential Upside Levels (Post Breakout):
Rounding Bottom Target: 255 (approx.)
MotherBar Breakout Targets (on closing basis above ₹255.25): 370 / 480+
📌 Note:
This is a technical observation and not a recommendation. Please consult your financial advisor before making any investment decisions.
#LongTerm | #TechnicalPatterns | #MotherBar | #RoundingBottom | #ChartAnalysis
Amazing swing trading idea for 11 January Markets I daily make educational content videos for swing / positional trading

VIEW:- BULLISHCMP 880
Weekly chart
1) has got W pattern
2) with v pattern in first leg of W
Daily chart
1) double bottom
2) 12candles motherbar
3) above 50 moving average
4) postive divergence
5) bullish jackpot pattern
6) multiple v pattern
support 825-800
can come near 860 too
resistance 1050+

Bullish on Banks with Logic for 5 September Markets I daily make educational content videos for financial markets.

Target 1 and 2 achieved in Ambujacem | 8% mover This idea is a follow-up to Ambujacem
You can check the Link to Related Ideas ( Detailed analysis done in 15th Aug Video )
Disclaimer: The information provided is for educational purposes only. Our intention is not to give any financial advice, don't take any decision without consulting your financial advisor.

Magic setup worked and Stocks for 29 july I daily make educational content videos on financial markets

Silver Price action and RSI study Silver Making multiple supportive nodes -> 1) Making it weak 2) Might take support to ( thus making it a tradable area )
Learning Pointers
>> Pattern here is Descending triangle
>> Time frame here is Weekly
>> Candle position -> Mother bar : Inside bars on multiple weeks
>> Rsi telling about Divergence of price and relative strength ( Rsi making higher lows, meaning it is bullish )
>> Price making same lows
>> Price taking rest at 150dema, can combine itself with 200dema too in near future on W charts

Make or Break Level for Our Markets | Tata Motors and more I daily make educational videos on finanical markets
Above video is based only on Price action
