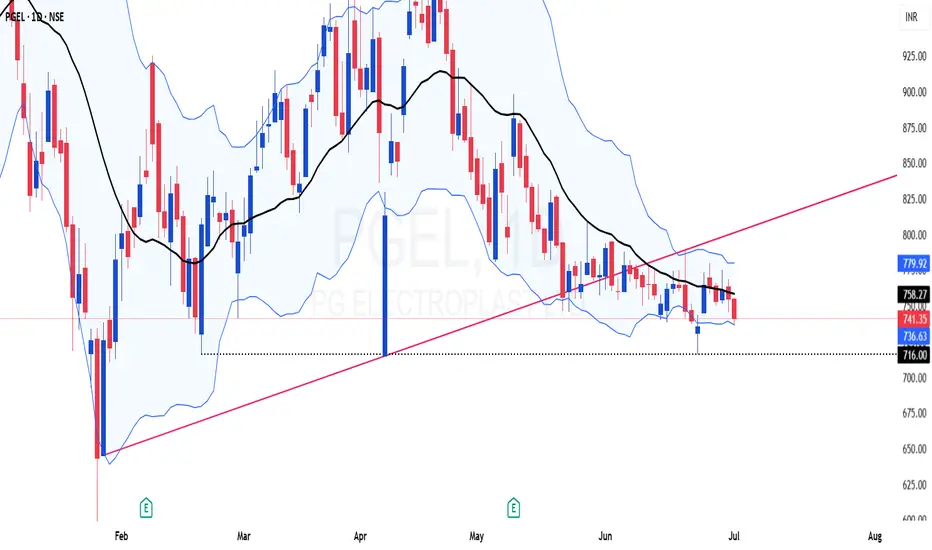
BB Squeeze in PGEL - Range expansion is due anytimePrice has been consolidating for a long time at around the 200 DEMA.
Bollinger Band is getting squeezed day by day and is due for a range expansion soon.
Price is trading below the cloud and conversion line
My Take: I believe that the range would expand on the downside, with a stop of hourly close above 750
P&F Chart open counts cluster is at 700-710
Disclaimer: I am not a SEBI registered Analyst and this is not a trading advise. Views are personal and for educational purpose only. Please consult your Financial Advisor for any investment decisions. Please consider my views only to get a different perspective (FOR or AGAINST your views). Please don't trade FNO based on my views. If you like my analysis and learnt something from it, please give a BOOST. Feel free to express your thoughts and questions in the comments section.
Moving Averages
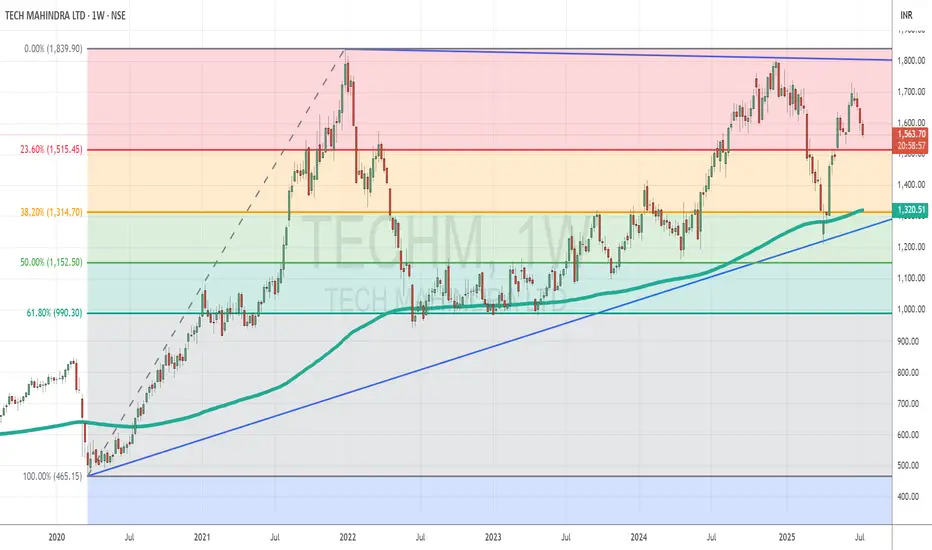
Tech Mahindra Consolidates in a Wedge After Strong Support at KeTopic Statement:
TechM has been stuck in a consolidation zone, rebounding from strong support levels and forming a wedge pattern that may signal an upcoming breakout.
Key Points:
* The stock corrected up to the 30% Fibonacci retracement level, finding strong support around 1314
* It touched the 200-day moving average, which acted as a support and triggered a rebound
* The candlestick formation resembles a wedge, clearly marked on the chart with blue trend lines, indicating potential for a decisive move ahead
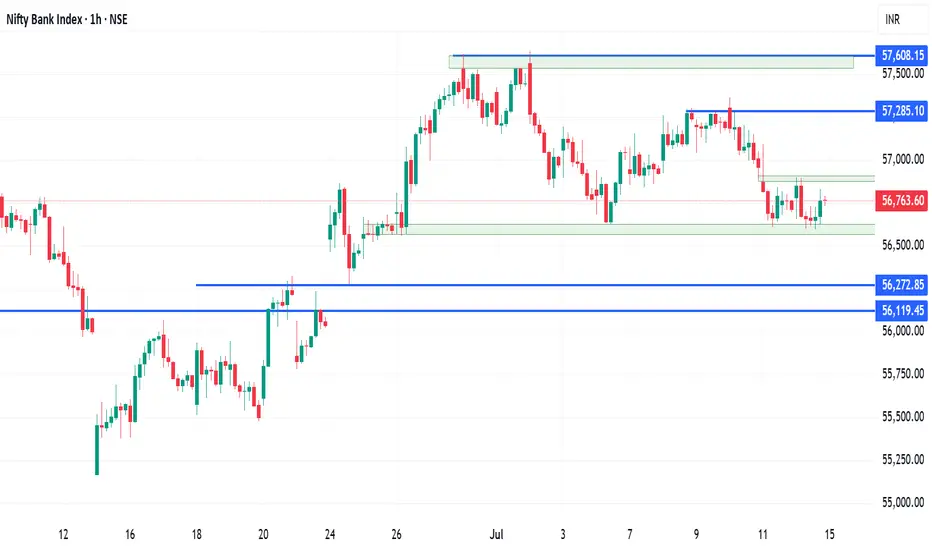
Banknifty analysis for the upcoming movement in the index.Banknifty has been trading in a range for a long time and is now trading around the support levels of 56600.
The RSI indicator on the daily charts is showing some bearish divergence and today the market has taken a halt after 2 days of fall.
If the market starts travelling on the lower side there are chances of testing the lower support level of 56120.
The market has been trading in a range of 56600 to 57600. And the support is tested many a times.
Bullish trades can be initiated for intraday play only once the market starts sustaining above today's high of 56900.
Moving averages are also forming a resistance gate around the resistance level. Watch for the breakout and enter only on the retest of the levels.
Major support levels :- 56600, 56270, 56120
Resistance levels :- 56900, 57285
Wait for the price action and trade according to the price action.
Cipla Trades Sideways Within Defined Range, Eyes Possible DoubleTopic Statement:
Cipla is currently stuck in a sideways zone, consolidating between key retracement levels while setting up for a potential move higher.
Key Points:
* The price is moving between 1502 (23.6% retracement) and 1380 (38.2% retracement), forming a clear horizontal range
* It remains fairly above the 200-day EMA, indicating underlying strength despite consolidation
* The stock may move up toward 1700 to form a double top, where it is likely to face strong resistance

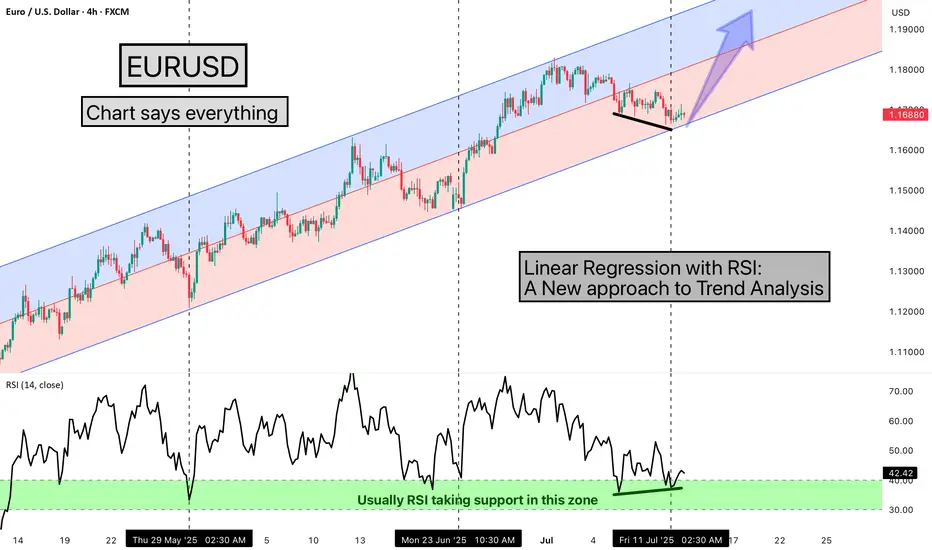
Linear Regression with RSI: A New approach to Trend AnalysisHello Friends,
Welcome to RK_Chaarts,
Today we are going to learn one Method of analysing the chart, here we are using EURUSD chart, and the method we're using is very simple & interesting, We are using the Linear Regression Trend Channel & Relative Strength Index (RSI), What happens in this method, is that we identify a particular zone where the price is making a one-sided move, like if the price is trending upwards, making higher highs and higher lows. We then apply a regression channel to it, and within that channel, we set internal deviation for the upper and lower sides, like 2 or 2.5 or 3 etc., whatever setting it takes.
In this chart, we can clearly see that the 2.5 setting is forming a complete channel, which we've applied for the last two months, from 12th May 2025, when the uptrend started. We've used the 4-hour time frame chart and the RSI. Every time the price hits the bottom of the channel, we can see that the RSI also enters the same zone, between 30-40, and from there, it bounces back.
Currently, the price has again hit the bottom of the regression channel, and the RSI has also gone below 40, between 30-40. And the good thing is that we're seeing a positive divergence in the RSI. So, there's a high possibility that the price might bounce back from here.
It's worth watching what happens next in the market. Nothing is guaranteed here; everything is a game of probabilities. This is one method that we often use, and its results have given us a very good experience. So, let's see what happens next in this chart. This observation is also a good learning experience, which we often encounter, 7-8 times out of 10, in favor of the market, but sometimes it doesn't work, maybe 2-3 times, when the trend changes. So, let's see what happens next.
This post is shared purely for educational purpose & it’s Not a trading advice.
I am not Sebi registered analyst.
My studies are for educational purpose only.
Please Consult your financial advisor before trading or investing.
I am not responsible for any kinds of your profits and your losses.
Most investors treat trading as a hobby because they have a full-time job doing something else.
However, If you treat trading like a business, it will pay you like a business.
If you treat like a hobby, hobbies don't pay, they cost you...!
Hope this post is helpful to community
Thanks
RK💕
Disclaimer and Risk Warning.
The analysis and discussion provided on in.tradingview.com is intended for educational purposes only and should not be relied upon for trading decisions. RK_Chaarts is not an investment adviser and the information provided here should not be taken as professional investment advice. Before buying or selling any investments, securities, or precious metals, it is recommended that you conduct your own due diligence. RK_Chaarts does not share in your profits and will not take responsibility for any losses you may incur. So Please Consult your financial advisor before trading or investing.
Swiggy: a probable long trade➡️Entered this with a stop loss of 374
➡️21 ema support
➡️Consumption theme has been picking up and I am hopeful that this scrip would be a beneficiary of the theme
➡️supply zone may act as a demand zone
➡️the volume on negative days have been meagre in comparison to the volume on positive days

Glenmark Pharma Recovers Strongly, Approaches Resistance After MTopic Statement:
Glenmark Pharma has staged a strong bullish recovery after a severe correction earlier this year, now testing key resistance levels.
Key Points:
* The price took heavy support at the 50% Fibonacci retracement level, forming a strong base for the rebound
* The stock is breaking out above its previous high, where a head and shoulders pattern had earlier signaled weakness
* Price has overextended above the 200-day EMA, suggesting it may face resistance and potential selling pressure ahead

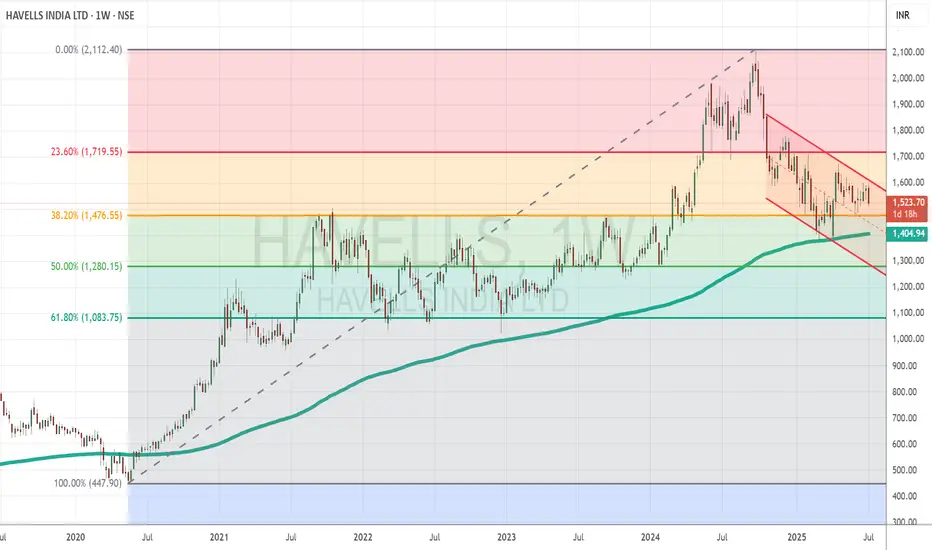
Havells India Shows Early Bullish Signs After Strong Support at Topic Statement:
Havells India has corrected but is showing early bullish signals, supported by key technical levels and poised for a breakout from its short-term downtrend.
Key Points:
* The price corrected to the 38.2% Fibonacci retracement level, where it received strong support
* It touched the 200-day EMA, which acted as a deflection point, preventing further downside
* Currently moving in a short-term downtrending channel, the stock is likely to resume strong bullish momentum once it breaks above this channel
Motherson Sumi Cup BreakoutBreakout from cup pattern yeaterday supported by large volume levels (5x from average)
RSI at 74
ADX at 19 with positive ADX at 39
Macd crossover confirming the bullish pattern
Buy level 63-64
Target 66 - 68 - 73++
SL 58

Double bottom breakout and retest : LindeIndiaAfter High of 9500 levels
Linde India corrected till 5500 levels
Nr 5500 we can see there is double bottom formation.
After breakout of neckline at 6500 it retested this neckline and is now ready for next bout of rally.
We can also see that 6500 level is also 20week SMA acting as support.
Tentative target and stoploss levels are marked on the chart.

Looks bullish on coming daysRedington , broken its tight consolidation with good volume and 8.4% move. It looks positive for coming days. Stock could give 10-20% in very short duration.
200% + RVOL shows buyers interest.
Weekly if we see, this stock came out of channel structure and giving good upmove with volume push.
Stay connected for commentary for coming days
Disclaimer:
The information provided herein is for educational and informational purposes only and should not be construed as investment advice. The stock analysis and recommendations are based on publicly available information, data sources believed to be reliable, and our interpretation at the time of writing.
Investing in equities involves risks, including the risk of loss of capital. Past performance is not indicative of future results. Readers and investors are advised to conduct their own research or consult a qualified financial advisor before making any investment decisions.
The author(s), affiliates, or associated entities may hold positions in the stocks mentioned, and such positions are subject to change without notice.
We do not guarantee the accuracy, completeness, or timeliness of any information presented, and we disclaim any liability for financial losses or damages resulting from the use of this content.

Nestle India Climbs Strongly Within Bullish Channel, Eyes PotentTopic Statement:
Nestle India is moving steadily upward in a strong bullish channel, setting up for a potential breakout as it approaches previous highs.
Key Points:
* The stock is trading in an up-trending channel, making it ideal for channel-based trading strategies
* It recently retraced to the 23.6% level and is now recovering, maintaining overall strength
* A previous double top suggests that a rise to those highs could trigger a breakout if resistance is cleared
* The price consistently rebounds when touching the 200-day EMA, reinforcing it as a strong dynamic support level

Swing/Positional Setup: Sector-wise Analysis – Cash/Options Segm✅ Swing and Positional Trade Setup
Sector-wise Analysis – Cash / Futures & Options Segment:-
Over the past 18+ years, I have developed a trading setup that revolves around sectoral analysis. My trades are taken in cash, futures, and options, based on which sector and which stock is showing strength.
Below, I’ve shared the complete sector-wise stock list. This will help you skip the most time-consuming part—stock selection—so you can focus purely on execution and discipline.
🔍 Stock Selection Criteria: List Provided Sector Wise Stocks -
• Market Capitalization
• Liquidity
• Volumes
📊 1. Positional/Swing Trade Setup
This setup begins by identifying:
• Which sector is currently showing strength (e.g., Nifty Auto).
• Which stocks in that sector are outperforming the benchmark.
⚠️ Note for Beginners:
If your capital is below ₹20 lakhs, avoid trading in futures. Stick to cash market or stock options only.
🕒 Timeframes for Analysis:
• Monthly
• Weekly
• Daily
🛠️ Technical Tools Used:
• 9 SMA (Simple Moving Average)
• Volumes
• RSI (Relative Strength Index)
• Market Structure
(HH–HL for bullish, LH–LL for bearish)
📈 Entry Criteria (Bullish / Long Trades):
For Options (Call), Cash or Futures Buy:
• Price must be above 9 SMA on Monthly, Weekly, and Daily charts.
• Monthly and Weekly RSI > 50
• Daily RSI > 60 → This confirms a 7-Star Setup (Big Momentum Trade)
✅ Execution Plan:
• Entry: Above the high of the previous daily candle.
• Stop Loss: Below Daily 9 SMA or the recent swing low.
• Trailing Strategy:
• After 3 daily candles, trail stop loss to cost.
• Continue trailing below each new daily candle's low.
Exit Criteria:
• Daily close below 9 SMA
• OR RSI drops below 60
• OR both conditions occur
📉 Entry Criteria (Bearish / Short Trades – Put Option or Short in Futures):
• Daily and Weekly RSI < 50
• Price must be below 9 SMA on Daily and Weekly charts.
• Entry, stop-loss, and exit follow the same process in reverse.
📂 Sector-wise Stock List to Focus On:
🚗 Auto:
ASHOKLEY | BAJAJ-AUTO | BALKRISIND | BHARATFORG | BOSCHLTD | EICHERMOT | EXIDEIND | HEROMOTOCO | MRF | M&M | MARUTI | MOTHERSON | TVSMOTOR | TATAMOTORS | TIINDIA
🏦 Banking & Financial Services:
AU Small Finance Bank Ltd. | Axis Bank Ltd. | Bank of Baroda | Canara Bank | Federal Bank Ltd. | HDFC Bank Ltd. | ICICI Bank Ltd. | IDFC First Bank Ltd. | IndusInd Bank Ltd. | Kotak Mahindra Bank Ltd. | Punjab National Bank | State Bank of India | Bajaj Finance Ltd. | Bajaj Finserv Ltd. | Cholamandalam Investment and Finance Company Ltd.
⚗️ Chemicals:
Aarti Industries Ltd. | Atul Ltd. | Bayer Cropscience Ltd. | Chambal Fertilizers & Chemicals Ltd. | Coromandel International Ltd. | Deepak Nitrite Ltd. | E.I.D. Parry (India) Ltd. | Gujarat Fluorochemicals Ltd. | Gujarat Narmada Valley Fertilizers and Chemicals Ltd. | Himadri Speciality Chemical Ltd. | Linde India Ltd. | Navin Fluorine International Ltd. | PCBL Chemical Ltd. | PI Industries Ltd. | Pidilite Industries Ltd. | SRF Ltd. | Solar Industries India Ltd. | Sumitomo Chemical India Ltd. | Tata Chemicals Ltd. | UPL Ltd.
🛍️ FMCG:
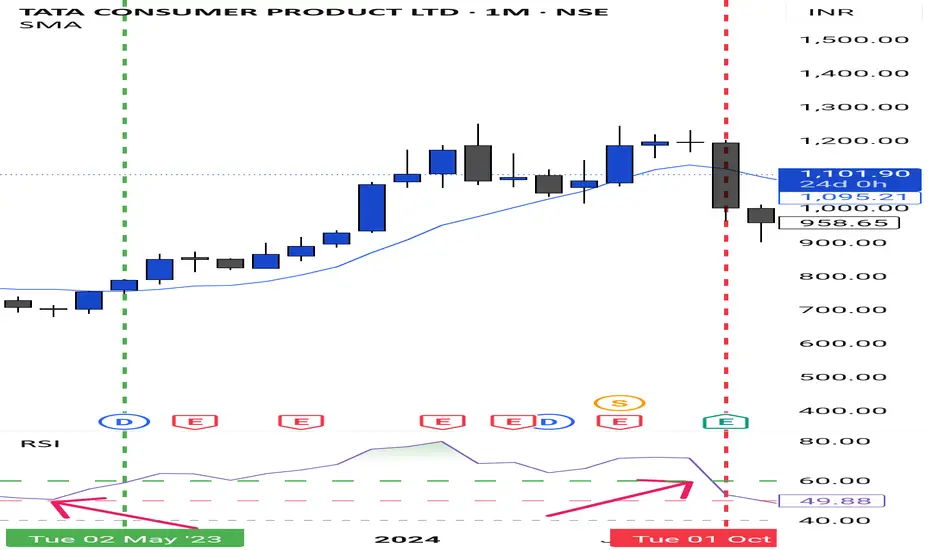
Britannia Industries Ltd. | Colgate Palmolive (India) Ltd. | Dabur India Ltd. | Emami Ltd. | Godrej Consumer Products Ltd. | Hindustan Unilever Ltd. | ITC Ltd. | Marico Ltd. | Nestle India Ltd. | Patanjali Foods Ltd. | Radico Khaitan Ltd. | Tata Consumer Products Ltd. | United Breweries Ltd. | United Spirits Ltd. | Varun Beverages Ltd. | Dmart
💊 Pharma & Healthcare:
Abbott India Ltd. | Alkem Laboratories Ltd. | Apollo Hospitals Enterprise Ltd. | Aurobindo Pharma Ltd. | Biocon Ltd. | Cipla Ltd. | Divi's Laboratories Ltd. | Dr. Reddy's Laboratories Ltd. | Fortis Healthcare Ltd. | Glenmark Pharmaceuticals Ltd. | Granules India Ltd. | Ipca Laboratories Ltd. | Laurus Labs Ltd. | Lupin Ltd. | Mankind Pharma Ltd. | Max Healthcare Institute Ltd. | Sun Pharmaceutical Industries Ltd. | Syngene International Ltd. | Torrent Pharmaceuticals Ltd. | Zydus Lifesciences Ltd.
💻 IT & Tech:
Coforge Ltd. | HCL Technologies Ltd. | Infosys Ltd. | LTIMindtree Ltd. | MphasiS Ltd. | Oracle Financial Services Software Ltd. | Persistent Systems Ltd. | Tata Consultancy Services Ltd. | Tech Mahindra Ltd. | Wipro Ltd.
⚒️ Metals:
APL Apollo Tubes Ltd. | Adani Enterprises Ltd. | Hindalco Industries Ltd. | Hindustan Copper Ltd. | Hindustan Zinc Ltd. | JSW Steel Ltd. | Jindal Stainless Ltd. | Jindal Steel & Power Ltd. | Lloyds Metals And Energy Ltd. | NMDC Ltd. | National Aluminium Co. Ltd. | Steel Authority of India Ltd. | Tata Steel Ltd. | Vedanta Ltd. | Welspun Corp Ltd.
🏙️ Realty:
Anant Raj Ltd. | Brigade Enterprises Ltd. | DLF Ltd. | Godrej Properties Ltd. | Macrotech Developers Ltd. | Oberoi Realty Ltd. | Phoenix Mills Ltd. | Prestige Estates Projects Ltd. | Raymond Ltd. | Raymond Realty Ltd. | Sobha Ltd.
🧱 Durables & Cement:
Amber Enterprises India Ltd. | Bata India Ltd. | Blue Star Ltd. | Century Plyboards (India) Ltd. | Cera Sanitaryware Ltd. | Crompton Greaves Consumer Electricals Ltd. | Dixon Technologies (India) Ltd. | Havells India Ltd. | Kajaria Ceramics Ltd. | Kalyan Jewellers India Ltd. | PG Electroplast Ltd. | Titan Company Ltd. | V-Guard Industries Ltd. | Voltas Ltd. | Whirlpool of India Ltd. | ACC | Ambuja Cements | Ultratech Cement | Shree Cements | JK Cement
🛢️ Oil & Gas:
Adani Total Gas Ltd. | Aegis Logistics Ltd. | Bharat Petroleum Corporation Ltd. | Castrol India Ltd. | GAIL (India) Ltd. | Gujarat Gas Ltd. | Gujarat State Petronet Ltd. | Hindustan Petroleum Corporation Ltd. | Indian Oil Corporation Ltd. | Indraprastha Gas Ltd. | Mahanagar Gas Ltd. | Oil & Natural Gas Corporation Ltd. | Oil India Ltd. | Petronet LNG Ltd. | Reliance Industries Ltd.
✨ Final Thoughts
If you have any doubts or need help, feel free to ask. Take some time to reflect on this system. It offers clarity, discipline, and a pathway to wealth and peace of mind.
Don’t overconsume content. Stick to one tested process. Treat trading like a business, not a quick-money scheme.
🎯 Proven Success Rate: 80%
Add these stocks to your watchlist and follow the system diligently.
Wishing you successful trades ahead. May we all grow together. Happy to help always. 🙏
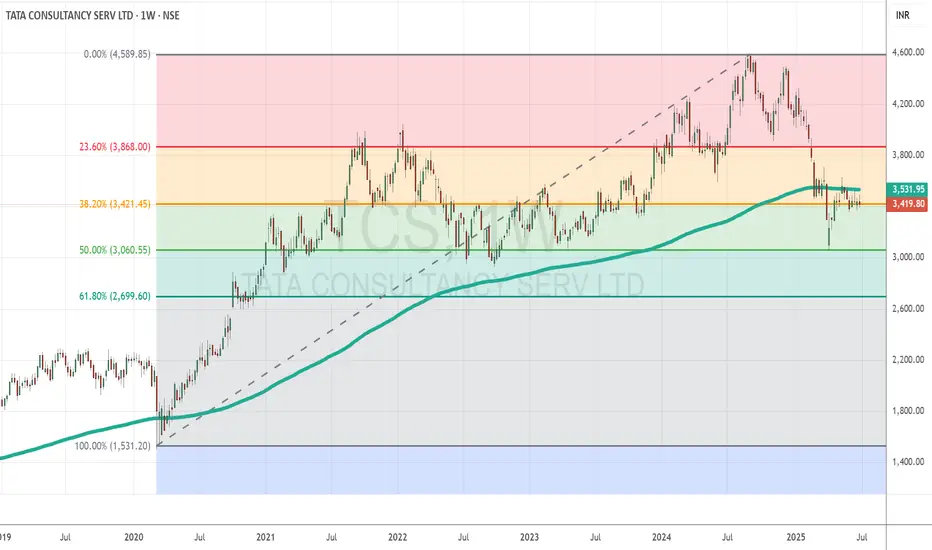
TCS Eyes Rebound as Strong Support and Results AlignTopic Statement:
TCS is currently oversold, with upcoming quarterly results potentially driving a rebound from strong technical support levels.
Key Points:
* The stock retraced to the 50% Fibonacci level at 3060, aligning with the psychological barrier around 3000 that acted as strong support
* Price is now stuck at the 38.2% retracement level at 3421, indicating a key resistance zone to watch
* Trading below the 200-day EMA suggests the stock is oversold, offering a rare and attractive investment opportunity in TCS
Long AMBUJACEMSuperTrend has turned positive on the weekly chart, with the recent closing price trading above the 10 EMA
BUY AMBUJACEM
Entry - 596
SL - 558

Long ASAHIINDIASuperTrend has turned positive on the weekly chart, with the recent closing price trading above the 10 EMA
BUY ASAHIINDIA
Entry - 848
SL - 742

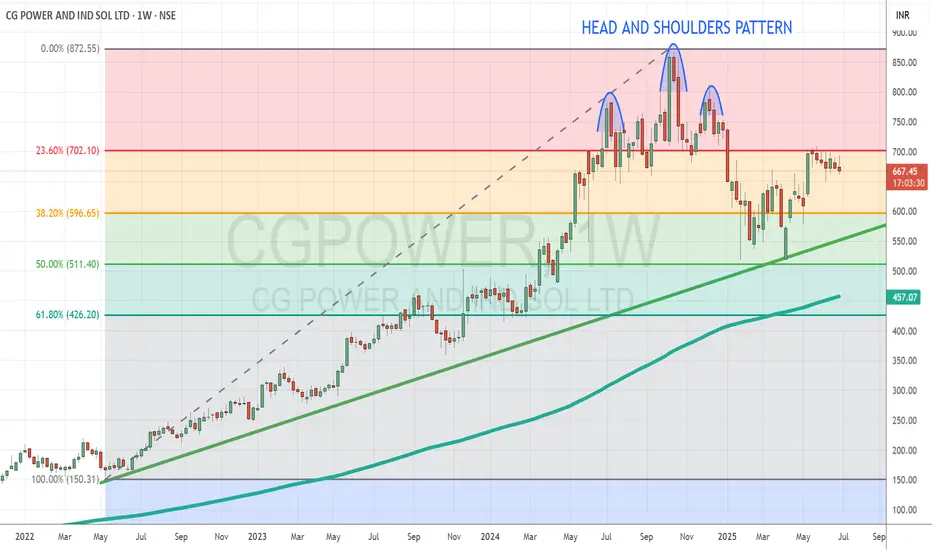
CG Power Rebounds After First Major Correction Supported by StroTopic Statement:
CG Power has made its first significant correction and is now set on a recovery path in line with the broader market rally.
Key Points:
* The stock respected a major trendline, receiving strong support during its recent correction
* It found repeated and substantial support at the 50% Fibonacci retracement level, reinforcing its base
* The correction was signaled by a head and shoulders pattern clearly marked on the chart, leading to the recent pullback before the recovery began
* The stock price is very expensive as it is mostly overextended above the 200 day exponential moving average
Bajaj Auto: Wave 4 Triangle Nearing CompletionAfter completing a complex W-X-Y-X-Z correction earlier this year, Bajaj Auto appears to have started a fresh impulsive rally. The move from 7,089 to 9,004 looks like a 5-wave structure in progress, with the chart now suggesting Wave 4 is unfolding as a contracting triangle.
Wave E of the triangle seems close to completion near the lower boundary.
SMA100 is aligned with this support zone, potentially offering additional footing for price.
The Fibonacci retracement zone (Wave 1–3) lies between 8,046 and 8,273.
RSI is stabilizing, indicating that downside momentum is weakening.
A breakout from the triangle could signal the start of Wave 5.
Key level to watch:
Invalidation at 7,612 — a break below this would invalidate the current bullish setup.
Note: This chart is part of my ongoing series where I aim to annotate and study as many NIFTY-listed stocks as possible using Elliott Wave principles and simple technical tools.
Disclaimer: This analysis is for educational purposes only and does not constitute investment advice. Please do your own research (DYOR) before making any trading decisions.

PepsiCo (PEP): A Potential Shift from Downtrend
Following a prolonged corrective phase that commenced in March 2025, PepsiCo's price action is exhibiting noteworthy signs of a potential bullish reversal. A significant breakout from a multi-week consolidation range on the daily timeframe suggests a possible shift from distribution to accumulation. This hypothesis is supported by strengthening momentum indicators and the reclamation of a key moving average, warranting a closer look at key technical levels.
Detailed Technical Analysis:
1. Price Action: Breakout from Consolidation
After establishing a clear downtrend, PEP entered a period of consolidation, forming a well-defined trading range with a base near the $127 level. Today's session saw a decisive breakout above the upper boundary of this range. Such a move often indicates an exhaustion of selling pressure and an influx of demand. For this bullish thesis to gain further conviction, continued closes above this breakout zone would be constructive. The quality of this breakout would be further substantiated by an accompanying surge in trading volume, which signals significant market participation.
2. Momentum Analysis: RSI Indicating Renewed Buying Interest
Daily RSI: The RSI on the daily chart has surged to 62. A move above the 60 level typically suggests that bullish momentum is accelerating and is now in a strong position.
Weekly RSI: On the weekly timeframe, the RSI has advanced above 42. While still below the key 50 midline, this upward trajectory from oversold territory indicates a notable waning of long-term bearish momentum and may be an early sign of a strengthening trend.
3. Trend Analysis: Reclamation of the 50 EMA
The stock has successfully achieved a close above its 50-Day EMA. This moving average is a widely watched indicator for the medium-term trend. For much of the recent downtrend, the 50 EMA acted as dynamic resistance. By reclaiming this level, it suggests a potential shift where it may now serve as dynamic support during any subsequent pullbacks.
Potential Forward Outlook & Key Levels to Monitor:
Primary Area of Resistance: The $143 zone stands out as the first significant technical hurdle. This level could coincide with prior price structure and may attract initial profit-taking from short-term traders.
Secondary Area of Resistance: Should the momentum carry the price decisively through the primary resistance, the next major level of interest appears to be around $158 . This area represents a more significant structural resistance from the preceding downtrend.
Area for Risk Management: The zone below $127 is a critical area to monitor. This level represents the floor of the recent consolidation base. A sustained break below this level would potentially invalidate the bullish breakout hypothesis and suggest a continuation of the prior downtrend.
Disclaimer: The information provided in this technical analysis is for informational and educational purposes only and should not be construed as financial or investment advice. It is an interpretation of historical price data and technical indicators. Market dynamics can change, and past performance is not indicative of future results. All trading and investment activities involve substantial risk. Always conduct your own thorough due diligence and consult with a qualified financial advisor before making any investment decisions.

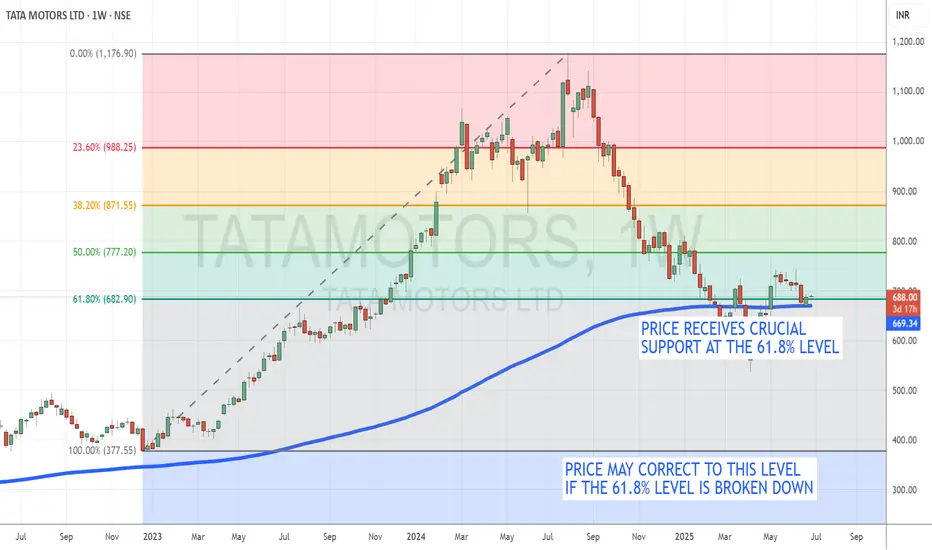
Tata Motors Holds at Key Support, Oversold Levels Hint at PotentTopic Statement:
Tata Motors, heavily beaten down and still oversold, is clinging to crucial support that could define its next move.
Key Points:
* The stock has repeatedly taken support at the 61.8% Fibonacci retracement level, where it currently trades even today
* Price is hovering just above the 180-day EMA, suggesting a delicate balance between support and further downside risk
* A move up is possible from this oversold level, but if support breaks, the price could slide further toward the 400 zone
MAXHEALTHThis chart analysis is for educational purposes only.
MAXHEALTH stock has exhibited a strong breakout followed by a retracement. A minimal pullback is anticipated, with a high probability of continued bullish momentum.

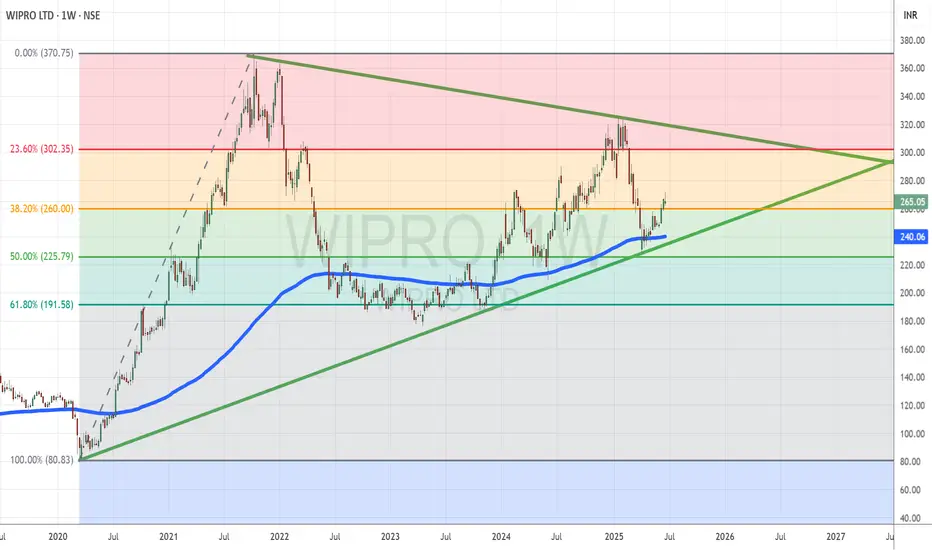
Wipro Trades in a Tight Wedge After Support-Led ReversalTopic Statement:
Wipro, a lagging IT stock, has shown signs of reversal after strong support at the 50% retracement level, with a wedge pattern hinting at a decisive breakout ahead.
Key Points:
* The stock retraced to the 50% Fibonacci level at 225, where it found strong support and reversed
* Price had dipped below the 180-day EMA during the correction, further reinforcing the significance of the support zone
* A wedge pattern is now forming, and a breakout on either side could define the next major move
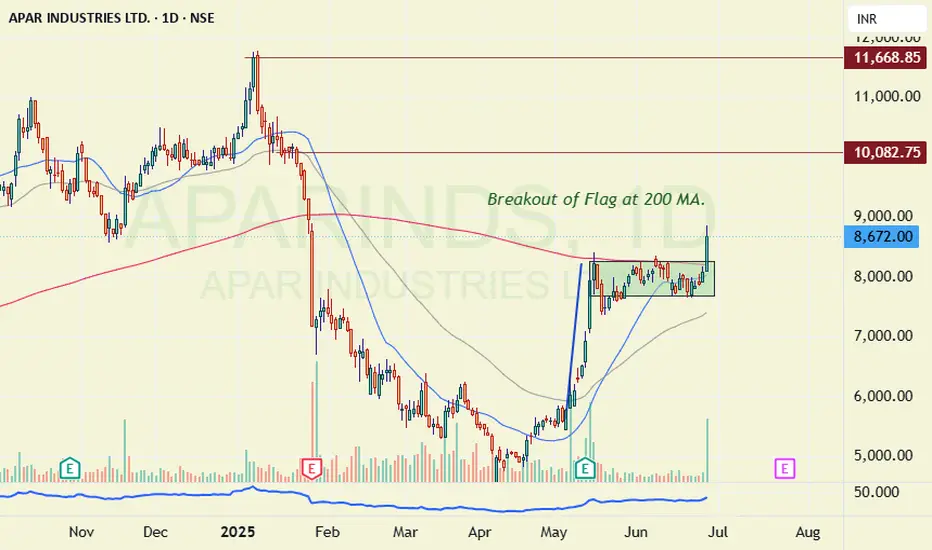
Apar Flag breakoutAs can be seen in Apar industries.
The stock was taking resistance of 200 Moving avg.
It formed a consolidation pattern under 200MA. Which is also good example of flag formation.
First resistance at 10k and next is at ATH of 11600. SL of 8000 Levels can be considered.