BEL Extends Strong Bull Run Amid Geopolitical TailwindsTopic Statement:
BEL has surged into a powerful uptrend, fueled by geopolitical tensions and a breakout from its previous downtrend.
Key Points:
* The stock recently broke out of a downtrending channel and is now moving within a strong bullish uptrending channel
* It is rising sharply at a 45-degree angle, reflecting intense buying momentum
* The price has significantly overextended above the 180-day EMA, indicating an overbought condition
* The uptrend remains intact as long as the price holds within the current bullish channel
Moving Averages

Ultracemco Sideways ( Educational Purpose Only)It is sideways with Golden Death Indicator. VWAP 3 and 30 days are long. Its gaining momentum today. On the long side estimated targets are 11530 and 11630. On the short side estimated targets are 11300 and 11200. At the time of this analysis its trading at 11440.
I am not a SEBI-registered investment advisor. Please consult a qualified SEBI-registered advisor before making investment decisions.
#ultracemco #stocks #StocksInFocus #StockMarketIndia #Nifty

BSE Bouncing backNSE:BSE is in good momentum. Bouncing from Fib level.
RSI above 50
RS above 0
Above all major EMAs.

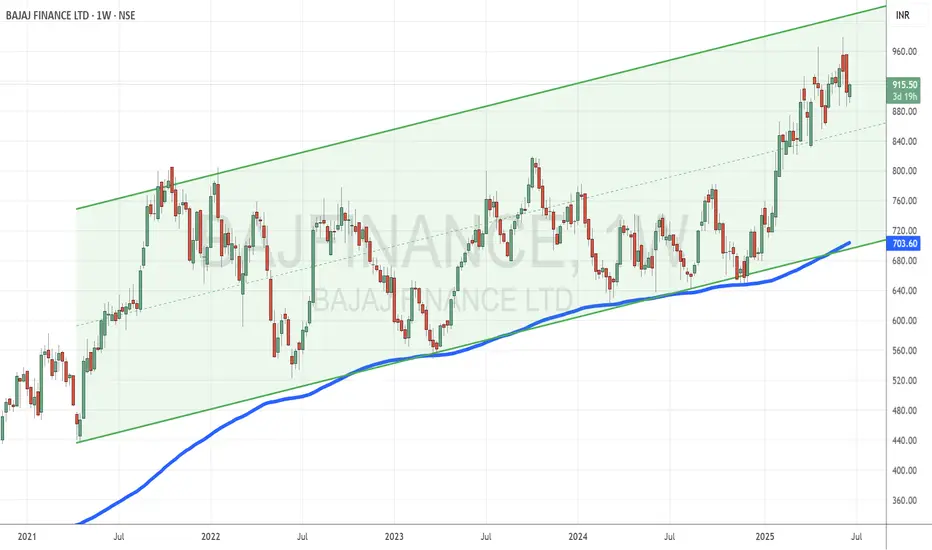
Bajaj Finance Rallies in Bullish Channel Post Stock SplitTopic Statement:
Bajaj Finance continues its bullish trend within an up-trending channel, with the recent stock split making the stock more accessible and potentially boosting trading volumes.
Key Points:
* The stock is moving steadily in a bullish up-trending channel, allowing for consistent channel-based trading
* It typically trades above the 180-day exponential moving average, often finding support when touching the EMA
* The recent stock split has made the stock price more affordable, which may lead to increased volumes and further upside momentum
Hindustan Unilever Trades Sideways with Clear Swing Levels in FoTopic Statement:
Hindustan Unilever has been moving in a sluggish sideways range for the past four years, offering defined zones ideal for swing trading.
Key Points:
* The stock has well-defined accumulation and distribution zones, making it suitable for clear swing trade setups
* Price is currently just above the distribution zone and trading below the 180-day EMA, making the stock relatively cheap
* A breakout from either zone could trigger a strong directional move depending on the breakout side

Double bottom at 200MA in Godrej PropertiesGodrej properties has shown good double bottom reversal pattern nr 200 moving average this can be good sign of reversal.
While the pattern is bullish we need to wait for targets to achieve as it might take resistance of 50ema as it has done in past.
If it gives another higher swing low there could be good buying opportunity with better risk rewards.
As per pattern target of 2900 can come by end of 2025.

Resistance and support in Indus TowersWe can see in this chart that this counter is respecting levels very well.
1. 330 level was acting as resistance in 2019 and 2021. This was broken and became support since Nov 2024.
2. While 330 was becoming support 375 acted as resistance for jan to mar 2025.
3. Once 375 was broken it became support since April 2025.
4. Good triangle pattern consolidation was happening with support of 375. This triangle pattern is now broken. It is very likely that 450 which acted as resistance in sept 2024 will become new resistance.
Additionally 20 & 50 moving avgs are also acting as support nr 375.
When support resistance and moving avg are giving same signal it makes a high probable trading opportunity,
To trade such setup one need to be careful about risk(loss) and buy on dips and control quantity to keep risk low.

Gold Ready to test 3700Gold Has taken support at 3300 (20 Dema)
There are Good chances that the Upper End of Parallel Channel at 3700 could be tested soon.
Unless 3300 is broken.

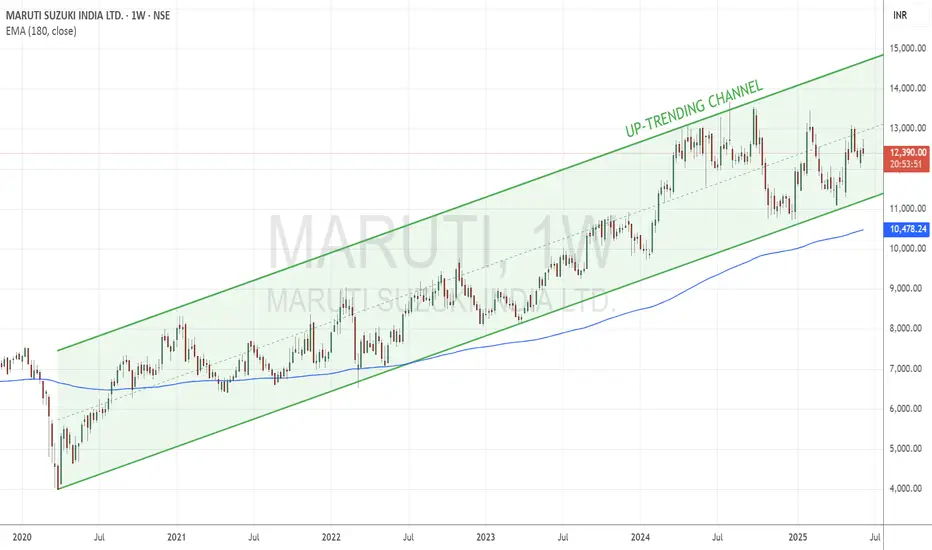
Maruti Moves Steadily Higher Within a Structured Bullish ChannelTopic Statement:
Maruti is on a moderate bullish run, trading within a defined uptrending channel and supported by key price levels.
Key Points:
* The stock is moving in an uptrending channel, making it suitable for consistent channel-based trading
* Price remains mostly above the 180-day EMA, offering good accumulation opportunities near the EMA
* Strong support has been observed at the 13,000 level, with crucial long-term support around 11,000
* A breakout above or below these levels could lead to significant directional movement
Tirumalai: The Anatomy of a BreakoutOn the daily chart, TIRUMALCHM appears to be approaching a potential breakout from an ascending triangle pattern, a formation often associated with bullish continuation. Notably, the price has managed to close above all key EMAs, including the 200-day EMA, which is widely regarded as a long-term trend indicator.
From a momentum perspective, both the RSI and MACD indicators are showing strength on the daily and weekly timeframes. These signals may suggest the early stages of a sustained upward trend, contingent on broader market conditions and follow-through price action.
Given the current technical setup, the stock may be considered for gradual accumulation near the CMP. Alternatively, more conservative participants might prefer to wait for a potential retest of the breakout zone in the coming sessions, which could offer a more favourable risk-reward entry with a next long term resistance of ₹340 .
A technical invalidation level could be considered below the ₹251 mark, depending on individual risk tolerance and trading strategy.
Disclaimer: This analysis is intended solely for educational and informational purposes. It does not constitute investment advice or a recommendation to buy or sell any financial instrument. Market participants are strongly encouraged to conduct their own research or consult with a qualified financial advisor before making any investment decisions.

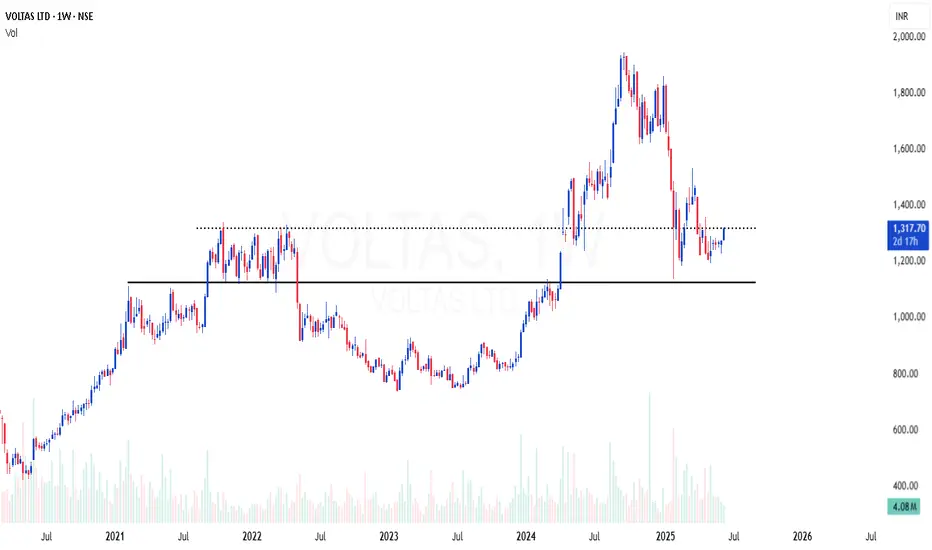
VOLTAS | Excellent area of value in weekly time frameVOLTAS | Excellent area of value in weekly time frame
Weekly 200 EMA support
RSI bullish divergence
Good risk reward
Quality stock at decent correction , looking good for reversal from here
BEPL Breakout soonBEPL about to breakout with 16% profit in short term with triangle pattern and also 55 ema has crossed 8,13,21 ema which shows strong uptrend on moving average
Hold duration around 1-2 month
Entry - 117
Target -138
Stock has good fundamentals
So I suggest to buy BEPL Bhansali eng. Polymers LTD

Btc about to break all time high After hitting 1,12,000 BTC has shown some weakness and give low of 1,00,370 however in 4H and 1D time frame we can see Bull flag patterns and as i said in previous post it has also created inverse head and shoulder pattern in Daily time frame (target of 1,50,000). And now created bullish flag in that head and shoulder (Target of 1,35,000).

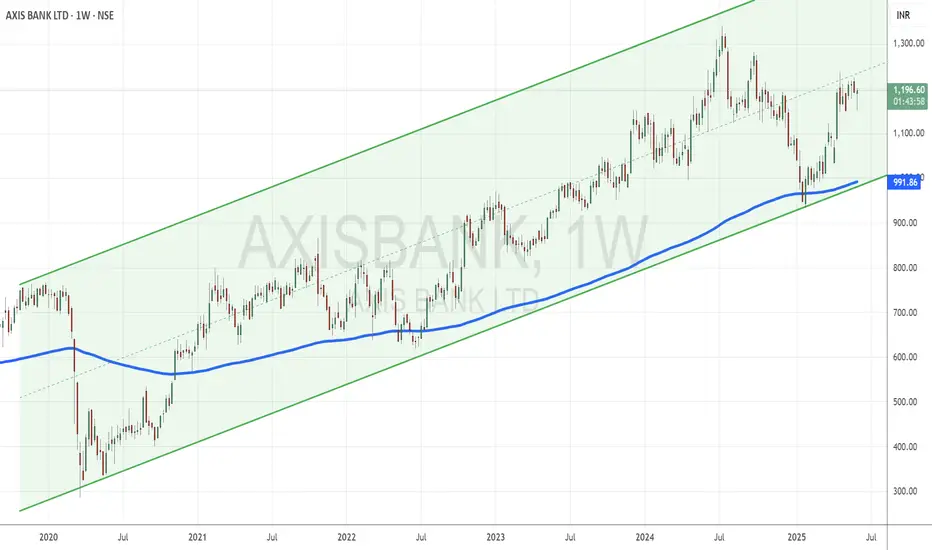
Axis Bank Climbs Steadily Within a Moderate UptrendTopic Statement:
Axis Bank is on a moderate bull run, advancing within a stable uptrending channel but with less momentum compared to its peers.
Key Points:
* The stock is moving upwards in a bullish uptrending channel, making channel trading straightforward
* It is trading close to its lifetime high, reflecting gradual strength
* Accumulating the stock near or below the 180-day EMA offers a favorable risk-reward setup
BTC Market Update: Signs of a 2021 Replay?📉 BTC Market Update: Signs of a 2021 Replay?
Looking at the chart, BTC is showing a price structure quite similar to late 2021—right after reaching its ATH around 69k before a major downturn.
🔁 If history repeats itself, the upcoming market conditions could turn bearish.
Currently, price has retested the moving average zone and is beginning to show a negative reaction.
⏳ This is a phase where traders should remain cautious—avoid FOMO, stay calm, and wait for clear confirmation signals.
📲 I’ll continue to post updates as soon as stronger signals emerge.
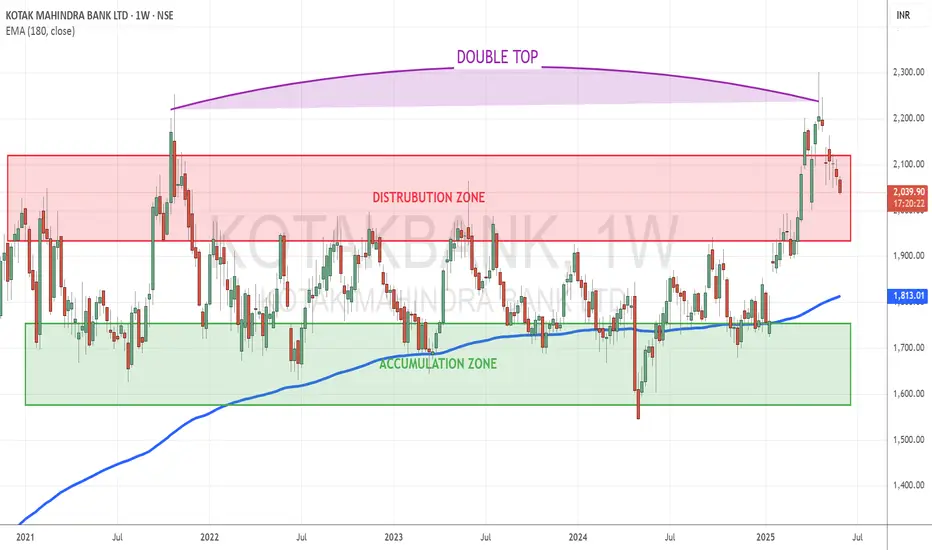
Kotak Bank Remains Range-Bound Amid Breakout AttemptsTopic Statement:
Kotak Bank has been trading sideways since 2021, forming a structured accumulation and distribution pattern within a broad range.
Key Points:
* The stock has clear accumulation and distribution zones, making channel-based trading efficient
* A recent breakout attempt was met with strong resistance, forming a double top pattern and pushing the price down
* The price has overextended above the 180-day EMA, contributing to the heavy resistance at the double top
* Accumulating the stock near or below the 180-day EMA presents a favorable long-term opportunity
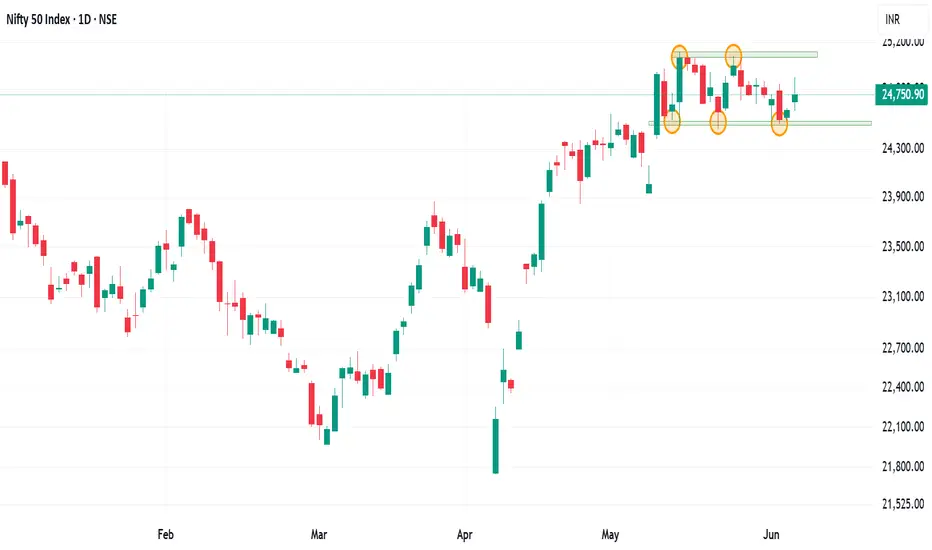
Outlook on nifty 50 for the next week. Is it going trending?Nifty 50 on the daily chart is trading in a range and has respected the zone quite effectively.
Index has remained sideways since a 3.82% move on 12th may. Market trade in cycle and after a sideways cycle, a trending market is predicted.
Either side movement can be seen in the index as 18 bars or 24 days it has remained in the range.
Major Resistance :- 25125, 25500
Major support :- 24500, 23930
This 600 range and change into same range of trending market.
Even the moving averages are coinciding and forming a MA gate which can give good momentum trading setup
Wait for the price action near the price levels before forming a trading basis. Trade only the setup and wait for the retest on either side.
CDSL RESISTANCE BREAKOUTCDSK breaking longterm resistance weekly
with huge volume building up last few week
bullish RSI,trading above all key ema
#target 1950 sl 1500(apply ur own sl)
NO BUY/SELL RECOMENDATION

YESBANK: Riding the Bullish WaveYes Bank has exhibited a notable breakout above the resistance level established in December 2024. This breakout is accompanied by a classic flag pattern formation, which has resolved to the upside—typically interpreted by technical analysts as a continuation signal within an existing trend.
A significant increase in trading volume during the breakout phase adds weight to the move, suggesting heightened market participation. Furthermore, the 20-day EMA has crossed above the 200-day EMA, a crossover often referred to as a "Golden Cross" , which is generally viewed as a bullish signal indicating potential for continued upward momentum.
The RSI is currently positioned above 60, reflecting sustained buying interest without yet entering overbought territory.
From a structural perspective:
Immediate resistance may be encountered near the 24.75 level.
A secondary resistance zone appears around 28.54.
On the downside, the stock seems to have established a support base near 19.54, which could act as a cushion in the event of a pullback.
Disclaimer:
This analysis is intended solely for informational and educational purposes. It does not constitute investment advice, a recommendation, or an offer to buy or sell any securities. Market conditions can change rapidly, and all trading involves risk. Individuals should conduct their own due diligence or consult with a qualified financial advisor before making any investment decisions.

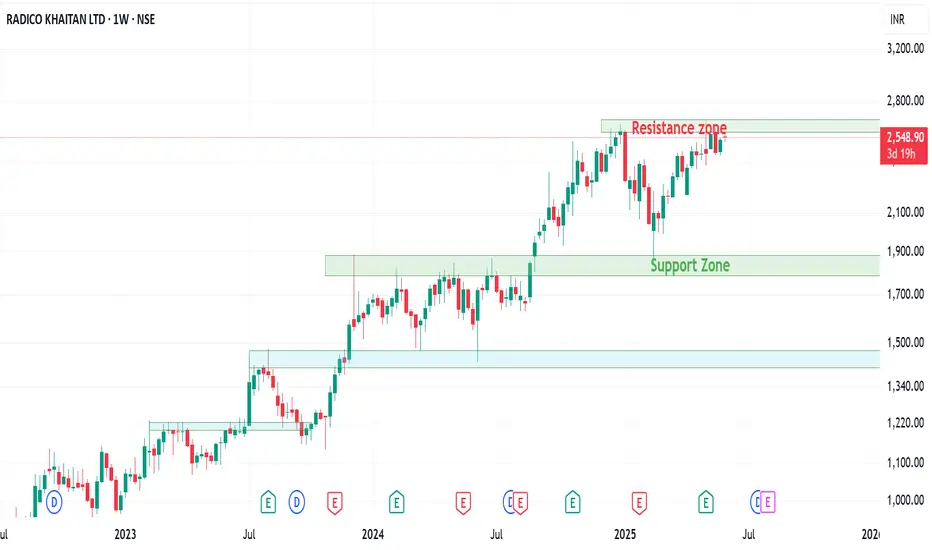
Radico Khaitan at a Crossroads: Support, Resistance & MomentumThe stock is in a bullish trend and is forming a box consolidation and break outs.
On the weekly charts the stock is trading around the resistance zone and there are chance of either breaking out or retesting to the lower levels.
Stock seems strong bullish on the charts but indicators are suggesting a bearish move as the stock is around the resistance zone.
Short sell can be initiated in the stock with a strict SL.
On the bullish side the stock is respecting the monthly 20 EMA and has retested it thrice. Radico if turns bearish can be entered around the moving average as Good R:R in the trade can be seen.
Even on the weekly charts, the stock is trading above the moving averages chance of a retest are there but short sell the stock once the support zone in taken out.
Watch the stock a good ROI can be generated in the stock after the break out the stock will be forming new ATHs.
Wait for a pattern near the resistance either for a bearish or bullish move as it is trading around the crucial recent high levels of 2600-2680.
Stochastic indicator on the Monthly TF is trading in overbought zone while on the weekly TF its showing some bearish divergence. Even the monthly RSI is showing a bearish divergence.
Wait for the price action and trade accordingly.
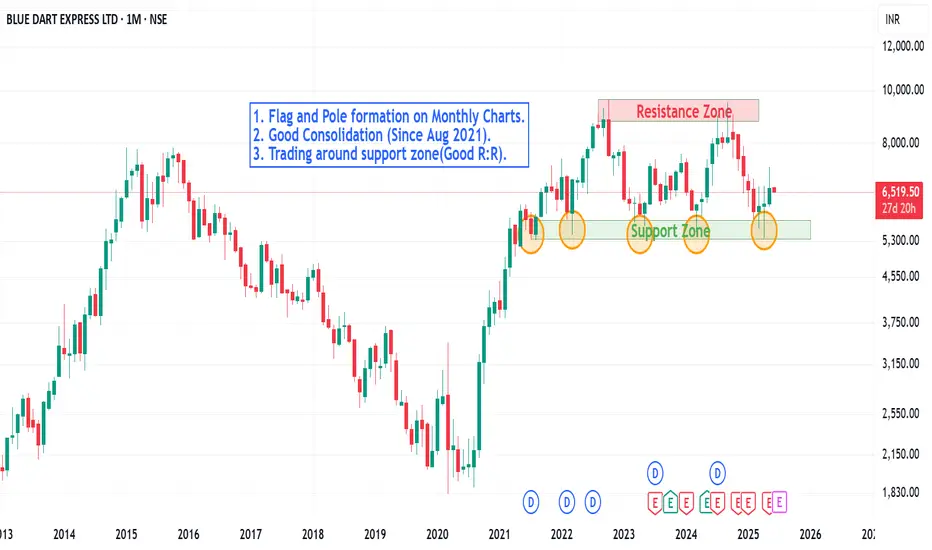
Is Bluedart Gearing Up for a Breakout? A Technical PerspectiveA good consolidation in there in the stock and on the monthly chart the stock has reconfirmed the support zone.
Major buying in happening there around 5500-5670 zone.
Weekly charts are showing consolidation phase around the very closing level as the price is trading between the various Moving averages.
A buying opportunity around 6200 levels can be initiated with a proper SL.
Technical Indicators:-
1. Stochastic : The weekly charts are trading around the oversold zone and on monthly charts its showing some lower levels coming on the charts.
2. Relative Strenght Indicator : On the monthly charts the stock has formed a bearish divergence and can be purchased once a 'W' formation is there in the RSI or price chart.
The stock has respected the support level since August 2021, a bearish trade can only be initiated once the major support level of 5500 is taken out. Avoid shorting till these levels.
Blue dart owning the logistic market can benefit from the E-commerce growth.
Long term buying opportunity can be seen in the stock with a potential returns of around 33-35% with a risk of 12-13% in coming years.
Watch the price action and enter only when the setup/pattern is formed on the charts.
BAJFINANCEThis is intended solely for educational purposes.
The BAJFINANCE stock is experiencing gradual growth, trading above key moving averages such as 200, 150, and 50. Additionally, this stock is trading above a key support level. Considering the trend, there is a high probability of further upward movement. However, it is advisable to trade with a stop-loss to manage risk effectively.

SOBHA | Breakout after consolidation + 200 EMA supportSOBHA | Breakout after consolidation + 200 EMA support
CMP : 1433 (Dip : 1300)
SL : 1200
Target : 2000
