ICICI Bank Powers to Lifetime High Within a Strong Bullish ChannTopic Statement:
ICICI Bank is on a robust bull run, steadily advancing within a strong uptrending channel.
Key Points:
* The stock is moving upwards in a strong bullish uptrending channel, making channel-based trading highly effective
* It is currently trading at its lifetime high, reflecting continued strength and investor optimism
* The price has highly overextended above the 200-day EMA, indicating the stock is highly overbought and may be poised for a cooling-off phase
Moving Averages

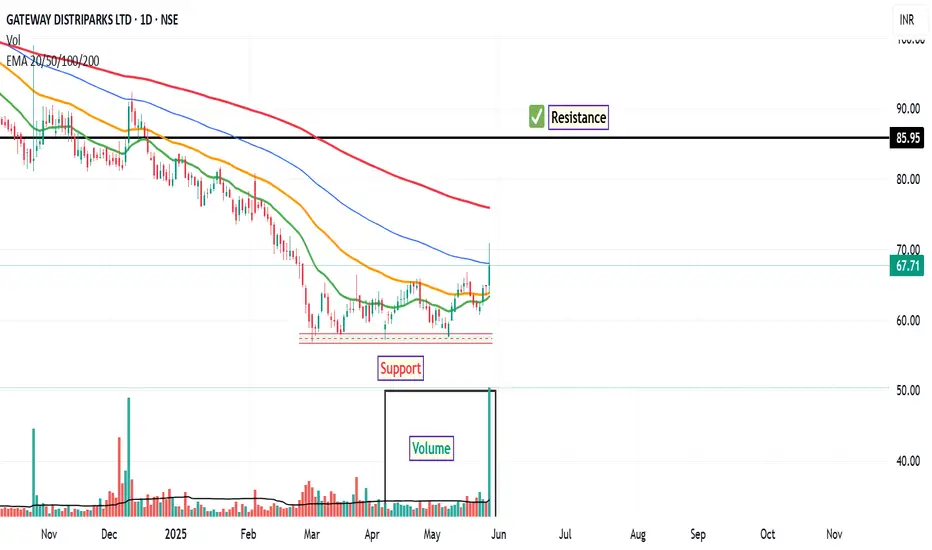
Gateway Distriparks Ltd: Technical CommentaryIn the latest trading session, Gateway Distriparks Ltd demonstrated notable technical strength. The stock successfully closed above both its 20D and 50D EMAs, indicating a potential shift in short- to medium-term momentum. Additionally, it managed to close above the 20-week EMA, which may suggest a broader trend alignment in favour of the bulls.
Volume analysis further supports this view, with a noticeable uptick in trading activity accompanying the price movement—often interpreted as a sign of institutional interest or increased market participation.
The RSI has crossed above the 65 level, a zone that is frequently associated with strong bullish momentum. This development may be interpreted by some market participants as a signal of continued buying interest.
From a price action perspective, the stock appears technically favorable in the range of ₹64, with a potential resistance zone near ₹85. A prudent risk management approach might involve monitoring for a close below ₹56, which could serve as a reference point for reevaluating the trade setup.
Disclaimer:
This analysis is intended solely for informational and educational purposes. It does not constitute investment advice or a recommendation to buy or sell any financial instrument. Market participants are strongly encouraged to conduct their own due diligence or consult with a certified financial advisor before making any investment decisions.
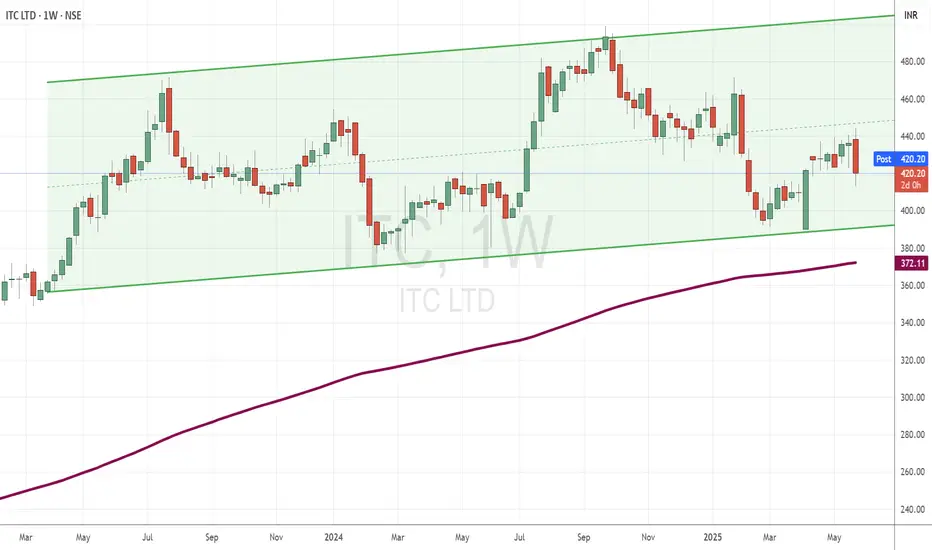
ITC Approaches Key Support Within Mild UptrendTopic Statement:
ITC is trading in a range with a slight bullish tilt, presenting structured opportunities within a defined channel.
Key Points:
* The stock is moving within a slightly bullish up-trending channel, making it suitable for channel-based trading
* A head and shoulders candlestick pattern is emerging, which may signal potential short-term weakness
* The price is nearing the 180-day EMA, making levels near or below it attractive for long-term buying opportunities
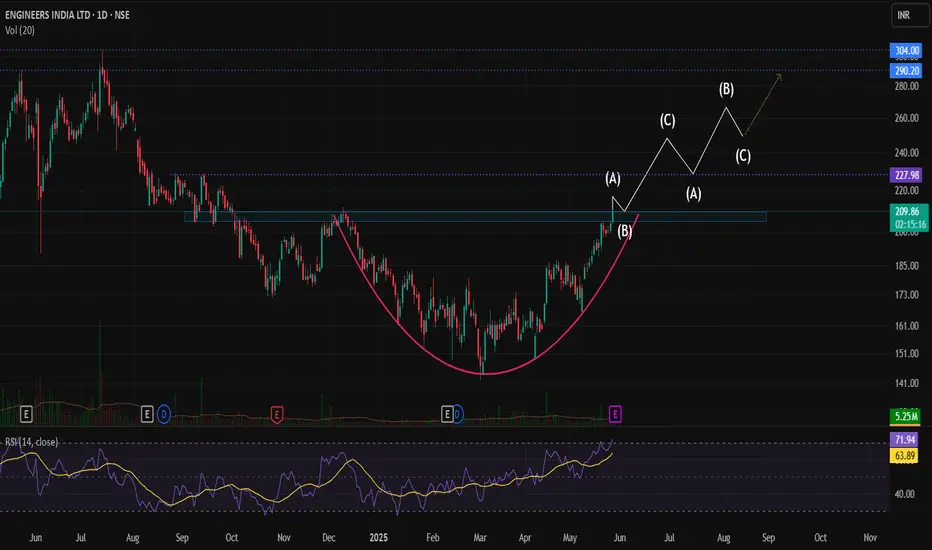
Rounding bottom pattern in Engineers IndiaRounding bottom pattern formed in Engineers India. After breakout, it can extend its move to 260, 290 and 300 in the mid to long term.
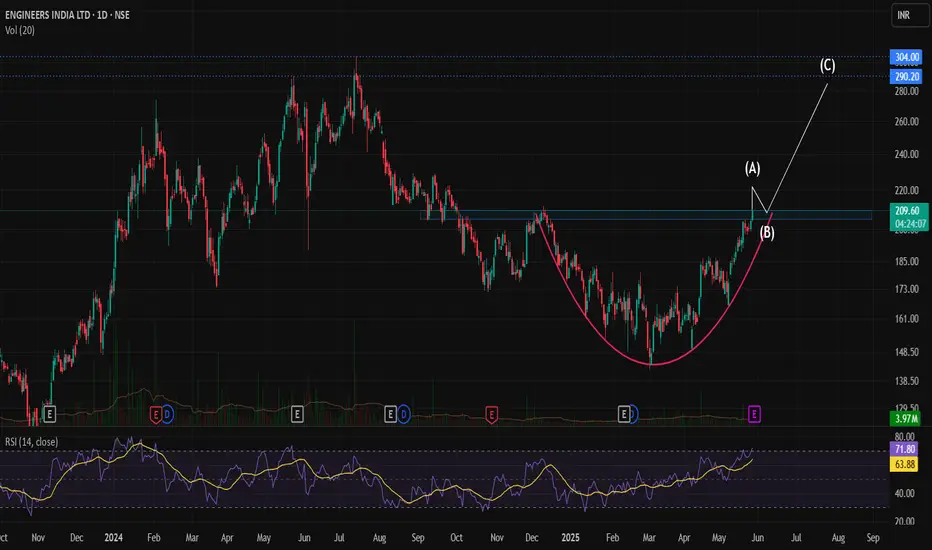
Engineers India – Technical Analysis & Trade SetupEngineers India Ltd has recently formed a rounding bottom pattern on the chart, a classic bullish reversal pattern that suggests a shift in momentum from bearish to bullish. The key resistance level lies at ₹210-212 price zone, and a breakout above this level with strong volume will confirm the pattern.
📈 Breakout Confirmation & Retest Zone :
A decisive close above ₹212 will mark a technical breakout, putting the stock at its 8-month high. Post-breakout, a retest of the ₹205–₹210 zone is likely. If the stock takes support and consolidates in this zone, it will indicate strength and readiness for the next upward leg.
📅 Fundamental Trigger – Q4 Results :
Investors and traders should closely monitor the Q4 results scheduled for 29 May. A strong earnings report could serve as a catalyst to support the technical breakout and sustain the uptrend. Conversely, a weak result may delay or invalidate the breakout momentum.
🎯 Targets & Price Action Outlook:
- Short-term buying range: Between ₹210 and ₹215.
- Immediate target: ₹250
- Next targets: ₹290 and eventually ₹300, which may take 3–4 months to achieve if the trend sustains.
- Stop loss can be placed at ₹185.
⚠️ Key Points to Watch:
- Volume confirmation on breakout above ₹212.
- Retest and support around ₹205–₹210.
- Q4 earnings impact on price action.
- Keep a disciplined stop-loss strategy based on risk appetite.
L&T Maintains Bullish Momentum Within a Rising ChannelTopic Statement:
L&T is in a strong bull run, consistently moving higher within a clear uptrending channel.
Key Points:
The stock is moving upwards in a bullish uptrending channel, making channel-based trading straightforward
It continues to gain momentum as it respects the channel boundaries
The price has overextended above the 200-day EMA, suggesting the stock is highly overbought and may face short-term resistance

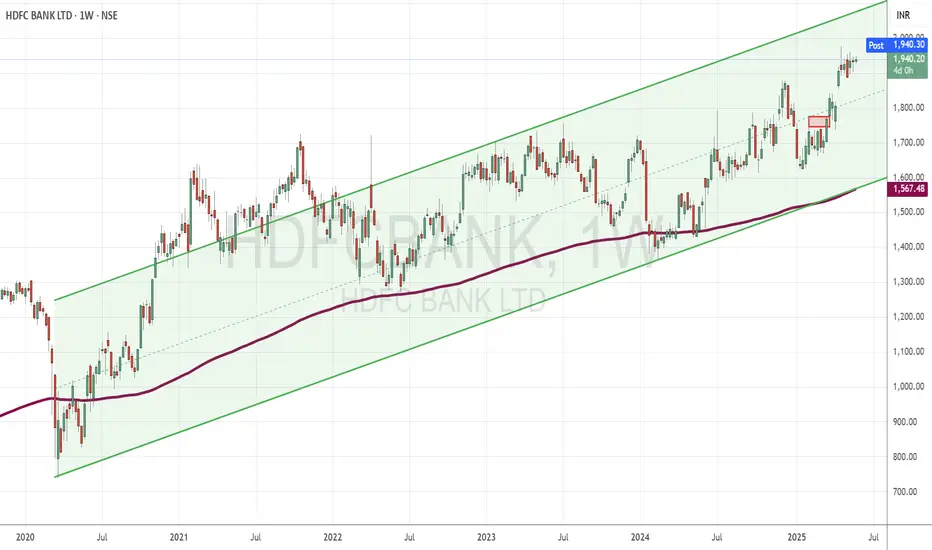
HDFC Bank Surges to Lifetime High Within a Defined Bullish ChannTopic Statement:
HDFC Bank is on a strong bull run, steadily climbing within a well-defined uptrending channel.
Key Points:
* The stock is trading within a bullish uptrending channel, offering clear opportunities for channel-based trading
* It is currently at its lifetime high, reflecting strong investor confidence and momentum
* The price has significantly overextended above the 200-day EMA, indicating the stock is highly overbought and may be due for consolidation or a pullback
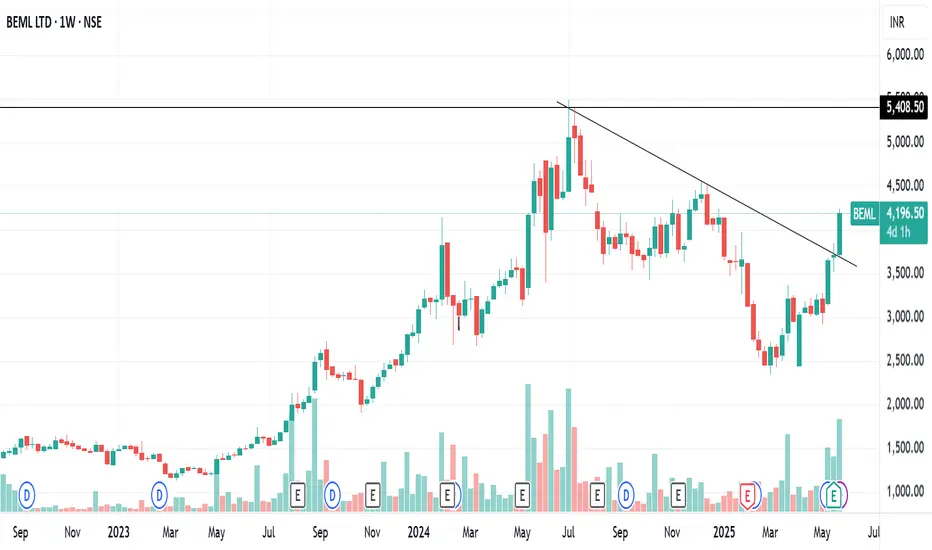
BEML WEEKLY TRENDLINE BREAKOUTBEML is giving trendline breakout weekly basis
huge volume building up last few weeks
bullish RSI,trading above all key ema
target 4600-4800-5400
DO YOUR OWN RESEARCH BEFORE INVESTING
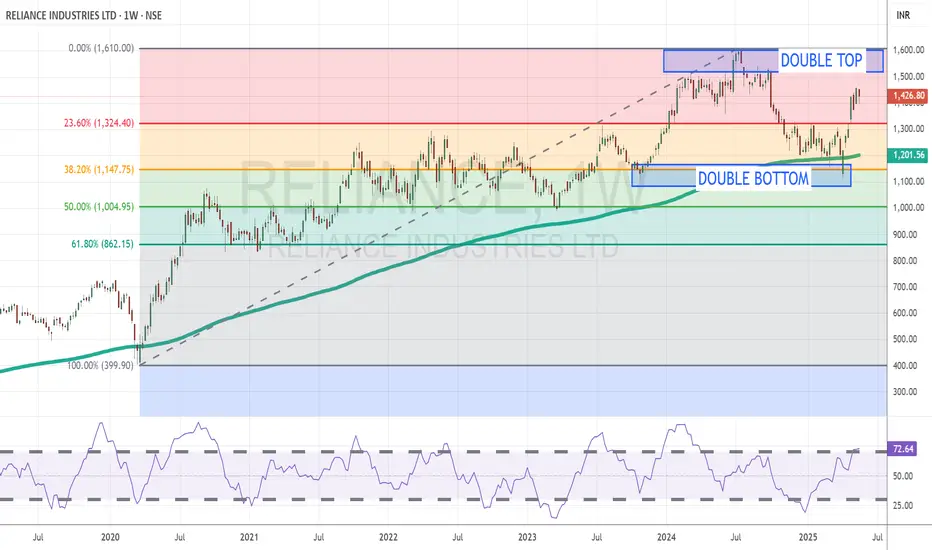
Reliance Nears Lifetime High After Rebounding Strongly from TechTopic Statement:
Reliance is in a strong bullish phase, continuing its recovery momentum after a solid technical reversal.
Key Points:
The stock reversed sharply from a double bottom pattern at the 38.2% Fibonacci retracement level, offering strong support.
It received an additional bullish push at the 23.6% level, reinforcing upward momentum.
The price is approaching its lifetime high of 1161, where a double top formation is likely and could act as a profit-booking zone due to expected resistance.
Now trading above the 180-day EMA, the stock is technically overbought, suggesting a potential pause or pullback near the peak.
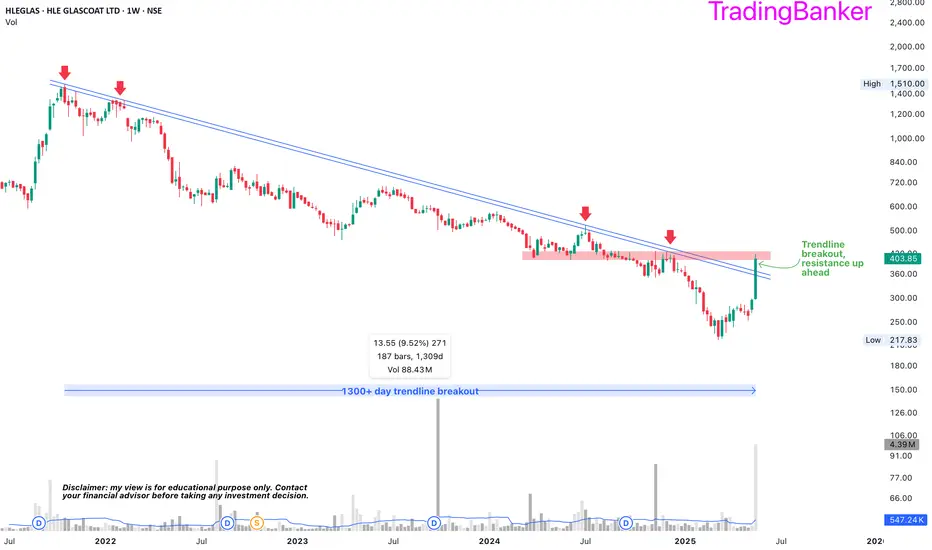
HLEGLAS: breakout after 1300+ days➡️strong closing above 50 ema (weekly)
➡️trendline breakout after 1300+ days
➡️improving cash from operations
➡️increase in FII+DII holding
Cons:
➡️Almost a third of fixed assets are intangible
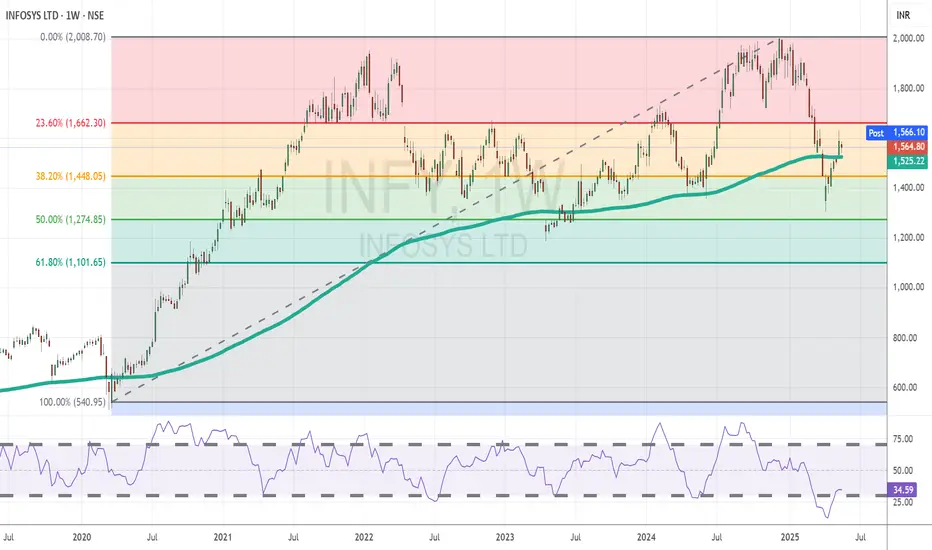
Infy Attempts Breakout After Rebounding from Key Fibonacci SuppoTopic Statement:
Infosys is showing signs of a steady recovery after a deep correction, though key resistance levels still challenge the upward momentum.
Key Points:
The stock found strong support at the 50% Fibonacci retracement during the recent correction, indicating solid buying interest at lower levels.
As the price recovers, the 23.6% Fibonacci level is acting as resistance, slowing the upward move.
Trading just above the 180-day EMA, Infosys remains technically oversold, hinting at continued recovery potential if resistance is breached.
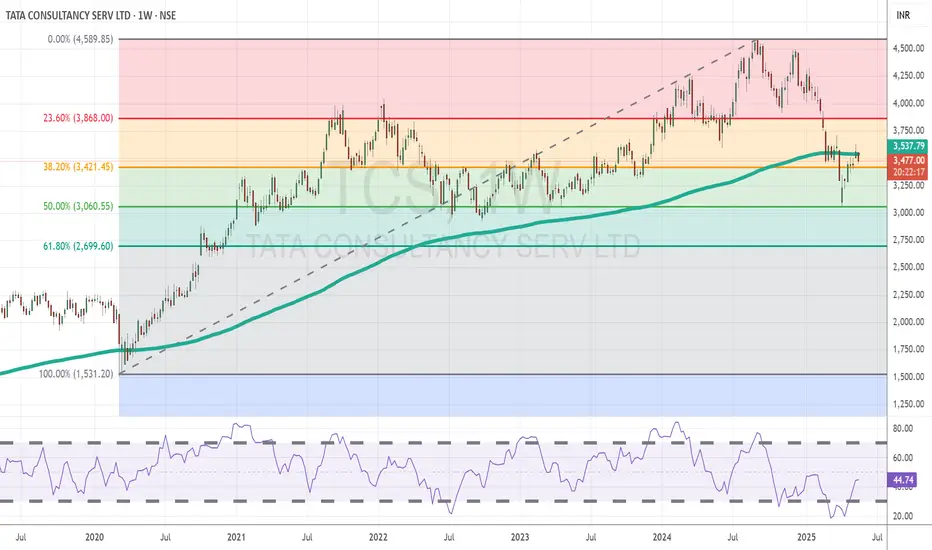
TCS Eyes Recovery After Holding Strong at Key Support LevelsTopic Statement:
TCS has shown signs of recovery after a recent correction, with strong technical support levels reinforcing bullish potential.
Key Points:
The price previously found strong and consistent support near the ₹3000 mark, reaffirmed during the recent market correction.
A full retracement to the 50% Fibonacci level** at ₹3060 attracted significant buying interest, highlighting renewed strength.
Currently, the stock trades just below the 200-day EMA, indicating it remains in oversold territory, but with potential for reversal if momentum continues.
XAUUSD ( Gold ) Chart Analysis (XAUUSD 1H Timeframe) Chart Analysis (XAUUSD 1H Timeframe) – Quick Summary:
Pattern Breakout: A breakout has occurred from a descending triangle (wedge-like) resistance, confirmed by strong bullish candles.
Golden Crossover: Noted clearly on the chart – the 50 EMA has crossed above the 200 EMA, which is a classic bullish signal.
Volume Confirmation: Price surged with volume (assumed from price momentum), validating the move.
Trend Support: Price is respecting the rising trendline and forming higher highs.
Immediate Resistance Zone:
Around $3,434 – $3,435 (marked on chart) – potential target.
Perfect Target:
Short-Term Target: $3,434
Next Target (if breakout sustains): $3,520+
Stop-Loss Suggestion: Below $3,260 (below breakout zone and EMAs).
Conclusion: As long as price stays above the breakout trendline and the EMAs, bullish continuation is expected. The first solid target is $3,434, with potential extension toward $3,520 if momentum sustains.

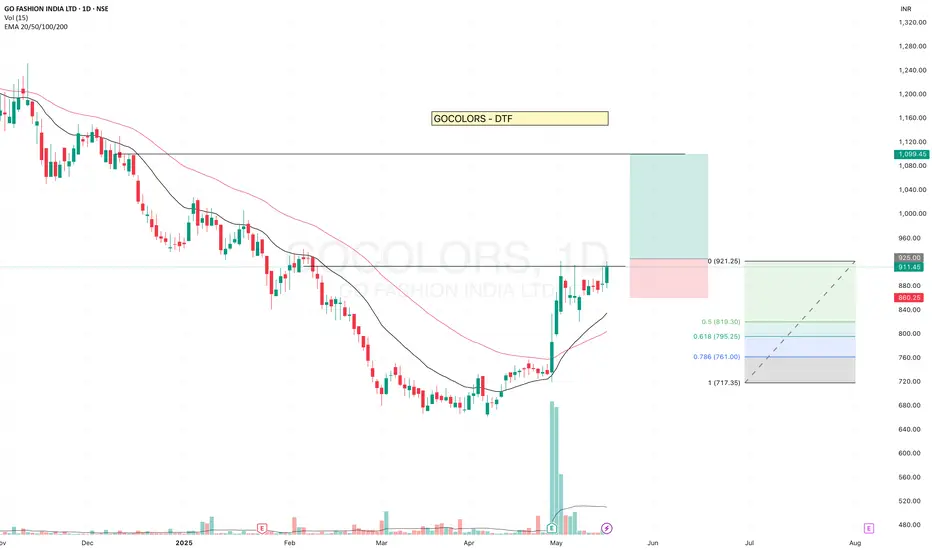
GOCOLORS - Getting ReadyGOCOLORS is getting ready and has been testing the resistance level.
- It is consistently trading above the 20 EMA. Recent high-volume candles suggest clear institutional participation. Although volume is currently drying up, the price is sustaining — a positive sign.
- The stock reversed after touching the 0.5 Fibonacci retracement level, indicating strength.
✅ If you like my analysis, please follow me as a token of appreciation :)
in.tradingview.com/u/SatpalS/
📌 For learning and educational purposes only, not a recommendation. Please consult your financial advisor before investing.
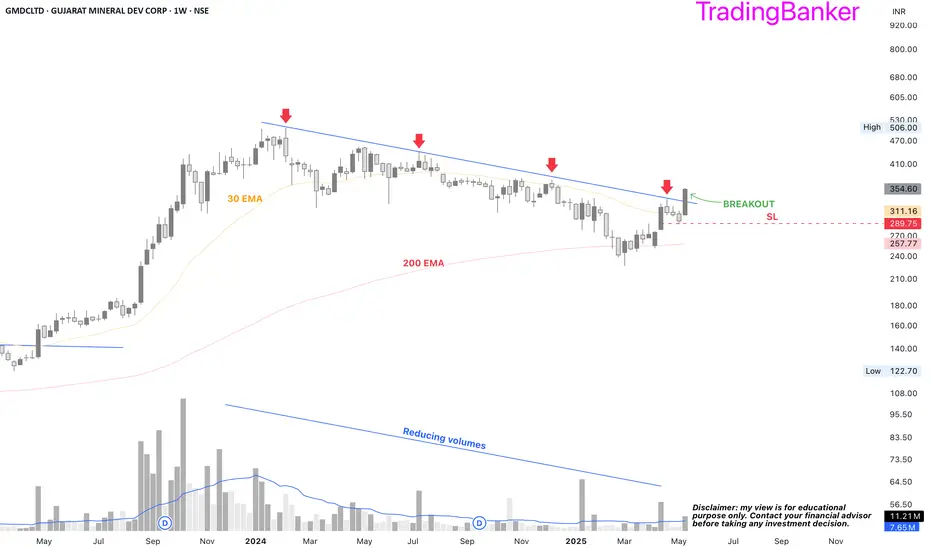
GMDC: a probable long🔸Trendline breakout
🔸30 EMA breakout
🔸Decent financials with 2nd highest ever sales and 3rd highest PAT
🔸Substantial promoter holding
🔸Increase in FII folding although marginal
🔸Capacity expansion underway would pave the way for the highest ever sales and PAT
🔸PE below the industry PE and PEG below 0.50
Nifty Reversal Watch: Key Demand Zones & Moving Average in FocusAs a pure technical analyst, I rely solely on what the charts reveal, ignoring the noise of news and fundamentals. Charts tell the story in advance.
As a demand and supply zone trader, my primary focus is on identifying key areas where institutional activity is likely to drive price action. Today, we’ll analyze the Nifty 50 through the lens of demand zones and then complement it with traditional technical analysis using moving averages. This analysis aims to provide clarity on potential reversal zones and market behavior.
📊 Demand Zones: The Foundation of Analysis
Monthly & Quarterly Demand Zones : On the monthly timeframe, I’ve identified a critical demand zone. When we zoom into the quarterly timeframe, this zone aligns perfectly, creating a high-confluence area. These zones represent institutional footprints (Banks, mutual funds, etc. ), indicating where smart money is likely to step in. These are not just traditional lines or boxes on the chart; they are the footprints of institutions that control the market.
Significance of Demand Zones : Demand zones are areas where buyers are expected to dominate, often leading to price reversals. The confluence of monthly and quarterly demand zones increases the probability of a strong support level.
Current Price Action : Nifty is currently hovering near these demand zones, suggesting a potential bottom formation.
📊 Traditional Technical Analysis: Moving Averages
Now, let’s analyze the market through the lens of traditional technical analysts who rely on moving averages.
EMA 20 on Monthly Timeframe : The 20-period EMA on the monthly chart acts as a reliable support level historically. Since 2004, price reversals have consistently occurred near this moving average, marked by green circles on the chart.
EMA 20 as a Magnet : The EMA 20 on the monthly timeframe is equivalent to the 400-period EMA on the daily timeframe, representing the average price of almost 400 days. In trending markets, price always reverts to its average, making this a critical level to watch.
Historical Exceptions : While there are rare instances (marked by red circles) where Nifty has broken below the monthly EMA 20, the presence of demand zones adds an extra layer of support, reducing the likelihood of a significant breakdown.
Current Price Action : Nifty is currently near the monthly EMA 20, which coincides with the monthly and quarterly demand zones.
📊 Combining Both Approaches
High-Confluence Area : The alignment of monthly and quarterly demand zones with the monthly EMA 20 creates a high-confluence area. This increases the likelihood of a strong support level and a potential Bottom.
Risk Management : While the setup appears promising, it’s crucial to manage risk effectively. Always use strict stop-loss orders and avoid over-leveraging. Even high-probability setups can fail, especially when market sentiment is overwhelmingly negative.
📊 Conclusion
The Nifty 50 is at a critical juncture, with multiple technical indicators pointing towards a potential reversal or consolidation. The confluence of demand zones and the monthly EMA 20 provides a high-probability setup. However, always remember that no setup is foolproof, and risk management is crucial, it’s essential to remain cautious as markets can sometimes defy all technical setups.
This analysis is purely for educational purposes and is not intended as trading or investment advice. I am not a SEBI-registered analyst.
Lastly, thank you for your support.
"The market is a master of patience; trade with discipline, not emotion." 🚀📊

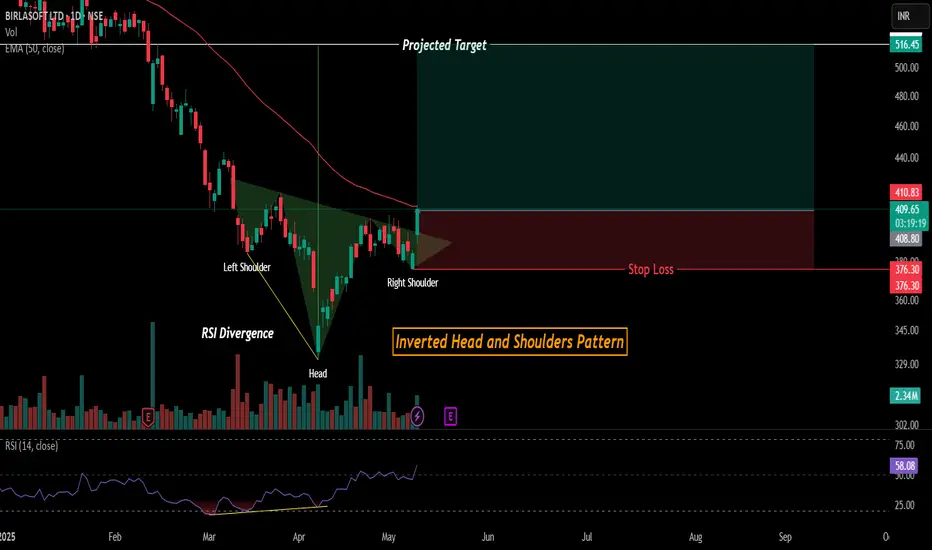
Trend Reversal setup in BSOFT(Inverted H&S Pattern)!Birlasoft (NSE:BSOFT) – Bullish Reversal on Inverted Head & Shoulders
📌 Technical Pattern: A classic Inverted Head and Shoulders pattern is forming, suggesting a potential reversal from the recent downtrend.
✅ Key Highlights:
RSI Divergence at the head hints at waning bearish momentum and potential reversal.
Price is testing the neckline zone; a breakout could confirm the bullish setup.
50-period EMA (~₹452) remains overhead, acting as a dynamic resistance.
📈 Target: ~₹516, calculated from the pattern height.
🔻 Stop Loss: Near ₹376, just below the right shoulder structure.
🧠 Strategy Note: A sustained close above the neckline, preferably on volume, can offer a strong risk-reward trade setup. RSI currently at 58 supports bullish momentum continuation.
Disclaimer: Consider my analysis for educational purposes only.
Before entering any trade:
1️⃣ Educate Yourself – Understand market dynamics and technical patterns.
2️⃣ Do Your Own Research & Analysis – Never rely solely on external opinions.
3️⃣ Define Your Risk-Reward Ratio – Ensure your trade aligns with your risk appetite.
4️⃣ Never Trade with Full Capital – Always manage risk and preserve capital.
Trade wisely! ✅📊
Trend Reversal setup in HCLTECH(Inverted H&S Pattern)!HCL Technologies (NSE:HCLTECH) – Bullish Reversal Setup
📌 Pattern Identified: A clear Inverted Head and Shoulders formation is visible on the daily chart, indicating a potential bullish reversal.
✅ Key Observations:
Price has broken above the neckline and also crossed the 50-period EMA, showing strength.
Notable volume buildup at the right shoulder, supporting the bullish move.
RSI is above 60, suggesting improving momentum.
📈 Projected Target: ~₹2,074 based on the pattern's height.
🔻 Stop Loss: Placed slightly below the right shoulder near ₹1,537.
⚠️ Watch Levels:
₹1,696: Minor resistance.
₹1,780: Key resistance level before the target zone.
📝 Conclusion: A breakout above the neckline with volume confirms the bullish pattern. As long as the price sustains above the stop loss, the risk-reward appears favorable.
Disclaimer: Consider my analysis for educational purposes only.
Before entering any trade:
1️⃣ Educate Yourself – Understand market dynamics and technical patterns.
2️⃣ Do Your Own Research & Analysis – Never rely solely on external opinions.
3️⃣ Define Your Risk-Reward Ratio – Ensure your trade aligns with your risk appetite.
4️⃣ Never Trade with Full Capital – Always manage risk and preserve capital.
Trade wisely! ✅📊

BSE This is intended solely for educational purposes. The BSE stock is experiencing strong growth, trading above key moving averages such as 200, 150, and 50. Considering the trend, there is a high probability of further upward movement. However, trade with a stop loss to manage risk effectively.

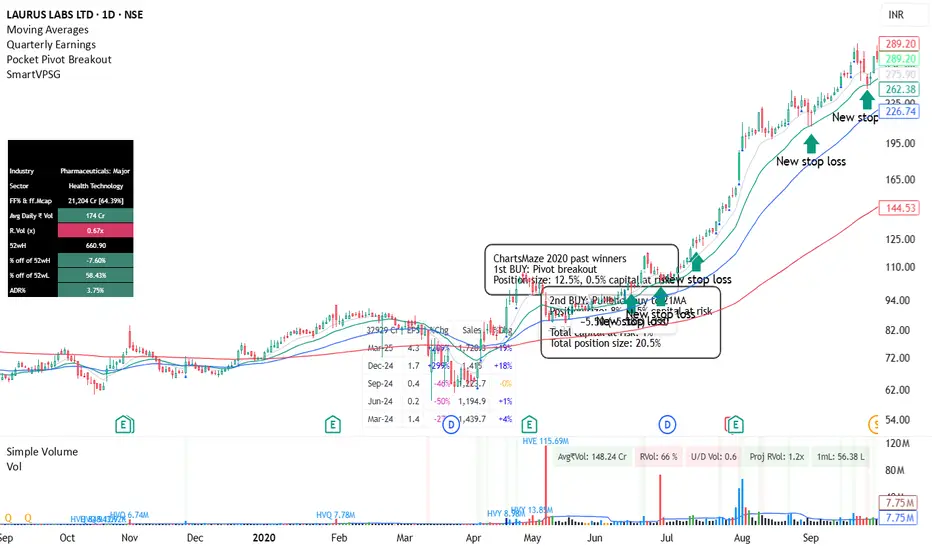
LAURAS LABS 2020 PAST WINNERThis is just for educational purposes, as I believe studying past winners helps you prepare for the next bull run and understand how winning stocks behave. I have marked the entry points so that you can see how many entries multibagger stocks typically provide.
BULLISH**Moving Averages – Daily (50, 100, 200):**
I have tested using the daily timeframe with 50, 100, and 200 simple moving averages.
Currently, there’s a huge gap between the CMP (3318) and the 50 DMA (3058).
**Support and Resistance Levels:**
- Resistance: 3500 (All-Time High)
- Support: 3245, 3168, 3058, 2957
Interestingly, 3058 is a strong level — it matches both moving average and support levels.
**Overall View:**
Gold looks bearish, but **don’t short it**.
Either:
- **Buy now** with high margin protection till 3058, **or**
- **Wait for 3058** to take a fresh entry.
---

CAMS, C&H BREAKOUT DONECAMS sustaining above 200EMA after Cup & Handle breakout done. Buy CAMS futures till 3930 for target of 4500/4650 and 4800.
keep suitable stop below 3830 on closing basis.
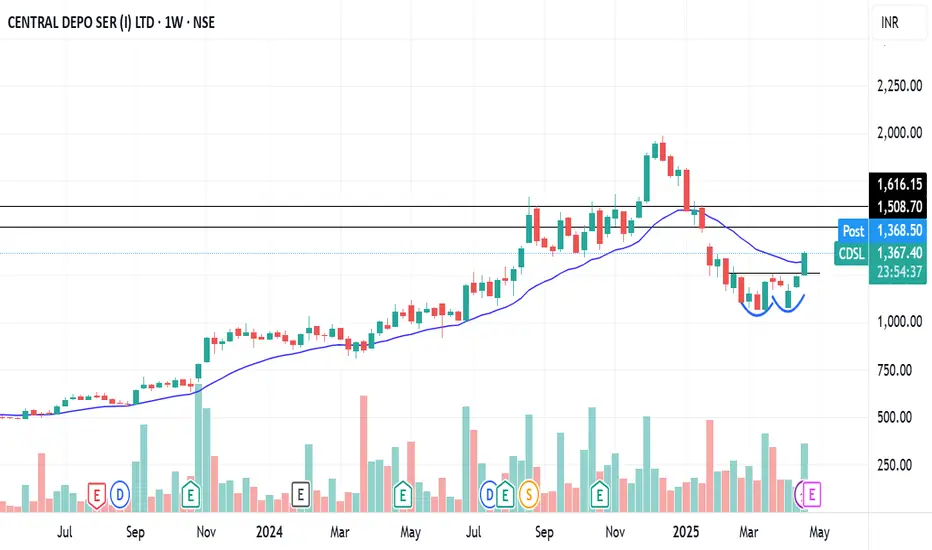
CDSL DOUBLE BOTTOM BREAKOUTCDSL breaking double bottom reversal pattern weekly
with huge volume,rsi positive zone
on the verge of MACD crossover
breaking 20 ema
after breaking 1400 with good volume
#target 1500 then 1600
NO BUY/SELL RECOMENDATION