Tata Consumer: Healthy Correction Within an Uptrend Topic Statement:
Tata Consumer has undergone a healthy correction while maintaining its position within a broad up-trending channel, offering clear opportunities for channel trading.
Key points:
1. The stock is moving in a broad up-trending channel, making channel trading easy.
2. The stock receives heavy support when approaching or touching the 180-day moving average.
3. The company reported a 6% profit decline QoQ in the third quarter.
Moving Averages

NIfty 23200 important Support swing tradeHello,
Nifty Retrace more than 50% of previous swing high and now at trendline support RSI oversold with slow selling volume is not active on sellers side also hidden divergence and oscilators are bullish bullish reversal possibilities with stop loss of 23180

Divi's Laboratories - Stable PerformerTopic Statement:
Divi's Laboratories has shown resilience amidst the broad market correction, with stable price movements and potential for accumulation near the 180-day moving average.
Key points:
1. Company reported a profit growth of 64% QoQ for the third quarter.
2. Price broke down from the up-trending channel, transitioning into a sideways pattern.
3. Strong resistance is present at the 6000 level.
4. The stock repeatedly approaches the 180-day moving average, presenting a good buying opportunity.

Price Action vs. Indicators: Which Strategy is Better?Price Action vs. Indicators: Which One Works Better?
Hello everyone! I hope you're all doing great in life and in your trading journey. Today, I bring an educational post on a widely debated topic in the trading community— Price Action vs. Indicators . Some traders swear by naked charts , while others rely on technical indicators for trade decisions. But which one is better? Let’s break it down!
Price Action vs. Indicators: Key Differences
Trading Approach:
Price Action Traders analyze candlestick patterns, trendlines, support & resistance without using indicators.
Indicator Traders use tools like RSI, MACD, Moving Averages to identify trade setups.
Speed & Responsiveness:
Price Action provides real-time signals based on raw market movements.
Indicators are often lagging , meaning they react after the move has started.
Simplicity vs. Confirmation:
Price Action is clean and simple , but requires deep understanding.
Indicators offer confirmation but can clutter charts if overused.
Market Adaptability:
Price Action adapts well to all market conditions .
Indicators can be less effective in ranging or choppy markets .
Who Uses It?
Scalpers & Intraday Traders prefer price action for quick decisions .
Swing & Position Traders often combine indicators with price action for confirmation.
Which One Should You Choose?
✔ Use Price Action if: You prefer a clean chart and want to react directly to price movement.
✔ Use Indicators if: You like structured trading signals and need extra confirmation.
✔ Hybrid Approach: Many traders combine both methods for better accuracy—price action for direction, indicators for entry signals.
Outcome:
Both Price Action and Indicators have their strengths. The key is to find what suits your style, test strategies, and stay consistent.
What’s your favorite trading method? Price Action, Indicators, or Both? Share your thoughts in the comments!

Asian Paints: Oversold with Recovery Potential Topic Statement: Asian Paints has faced a sharp decline due to weak third-quarter results, but strong support levels suggest a potential recovery ahead.
Key Points:
1. The company reported a profit decline of 23.5% QoQ in the third quarter.
2. The stock price fell sharply, creating a gap after the earnings announcement.
3. The price is taking heavy support at the 61.8% retracement level at 2260.
4. The stock is overextended below the 180-day moving average, making it highly oversold.
5. The weekly MFI is at 22, further confirming oversold conditions.

MUTHOOTFINThe chart is self-explanatory and shared for educational purposes.
The most prominent feature is the clear upward-trending channel that the stock price has been respecting. This is a significant bullish indicator, suggesting consistent upward momentum. The recent price action shows the stock price touching the bottom of the channel line. This suggests a potential bounce-back towards the upper channel line, further reinforcing the bullish sentiment implied by the channel.
The alignment of the 50-day, 150-day, and 200-day moving averages, with the 50-day being highest, followed by the 150-day, and then the 200-day, is often considered a sign of a potential upward trend.
Risk Management: Always use stop-loss orders to manage potential losses.

NIfty at Channel & 200Ema support in 15 minsHello,
Nifty spot made high around 23800 after the 2025 budget now delhi elections exit polls and some selling there nifty in 15 mins trading at near channel support and there is Ema 200 line along with slow selling volume is not seen as needed for short opportunity RSI adjusting and oversold in 15 mins overall bullish set up forming.

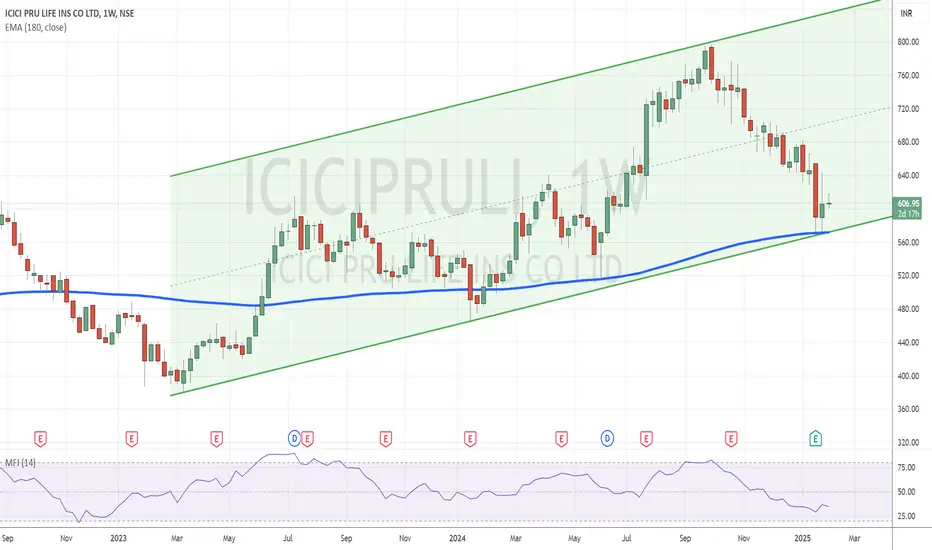
ICICI Prudential: Oversold and Poised for Recovery Topic Statement: ICICI Prudential Life Insurance has made a healthy correction, positioning itself near strong support levels within an up-trending channel.
Key Points:
1. The company reported a robust 43% profit growth QoQ.
2. The price is moving in an up-trending channel, providing clear trading opportunities.
3. The stock is taking support at the lower end of the channel, indicating oversold conditions.
4. The price is near the 180-day moving average, reinforcing the oversold status.
5. Weekly MFI is at 34 which also indicates the price being oversold.
NIfty Above 200EMA No Look Back Hellow,
Nifty formed RSI Positive divergence in Daily with falling wedge pattern near Resitance once brewk 23700 then resistance 24200,24500,24800

Tata Motors: Oversold and Near Support for Potential ReversalTopic Statement: Tata Motors has experienced a significant correction in recent months, approaching a crucial support level that could signal a potential turnaround.
Key Points:
1. The stock has corrected to the 61.8% retracement level, suggesting strong support at the current price level.
2. The price is near the 180-day moving average, indicating oversold conditions.
3. Weekly MFI is at 30, further confirming the stock is oversold.
4. The company reported a profit decline of -22% QoQ for the third quarter, which may cause the price to fall further, even below the 61.8% level.

Analyzing Silver's Price Action: Educational Trade IdeaShort Bias Setup:
Entry: Wait for the price to retest the descending trendline (~$31.50) and fail to break above it.
Target: $30.00 (initial), followed by $28.50 if momentum persists.
Stop Loss: Above $32.00 to protect against a trendline breakout.
Alternative Long Opportunity:
Entry: A confirmed breakout above the trendline with high volume (~$32.20).
Target: $33.50 (resistance level) and beyond if the trend reverses.
Stop Loss: Below $31.00 to minimize risk.

SUPRIYA Life Science Looking good Supriya Life Science is looking Strong From Here, by Price Action buy At 710 in my point, it's bullish. From here

MSFT Support on Weekly MA20, $515 Price TargetMSFT hasn't missed an earnings since before 2024.
Weekly chart looks strong. On the 1 hour you can see they went low for a last liquidity grab.
ER tonight if positive reaction can make the stock go to 480-500
This feels all around bullish to me and they are also to announce partnership progress in AI projects.
NFA - I went with August contracts.
Good luck

Dixon Technologies Near Oversold Levels After Trendline BreakDixon Technologies (India) Ltd. has recently faced a heavy selling pressure triggered by the third quarter earnings results. The stock reported a whopping profit growth of 122% QoQ. Investors should monitor the stock's performance closely to identify optimal entry points.
Key Points:
1. Uptrend Line Breach: The stock has broken below its established uptrend line, signaling a possible change in trend direction.
2. Potential Sideways or Corrective Movement: This breach suggests that the stock may enter a period of sideways movement or further correction.
3. Proximity to 180-Day Moving Average: The current price is near the 180-day moving average, indicating an oversold condition.
4. Buying Opportunity: Purchasing the stock near or below the 180-day moving average could be advantageous for investors.

NIFTY HAS BROKEN 50 WEMA WITH HEAD AND SHOULDER PATTERN COMPLETEnifty has broken 50 weekly EMA
formed a head and shoulder or triple top pattern at in an attempt to retest the EMA from under and retest completion done.
sell at cmp 22880 22900
target 22550 22500
sl above 23000

IREDA CMP 207 Weekly Chart Forming Parallel channelIREDA is forming Parallel Channel on Weekly chart.
RSI 14 is going up slowly. Price is trying to cross 20 EMA line on weekly basis.
Resistance around 229-234, 260-264 and ATH 310
Support 189, 170
Target 1 : 310
Target 2 : 540++
Probable Time Period : 3-5 Months

HDFC Bank Oversold with Strong Support Levels Topic Statement: HDFC Bank's 3% QoQ profit growth has been overshadowed by its oversold stock price, which is under the 180-day moving average but has found strong support at the 50% retracement level and the critical ₹1600 mark.
Key Points:
1. Reported a profit growth of 3% QoQ.
2. Price has received decisive support at the 50% retracement level.
3. The price point of ₹1600 is a critical support level.
4. Stock is trading below the 180-day moving average, making it oversold.

MAXHEALTH Bearish ViewAll higher time frames are bearish.
MACD, RSI Indicators shows bearish view.
C Wave of may start.
Price Action below 100 EMA

Newgen in Blue Sky.NSE:NEWGEN showed a strong upmove today Crossed Key Levels and Hit an all-time high, with RSI bouncing back Sharply again.
Trade Setup:
It can be a Good 1:1 RISK-REWARD Trade for Aggressive Swing Trader.
For Postional Trade let it cool down a bit and then try to enter at swing low.
Target(Take Profit):
1977 will be Levels for Swing/Positional Trader.
Stop-Loss:
Around 1534.15 For Swing Trade and Positional Trader.
📌Thank you for exploring my idea! I hope you found it valuable.
🙏FLLOW for more
👍BOOST if useful
✍️COMMENT Below your views.
Meanwhile, check out my other stock ideas below until this trade is activated. I would love your feedback.
Disclaimer: This analysis is intended solely for informational and educational purposes and should not be interpreted as financial advice. It is advisable to consult a qualified financial advisor or conduct thorough research before making investment decisions.

Ashapura Minechem - All Time Breakout after 17 yearsAshapura Minechem has give ATH breakout after 17 years. Technically this stock can go to whooping 24500. Other factors:
1. 3rd largest producer of Bentonite in the world
2. Promoters have increased stake
3. Electrification, E-cars, Solar panels gives huge opportunity
4. Technically, has given breakout after 17 years
5. Has done a retracement of ~55% from its high price before moving up and giving a breakout
6. Monthly volumes have been steady
Looking at the above parameters and opportunities ahead, this stock is poised to move up to our immediate targets and a big buy for longterm.
Keep this stock in your radar. Keep following @Cleaneasycharts as we provide Right Stock at Right Time at Right Price.
Cheers!!

INFY Declares Q3 Earnings Amid Market PressureTopic Statement: Despite posting healthy Q3 earnings with profit growth of 11.6% QoQ, INFY's stock experienced a significant decline, signaling potential further corrections.
Key Points:
1. Stock dropped 6% after announcing Q3 earnings, creating a gap.
2. Candle broke the 23.6% retracement level.
3. Price may fall to the 38.2% retracement level, a previous support in November.
4. Price is near the 180-day moving average, indicating oversold conditions.
5. If the price reaches the 38.2% level, it will be under the 180-day moving average.

Asian PaintA leader in its sector seeing so much competition, that it quarterly reports are in negative. Growth for this company has come to an halt, trading below 200 moving average, no new customers...difficult to see this 😅
just want some ideas what to do with this stock??

BSE TRENDLINE BREAKOUTBSE breaking trendline resistance
in this #stockmarketcrash
good volume,breaking 20 ema
strong rsi,rsi divergence
#target 5830 after breaking 5500
sl 5000
NO BUY/SELL RECOMENDATION
