Solana Technical Reversal: MA Compression Resolves to the UpsideSolana is trading around 126 levels and there is a support which is being respected around 125 levels.
For last few weeks, no considerate candle is there. Only doji are being formed which shows the sideways moment in the charts.
If the market cycle changes, turning bullish, an entry can be made above 127 levels expecting a 10-11% movement in the crypto.
Major trend is bearish, Minor trend sideways.
The major support is around 100-110 level zone and there is not much of fall to capture as it has fallen 50% since Sept 2025.
On the hourly charts, there is a liquidity grab, taking out the bullish positions created on previous occassions.
A moving averages gate is also being created on the hourly charts as all the four EMAs (20, 50, 100 & 200) are moving in small range.
Now as per my view the market is trading in a range and it is also respecting a falling resistance line. A good R:R trade is there on the bullish side.
As per the plan, bullish position can be created in the assest once it crosses 127 levels.
Stop Loss :- 122.5
Target :- 144
R:R = 1:4
Multiple confluence there to enter the trade on the bullish side. Wait for the price action near the levels before entering the trade.
Moving Averages

Resistance to support in Granules 540 levels have acted as good level of support which acted as resistance and now again as support.
Stock has taken support and seems ready to test all time high levels.
20 week SMA is also acting as support. Reward to risk ratio is working out favorable at 2.5.
With SL of about 7.5% position size should be controlled. Also this being weekly trade it can take 2 ~ 3 months to play out.

GODREJCP | Looks good for reversalGODREJCP | Looks good for reversal
Relatively a safe large cap bet

NIFTY 50 – Change Structure Break AlertPrice structure shifting from Higher High–Higher Low Lower High–Lower Low
50 EMA and SMA Crossover candle formed
Stay patient, avoid emotional trades, and trade only on confirmation.
⚠ DISCLAIMER
I am not a SEBI-registered analyst.
This trading plan is for educational purposes only and should not be treated as investment advice.
Always conduct your own analysis and follow strict risk management.
Hindalco looking bewildered. Plan to trade either side.Hindalco is forming a double top formation on the weekly charts, showing some weakness in the stock as the market is more time in recoverying the fall of one week.
The stock has been in a good up trend and has reached 850 levels forming a base around 560-600 level zone i.e. Approx 30-35% return in 9 months.
Since June 2022, Hindalco has not taken out the previous low and recent gave the break out of the previous ATH and retested it.
Major trend for the stock is still bullish and there is a probability of continuing the same if the recent is taken out with good volumes, support the bullishness of the stock.
Bullish Scenario (A good HLHH formation is there in the stock).
Enter above 870 levels
Stop loss :- 825 (5%)
Target :- 1012 (16%)
R:R = 1:3
Buying a stock above 870 gives a bullish signal and can captured with proper SL and target.
Bearish Scenario (A double top pattern, bearish RSI divergence and Weekly 20 EMA break down).
Entry below 830 levels
Stop Loss :- 866 (4%)
Target :- 770 (7%)
R:R = 1:1.75
The targets can be trailed upto the levels of 740 levels while trailing the SL logically.
Wait for the stock to form some setup for the either side momentum and trade in the direction of the market.

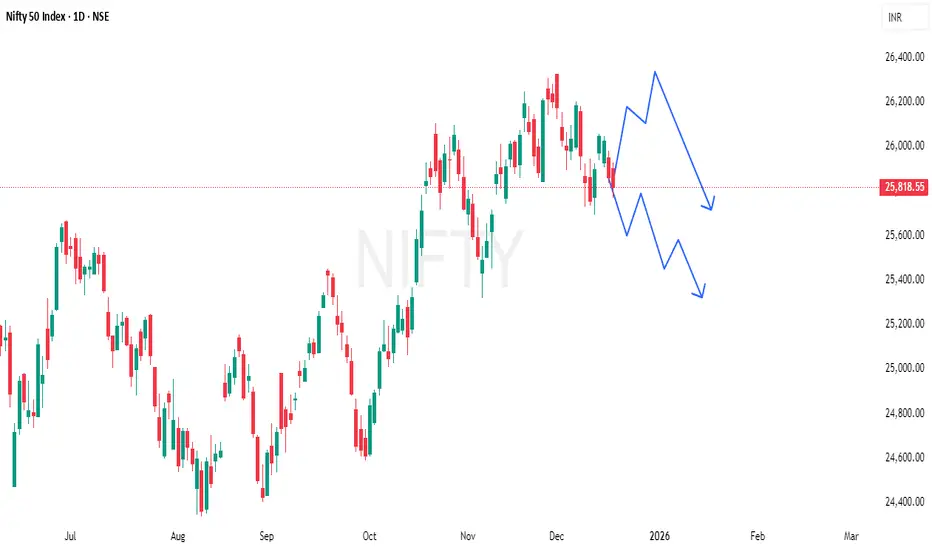
What coming for Nifty weekly Expiry??Today nifty clearly was supported by the 20 EMA on the daily charts while it tested its 60 minutes 200 EMA.
Though both the moving averages has given support to the index on intraday basis. Still a fall is being seen in the market as the index closed 225 points lower.
Head & Shoulder pattern formation on the charts is there which seem to take support from the neckline. If the market remains beaarish and tend to breach the lower levels a clear support is around 25700-50 levels.
While a rising wedge pattern in also there as per the technicals. RSI is showing bearish divergence and a Death cross over (20 & 50 EMA) is there on the hourly charts.
If the market tries to recover a good resistance zone in around 26040-60 levels.
A swing/positional trader can initiate an entry once the neckline is breached and retest the support levels.
Major Trend is sideways and same is the Minor trend of the index.
Bullish entry can be created around the levels, once a positive setup is there on the charts for a target up to the resistance levels.(For intraday play)
Wait for the price action near the levels before entering the trade.
No bearish trade can be initiated as there was a good for on the hourly charts and profit booking can be seen in the upcoming session.
Major Support Zone :- 25850-900
Resistance levels :- 26060, 26200
Patience is the key for a good trading setup to function. Plan as per the plan.

#Bajaj Finance Limited - BUY - Technical Analysis#Bajaj Finance Limited - #Technical Analysis
Price: 1,048.00
#Swing Trading Setup
Pattern: #Range #breakout with #consolidation above breakout zone. #Triangle/Box pattern breakout with target hit. Currently forming double bottom pattern.
Key Technical Points:
1. Range breakout & consolidating above breakout area
2. EMA's sorted & aligned - price trading above all EMAs
3. Triangle/Box pattern breakout - target achieved, now forming double bottom
4. Classic divergence in recent bounce area confirming retracement completion
Target Levels:
- Target 1: 1,103.80
- Swing Target 2: 1,155.00
- Grand Target: 1,225.00
Support: 1,026 - 1,018 (critical zone)
#Outlook
Strong bullish structure with potential upside of 10-17% toward targets. The double bottom formation suggests the retracement phase is complete. Price sustaining above ₹1,048 confirms continuation toward higher targets.
⚠️ DISCLAIMER
This is NOT investment advice. For educational purposes only. Stock trading involves substantial risk. Past performance doesn't guarantee future results. Always do your own research and consult a SEBI-registered financial advisor before investing. Author assumes no responsibility for losses.
#BajajFinance #StockMarket #NSE #TechnicalAnalysis #SwingTrading #IndianStockMarket #Trading #FinTwit #ChartAnalysis #StocksToWatch #TradingView #MarketAnalysis

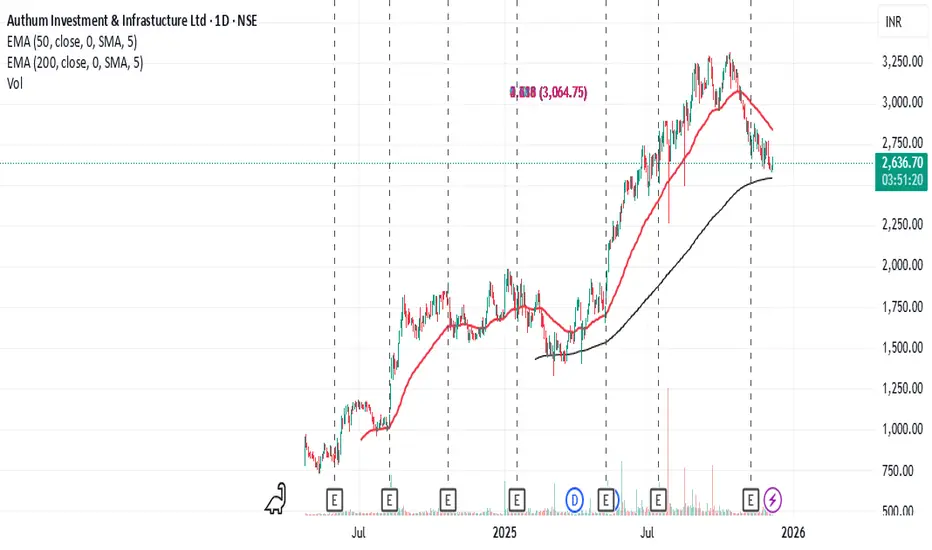
Authum Investment & Infrastructure- Next Swing Low PointAuthum Investment & Infrastructure is close to 200 days EMA and consolidating for next run. A dip below 2500 would be good price to watch and enter trade again.
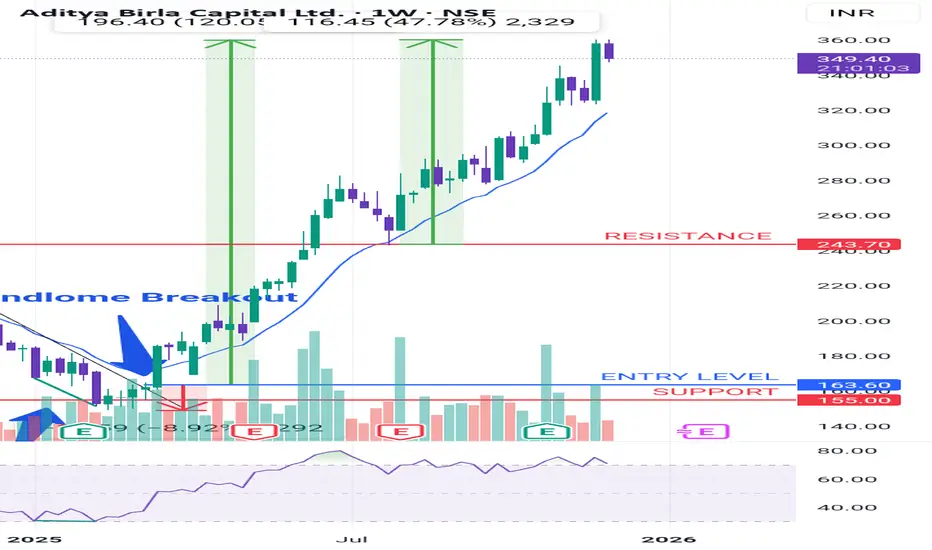
ABCAPITAL Trendline Breakout followed by Good RallyIn weekly chart of ABCAPITAL there was RSI Divergence in first quarter of Year 2025. It made a Trendline Breakout in second week of March 2025
And gave entry above breakout candle weekly close at 163.6 and then with a risk of 9% it gave one sided returns of Risk:Reward of 1:13
Curent Return at 120%
It retested resistance level of 243.7 which corresponded 21-EMA in july 2025 and again gave return of 45% from the resistance level
It is again forming a Bearish RSI Divergence. But bullish trend is intact till it gives a weekly close below 21-EMA
ICICI Bank — 200-DMA Rejection Keeps the Downtrend IntactMarket Context
ICICI Bank continues to trade inside a broad descending channel that has governed price since the 1500 peak. Every counter-trend rally has been corrective so far, and the recent recovery has shown the same character — overlapping candles, choppy subdivisions, and clear respect for channel resistance.
Key Technical Drivers
1. Rejection at the 200-DMA
The rally stalled exactly at the 200-Day Moving Average. This is the same zone where price lost momentum earlier, reinforcing that the long-term bias remains downward. A failed attempt to reclaim the 200-DMA in a corrective environment typically signals trend continuation rather than reversal.
2. Channel Resistance Still Untouched
Even though momentum carried the stock above short-term levels, the broader upper channel boundary continues to act as the main ceiling. Price behaviour near this level is corrective, not impulsive — another sign that the move is still part of a larger complex structure.
3. Structure Supports a Triple Zigzag (W-X-Y-X-Z)
This entire decline is best interpreted as a higher-degree W-X-Y-X-Z correction.
W bottomed at 1342.60
X rallied to 1445
Y bottomed at 1317.40
The ongoing rally fits well as the second X wave
Wave (c) of this X leg may be close to completion, but the subwaves allow room for a marginal push to retest the channel top before turning lower. Nothing in the current leg looks impulsive enough to suggest a larger trend reversal.
Trading Plan
Direction: Expect the next leg to unfold downward as Wave Z begins.
Target Zone: Break below 1317.40 is likely, with measured support near 1280–1300 at the lower boundary.
Invalidation: A sustained break above 1411.90 invalidates the bearish Z-wave view and opens the door for a trend reassessment.
Conclusion
The failed 200-DMA retest, corrective price structure, and channel resistance all point to the current recovery nearing exhaustion. Whether Wave X makes one more marginal high or not, the broader path remains lower toward the Wave Z terminal zone.
Disclaimer: This analysis is for educational purposes only and does not constitute investment advice. Please conduct your own research before taking any trading decisions.

EURUSD – Retesting Demand Zone for Potential Upside ReversalPrice has tapped into a well-defined HTF demand zone after a controlled selloff. The latest wick into the zone suggests absorption and potential willingness to push higher.
If the zone continues to hold, I’m expecting bullish orderflow to kick in, leading to a structure shift and an upward continuation toward the next liquidity pool.
Bullish Path:
• Sweep into HTF demand
• Hold above the blue line (micro support)
• Shift in structure
• Continuation toward upside inefficiencies
⚠️ ENTRY CONDITION (IMPORTANT):
I will take the trade only if the LTF replicates the same structure and confirmations I’m anticipating on the HTF. No LTF alignment = No trade.
The idea remains valid as long as price respects the demand zone and doesn’t close decisively below it.

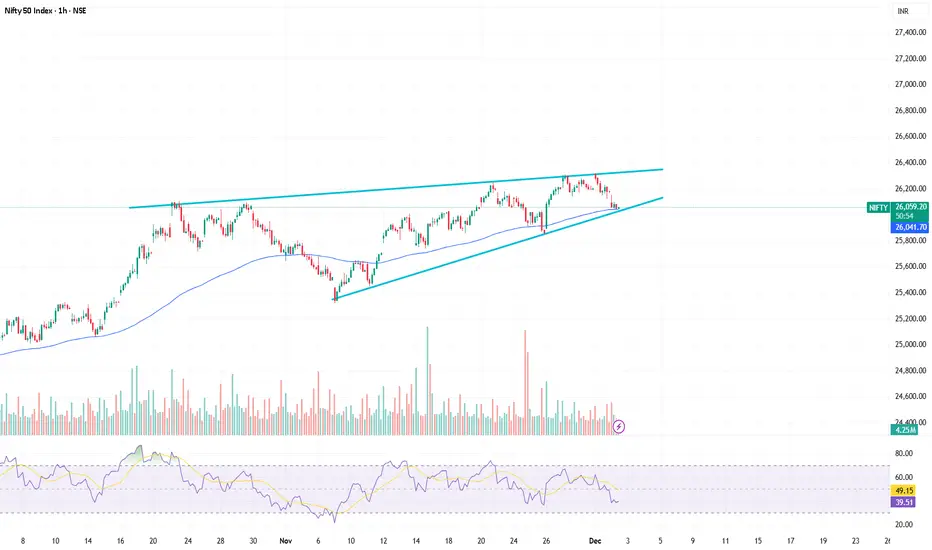
NIfty Hourly Strong SupportHello Friends,
Nifty Spot at 26050-60 having support of EMA100 along with trendline support and RSI oversold in hourly ......Overall Momentum is Bullish this is good DIP expceting 26400,26500,26700+ in coming few sessions
Welspun Living (W): Strongly Bullish, Policy-Driven BreakoutTimeframe: Weekly | Scale: Logarithmic
The stock has confirmed a major structural breakout from a 9-month consolidation. This move is backed by the highest volume in months and a significant government policy shift favoring the textile sector.
🚀 1. The Fundamental Catalyst (The "Why")
The massive volume surge (88M+) is a direct reaction to a convergence of positive news:
- New Labour Codes (Nov 21, 2025): The government's proposed new labour codes that allow more flexibility for textile companies (e.g., women working night shifts, overtime flexibility). This is a massive structural positive for labor-intensive companies like Welspun.
- Wedding Season Demand: Reports indicate a ₹6.5 Lakh Crore wedding season splurge, directly benefiting home textile demand (bedding, gifting).
- Earnings Turnaround: The Q2 results earlier this month showed a "surprise profit" and strong operational performance, creating a fundamental floor.
📈 2. The Technical Structure
> The Cycle: You correctly identified the cycle.
- Correction: Downtrend from Aug 2024 to April 2025
- Consolidation: Since April, it has been in a sideways base.
> The Breakout: The ₹146 – ₹148 zone has been a "Polarity Zone" (acting as both support and resistance) since Nov 2021 .
- The Move: This week's 9.13% surge decisively cleared this multi-year hurdle.
- The Volume: The volume of 88.37 Million is an "Ignition Bar"—it confirms that institutions are entering aggressively to ride the new policy tailwinds.
📊 3. Technical Indicators
Indicator analysis confirms the trend shift:
- Short-term EMA PCO: Confirmed on Daily & Weekly , signaling a synchronized uptrend.
- RSI: Rising across all timeframes, indicating that momentum is expanding and supports the breakout.
🎯 4. Future Scenarios & Key Levels
With the "lid" removed and policy support in place, the path of least resistance is up.
> 🐂 Bullish Target: ₹178 . This aligns with the previous major swing highs and is the immediate technical objective.
> 🛡️ Support (The "Must Hold"):
- Immediate Support: ₹146 . The breakout zone must now act as support. Any pullback to 146-148 is a high-probability "buy the dip" zone.
- Stop Loss: The level of ₹129 is a safe structural stop, but a close below ₹140 would be the first sign of weakness.
Conclusion
This is a Grade A setup since it's a technical breakout supported by a sector-wide policy catalyst (Labour Codes). The massive volume confirms smart money participation. Watch for the stock to hold above ₹146 .

SILVER MIC LONG TRADEWith Silver on up trend and breaking a pivot.
The marked levels in chart are good opportunities for taking 1:2 R:R
The demand zone formed is also in line with 50/ 21 moving average on daily.
#safer trades
#take proper position size as per risk management

IIFL Finance LimitedPrice is breaking out above a long consolidation range, but the move is short term overextended, so both upside continuation and a pullback retest are likely scenarios rather than a one way move. This is educational analysis, not personalized financial advice; position sizing and risk must match your own plan.
Trend and structure
• The chart shows IIFL Finance Limited breaking out above a broad sideways range, with current price near the upper boundary of that rectangle zone around the 570–580 area.
Moving averages
• The shorter moving averages (such as 20 and 50 day) are now sloping upward and positioned above the longer averages, which is typically a sign of emerging bullish momentum after a prior base.
RSI and momentum
• The daily RSI on the chart is in the higher band, showing strong positive momentum but also edging toward overbought territory where pullbacks or sideways pauses are common.

Motherson (W): Strongly Bullish, Post-Bonus Breakout(Timeframe: Weekly | Scale: Logarithmic)
The stock has confirmed a major structural breakout, emerging from a 7-month consolidation phase. This move is supported by a "Higher Low" structure, rising volume, and recent analyst optimism.
📈 1. The Structural Context (The Turnaround)
- The Adjustment (Context): It is important to note that the price levels (ATH ~₹144) reflect the 1:2 Bonus Issue that occurred in July 2025. The stock is now recovering from the post-bonus correction.
- The Cycle:
- Peak: ATH of ₹144.66 in Sep 2024.
- Correction: A downtrend lasted until April 2025 , finding a base.
- Reversal: Since April, the stock has shifted character, forming a clear series of Higher Lows , indicating steady accumulation.
💥2. The Breakout (This Week's Action)
- The "Lid" (Resistance Zone): The ₹113 – ₹116 zone has acted as a stiff resistance since Nov 2024. Breaking this level is significant.
- The Surge: This week, the stock decisively broke and closed above this zone with a 5.93% surge .
- Volume Confirmation: The move was backed by massive volume of 151.49 Million . Volume has been "drying up" since the ATH, so this sudden volume expansion is a classic "Ignition" signal.
📊 3. Technical Indicators
Indicator analysis shows a synchronized bullish trend:
- EMAs: Short-term EMAs are in a PCO (Price Crossover) state across Monthly and Weekly timeframes, confirming the trend is up.
- RSI: The Relative Strength Index is rising on both timeframes, showing momentum is building.
🎯 4. Future Scenarios & Key Levels
The breakout opens the door for a rally toward the previous highs.
- 🐂 Bullish Targets:
- Target 1: ₹132 . This is the immediate technical extension.
- Target 2: ₹145+ . If momentum sustains, a retest of the All-Time High is the structural goal. (Note: Some street estimates are as high as ₹162 ).
- 🛡️ Support (The "Must Hold"):
- Re-test Zone: The ₹113 – ₹116 zone has now flipped to support. A pullback to this level would be a healthy entry opportunity.
- Stop Loss: If the breakout fails (fakeout), the stock may slide to the ₹102 support zone.
Conclusion
This is a high-quality setup. The combination of Higher Lows , a Volume Breakout , and the Bonus Adjustment digestion makes this a strong candidate for a move to ₹132 . Watch for a sustained hold above ₹116 .

Kirloskar Oil Engines - Swing TradeKirloskar Oil Engines Limited - Technical Analysis Report
Current Market Price: 1,005.70
MARKET BIAS: BULLISH RECOVERY IN PROGRESS
Kirloskar Oil Engines is currently trading at 1,005.70, showing signs of bottoming out after a significant correction from its all-time highs of ₹1,450+. The stock is now forming a potential reversal pattern.
KEY TECHNICAL OBSERVATIONS:
1. Major Support Zone - HOLDING STRONG ✅
The stock has found solid support in the 900-950 zone, which coincides with:
- Multiple moving average convergence (EMA 20/50/100/200)
- Previous resistance-turned-support from mid-2025
- Psychological round number support at 900
The price has bounced decisively from this zone, suggesting accumulation by institutional investors.
2. Consolidation Rectangle Pattern (Daily/Weekly)
A clear *rectangular consolidation box* :
- Upper Range: 1,016 - 1,050
- Lower Range: 900 - 950
This sideways movement indicates Distribution completion and potential energy buildup for the next directional move.
All major EMAs are converging in the 890-910 zone, creating a strong support cluster.
TARGET ANALYSIS:
Immediate Resistance Targets:
Target 1: 1,180 - 1,200 (First Major Resistance)
- Previous consolidation high from December 2025
- 61.8% Fibonacci retracement of the recent decline
Target 2: 1,334 (Secondary Target)
- Major swing high marked on weekly chart
- Psychological resistance zone
Target 3: 1,450 (Extended Target)
- Previous all-time high zone
- Final resistance before new highs
Critical Support Levels:
- 1,000: Immediate psychological support
- 900-920: MAJOR SUPPORT (EMA cluster + pattern base)
BULLISH BREAKOUT (Higher Probability - 65%)**
CONCLUSION:
Kirloskar Oil Engines is at a Critical juncture with strong technical setup favoring a Bullish breakout. The stock has:
- ✅ Successfully held major support zones
- ✅ Maintained position above all key moving averages
- ✅ Formed higher lows indicating accumulation
- ✅ Built a strong base for the next upward move
Disclaimer: This analysis is for educational purposes only. Please consult with your financial advisor before making investment decisions. Past performance does not guarantee future results.

Gravita Triangle Breakout 1DGravita is attempting to breakout after forming a triangle pattern on 1D timeframe with high volumes. The stock is also trading above 200ema. Enter after bullish confirmation.

Cup n handle & head n shoulders 1HTVC:NI225
1H shows negative pattern and price action.
ready for break down
please do your own research before taking any trade.
i am not financial advisor
risk is real stay practical
please feel free to ask any questions

Tata Consumer Products Ltd – Inverted Head & Shoulders Breakout (Long-term Reversal Structure Forming)
Tata Consumer is currently attempting a breakout from a long-term neckline zone around ₹1,170–₹1,200 after forming a large Inverted Head & Shoulders pattern on the weekly timeframe.
The right shoulder has built a strong base above the 20W & 50W EMA, confirming renewed demand. Volume has gradually increased over the past weeks during the breakout attempt — a bullish sign.
A strong weekly close above ₹1,200 could activate the full pattern and open space toward the ₹1,400+ target zone.
🎯 Key Technical Levels
CMP: ₹1,183.10 (+0.78%)
Neckline (Breakout Zone): ₹1,170 – ₹1,200
Pattern Target: ₹1,390 – ₹1,420
Support Zone: ₹1,095 – ₹1,115
Stop-Loss: Below ₹1,090 (weekly close basis)
📈 Technical View
Large Inverted Head & Shoulders visible over a multi-month structure.
Right shoulder built cleanly above EMAs → uptrend strength.
Volume rise during recent candles suggests accumulation by big hands.
A breakout + weekly close above ₹1,200 would indicate strong continuation toward the target zone.
🧠 View
Tata Consumer is approaching a decisive weekly breakout. A sustained close above ₹1,200 could trigger the completion of the Inverted H&S pattern and invite a move toward ₹1,400+. Retests toward ₹1,150–₹1,170 may offer accumulation opportunities.

Man Industries (W): Bullish, Turnaround with Volatility(Timeframe: Weekly | Scale: Logarithmic)
The stock is in a confirmed structural uptrend (Higher Lows) following a year-long correction. It is currently battling a critical multi-year resistance zone, backed by strong fundamental news and rising volume.
📈 1. The Structural Turnaround (The "Big Picture")
- The Cycle: Trend analysis:
- Consolidation: Jan 2024 – July 2024.
- The Peak (ATH): The stock hit a major high in July 2024
- The Correction: A downtrend followed, bottoming out in March 2025.
- The Reversal: Since March 2025, the stock has shifted character, forming a clear series of Higher Lows, signaling that buyers are stepping in at higher prices.
🚀 2. The Catalyst & Recent Action (Week of Nov 17)
- The Catalyst (The "Why"): The recent surge is driven by the company signing a Memorandum of Understanding (MoU) with Aramco Asia India (a subsidiary of Saudi Aramco) to explore a manufacturing facility in Saudi Arabia. This news triggered the volume spike.
- The Breakout Attempt: Last week (Nov 17-21), the stock attacked the horizontal resistance zone.
- Surge: It rallied +5.60% for the week.
- Volume: The move was supported by 5.22 Million in volume —a significant pickup compared to the "dry" correction phase.
- The Rejection: Despite hitting a new 52-week high intraday (₹472.40 on Nov 20), the stock failed to close above the resistance, facing profit-taking near the highs.
📊 3. Technical Indicators
- Trend: Short-term EMAs are in a PCO (Price Crossover) state on Monthly & Weekly charts, confirming the uptrend.
- Momentum (RSI):
- Weekly/Monthly: RSI is rising, supporting the longer-term bullish view.
- Daily: The Daily RSI dipped on Friday, reflecting the immediate rejection/profit-taking at resistance.
🎯 4. Future Scenarios & Key Levels
The "Shooting Star" style rejection on the weekly chart makes the coming week critical.
🐂 Bullish Case (Breakout Confirmation)
- Trigger: A sustained close above the ₹465–₹475 zone.
- Target 1: ₹545
- Target 2: ₹645 (Blue-sky extension).
🐻 Bearish Case (Support Test)
- Trigger: If the "failed breakout" leads to further profit-taking.
- Support: The immediate support lies at ₹420. Holding this level is crucial to maintain the "Higher Low" bullish structure.
Conclusion
The stock is structurally bullish but is digesting a supply overhang at the All-Time Highs. The Aramco news provides a strong floor, but patience is needed for a decisive close above ₹475 to confirm the next leg up.

BITCOIN NEED BREATHE CRYPTO:BTCUSD
BTC need take relief of selling because selling is continuously happened so one little bounce is possible and that bounce works as retest of channel breakdown.
Reverse Scenario:
Formation of any bottom pattern
V shape recovery
Long consolidation after with volume brake out.
All chances is possible but there are low possibility
🧠 Always DYOR (Do Your Own Research)
⚖️ This is not financial advice or suggestion
👉 “Risk Is Real 💸 Stay Practical🚀”
💬 Please feel free to ask any questions (It's Free)

Higher highs and below SMA( Weekly high > 1 week ago high AND ( Latest Close < SMA(Latest Close, 50) OR Latest Close < SMA(Latest Close, 200) ) )
