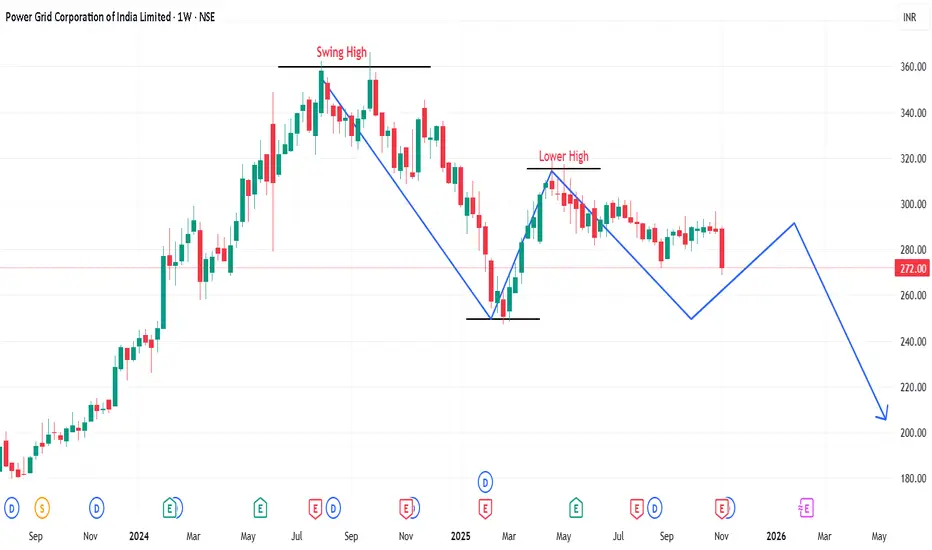
Will Powergrid showing sign of exiting it??Power Grid has been trading in a range for a while and it is showing sign of some weakness.
Major Trend - Down Trend
As there is a BoS of the previous market cycle.
Minor Trend - Sideway to range bound.
The market tends to retest the swing low in the coming month.
Stock has taken a strong resistance from 20 & 50 EMAs. Weekly close is below 100 EMA.
If the stock follow through the downside movement, entry for a sell trade is there with a 1:2 R:R ratio.
Entry :- 270
Stop Loss :- 279
Target :- 259
Last week the index too has supported the fall. If the index remains negative, full quantities can be punched around 270, in case of a retest half quantities can be sold around the retest and the price action near resistance levels while remaining quantity to be entered once the price action is in our favor.
Moving Averages
Bitcoin at Support: Bounce Likely, Trend Still WeakBitcoin has been sliding steadily and has now broken its first major support near 103k. The latest drop completed a clear A-B-C decline, with the final C-wave forming an ending diagonal — a pattern that often signals exhaustion at the end of a move. That’s why the selling pressure slowed as price entered the current demand zone.
Oversold Conditions
The RSI on the daily chart has dropped into deeply oversold territory. This is typically where Bitcoin produces a reaction bounce. It doesn’t confirm a trend reversal, but it does hint that sellers may pause.
What Happens Next
A corrective bounce — the X-wave — is the most reasonable expectation. However, X-waves are usually messy and uneven, not clean rallies.
The key area to watch is 100k–103k .
If Bitcoin cannot reclaim this zone, the larger corrective structure remains in control.
Bigger Picture
The moving averages support this caution. The 50-day and 200-day MAs are close to forming a death cross, which signals weakening short-term momentum relative to the long-term trend. It doesn’t imply a crash, but it does suggest that any bounce may face resistance.
If the X-wave fails below 103k, the next leg — the Y-wave — could drive price toward the larger support region around 72k–75k.
In Summary
The decline looks structurally complete, ending with an ending diagonal.
RSI is deeply oversold -> a corrective bounce is likely.
100k–103k is the make-or-break zone.
Failure to reclaim it keeps the W-X-Y correction active.
The final support zone sits lower, near 72k–75k.
A bounce may come first, but the broader structure still leans bearish unless key resistance levels are regained.
Disclaimer: This analysis is for educational purposes only and does not constitute investment advice. Please do your own research (DYOR) before making any trading decisions.

Sequent (D): Strongly Bullish, Fundamentally-Driven BreakoutThe stock has confirmed a major breakout from a 3-year structural turnaround. The move is backed by a massive earnings beat, high-conviction volume, and aligned indicators across all timeframes.
📈 1. The Long-Term Structure (The Turnaround)
- The Crash (2021-2023): After hitting its All-Time High (ATH) in June 2021, the stock entered a brutal correction, falling ~81% to form a base around ₹62 in February 2023.
- The Recovery: Since March 2023, the stock has been in a steady uptrend, forming a classic "rounding bottom" or recovery structure.
- The Hurdle: The recovery faced a stiff horizontal resistance trendline at the ₹239 - ₹241 zone. This level acted as a ceiling in October 2024 (High: ₹240.70) and rejected price action multiple times recently.
🚀 2. The Catalyst & Breakout (Today's Action)
- The Catalyst: The breakout is fueled by Q2 FY26 Earnings , where the company reported a staggering 209.1% YoY jump in Net Profit
- The Breakout: Today (Nov 18, 2025), the stock decisively shattered the ₹240 resistance, surging 7.10% to close near ₹247 .
- Volume Confirmation: The move was backed by massive volume of 9.15 Million shares, a sharp spike compared to the drying volume seen during the recent consolidation. This confirms institutional buying.
📊 3. Technical Indicators
- EMAs: Short-term EMAs are in a PCO (Price Crossover) state across Monthly, Weekly, and Daily timeframes, signaling a synchronized bullish trend.
- RSI: The Relative Strength Index is rising across all three timeframes, confirming that momentum is expanding with price.
🎯 4. Future Scenarios & Targets
The breakout has opened the door to higher levels, with a specific structural target in focus.
- The Gap (The Magnet): An unfilled gap on the daily chart has been identified from the steep 2021 correction. This gap exists between ₹270 and ₹276 (formed in August 2021). Gaps often act as magnets for price.
🐂 Bullish Targets:
1. Target 1 (Gap Support): ₹270 . The stock is likely to run toward the bottom of this unfilled gap.
2. Target 2 (Gap Fill): ₹295 . If momentum sustains and fills the gap, the next extension level is near ₹295.
🛡️ Support (The Entry Zone):
- Re-test Level: The breakout level at ₹239 - ₹240 has now flipped from resistance to support. A pullback to this zone would be a classic "buy-the-dip" opportunity to enter the trend with a favorable risk-reward ratio.
Conclusion
This is a high-quality setup. The combination of a technical breakout , earnings explosion, and gap-fill potential makes this a strong candidate for continuation. Watch for a hold above ₹239 .

Rico Auto (D): Strongly Bullish, 20-Year BreakoutThis is a high-conviction, "blue-sky" breakout setup. The stock has shattered a resistance confluence that includes a 20-year-old horizontal ceiling . This technical move is powered by a massive fundamental turnaround in the recent quarter.
🚀 1. The Fundamental Catalyst (The "Why")
The breakout is not random; it is a direct reaction to the company's Q2 FY26 Earnings report (announced recently):
- Net Profit: Nearly tripled (surged ~200-300%) compared to the previous year.
- Revenue: Showed healthy growth despite sector headwinds.
- Impact: This strong fundamental performance provided the volume and momentum needed to break the multi-decade resistance.
📈 2. The "Confluence" Breakout (The Setup)
The stock faced two formidable barriers at the **₹108** level:
1. The 20-Year Resistance: A horizontal "lid" formed at the major peak in September 2005 (approx. ₹106-₹108). Breaking a 20-year resistance is a sign of a significant structural shift.
2. The Angular Resistance: The downward trendline from the April 2024 ATH (₹157).
💥 3. Today's Price Action (Confirmation)
- The Surge: The stock surged +11.93% today, closing decisively above the ₹108 confluence zone.
- The Volume: The move was backed by 37.23 Million in volume—a massive spike compared to the "drying volume" seen during the consolidation. This confirms institutional participation.
📊 4. Key Technical Indicators
Indicator analysis confirms the momentum across all timeframes:
- RSI: Rising in Daily, Weekly, and Monthly charts, showing synchronized bullish momentum.
- EMAs: Short-term EMAs are in a PCO (Price Crossover) state across all three timeframes, signaling a strong trend alignment.
🎯 5. Future Scenarios & Targets
With the 20-year resistance broken, the stock has room to run.
- 🐂 Target 1: ₹127 (Immediate technical extension).
- 🛑 Support (The Safety Net): The breakout level at ₹108 is now critical. If the stock pulls back, this "resistance-turned-support" must hold to keep the breakout valid. A successful re-test here would be a textbook entry opportunity.

JTEKT India Technical AnalysisHere's a comprehensive TradingView report for JTEKT India Limited:
Current Price:160.90
📊 TECHNICAL SETUP OVERVIEW
JTEKT India is displaying a compelling technical structure within a well-defined ascending channel pattern that has been in play since the 2020 lows. The stock is currently consolidating after a significant rally and appears to be setting up for the next leg of movement.
KEY TECHNICAL OBSERVATIONS
1. Channel Pattern Analysis:
- Long-term Ascending Channel: The stock has been respecting a parallel channel since 2020, with clear support and resistance boundaries
- Current Position: Trading in the middle zone of the channel, suggesting room for movement in either direction
- Channel Support: Lower trendline around 120-130 zone
- Channel Resistance: Upper trendline projecting towards 220-240 zone
2. Moving Average Structure:
All major moving averages are sloping upward, confirming a strong bullish trend across multiple timeframes.
3. Price Action Patterns:
- Clear higher highs and higher lows formation since 2020
- Recent consolidation after touching 220+ levels suggests healthy profit-booking
- Volume expansion during rallies indicates strong buying interest
- Formation of a potential inverse head and shoulders pattern on monthly timeframe
4. Support & Resistance Levels:
Immediate Support Zones:
- S1: 148-150 (8/13 EMA cluster)
- S2: 134-135 (50 EMA + channel support)
- S3: 120-122 (psychological level + lower channel boundary)
Resistance/Target Zones:
- Target 1:188.50 (Previous swing high)
- Target 2: 209.71 (Major resistance + psychological 200 level)
- Target 3: 255.40 (Channel top + Fibonacci extension)
PROJECTION & TREND ANALYSIS
Bullish Scenario (Higher Probability):
If the stock holds above 148-150 support zone:
1. First target: 188.50 (18% upside potential)
2. Breakout above 190 could trigger momentum towards 209.71
3. Ultimate target within channel: 255.40 (58% upside from current levels)
Bearish Scenario (Risk Assessment):
Break below 134 (50 EMA) could lead to:
- Retest of 120-122 zone (channel support)
- Deeper correction to 110-115 if channel breaks
- This would invalidate the current bullish setup
CONCLUSION
JTEKT India Limited presents a well-defined bullish channel with strong moving average support. The technical structure suggests the stock is consolidating before the next leg up, with multiple targets identified.
Accumulate on dips toward 148-150, add on strength above 170, with ultimate targets of 188, 210, and ₹255.
Disclaimer: This is a technical analysis for educational purposes only. Not financial advice. Technical analysis should be combined with fundamental research, and proper risk management should always be employed. Past performance does not guarantee future results.
#JTEKT #TechnicalAnalysis #StockMarket #ChannelTrading #SwingTrading #NSE #AutoSector #MovingAverages #TrendAnalysis #IndianStocks

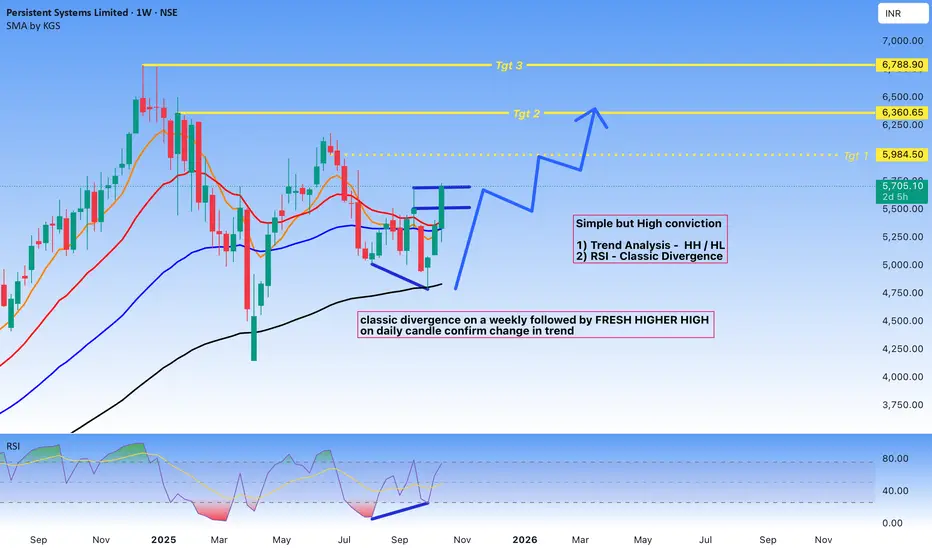
Persistent Technical Analysis#Persistent Systems Limited - Technical Analysis
Chart Overview
**Timeframe:** Weekly (1W)
**Current Price:** 5,708.20
Technical Setup
Trend Analysis
The chart displays a compelling technical setup based on higher highs and higher lows pattern analysis. After a significant correction from previous highs, the stock has formed a strong base and is showing signs of trend reversal.
Key Observations
RSI Classic Divergence
The Relative Strength Index is displaying a classic bullish divergence pattern. While price action formed lower lows during the correction phase, the RSI formed higher lows, indicating weakening bearish momentum and potential trend reversal. This divergence has been confirmed on the weekly timeframe, adding significant weight to the bullish case.
Fresh Higher High Confirmation:
Following the divergence, price action has broken above the previous swing high on the daily candle, confirming a potential change in trend structure. This break represents a shift from the previous pattern of lower highs and suggests renewed bullish momentum.
Price Targets
The analysis identifies three potential target zones:
- **Target 1:** 5,984.50 (Immediate resistance)
- **Target 2:** 6,360.65 (Medium-term target)
- **Target 3:** 6,788.90 (Extended target)
These targets are derived from previous resistance levels and Fibonacci extension analysis.
Moving Averages:
The chart shows multiple moving averages (likely 50 SMA and 200 SMA based on the red and orange lines). Price is currently attempting to reclaim these key moving averages, which would further validate the bullish thesis.
Risk Considerations
While the technical setup appears favorable, traders should consider:
- Confirmation on higher timeframes for reduced false signal risk
- Volume analysis to validate the breakout
- Proper risk management with stop-loss placement below recent swing lows
## Disclaimer
This is a technical analysis for educational purposes only and should not be considered as financial advice. Always conduct your own research and consult with a qualified financial advisor before making investment decisions. Past performance does not guarantee future results.
Thyrocare (W): Strongly Bullish, Multi-Year BreakoutBased on Weekly Timeframe, Logarithmic Scale
This is a textbook, high-conviction breakout. The stock has decisively broken a 4-year consolidation, backed by strong fundamentals and a powerful confluence of high-timeframe technical indicators.
📈 1. The Multi-Year Setup
- The 2021 Peak: After its ATH in June 2021 (at ~₹1,465 ), the stock entered a steep, 2-year downtrend.
- The 2023 Bottom: This trend found its bottom in March 2023 .
- The Recovery & Base: Since then, the stock has been in a 2.5-year recovery, building a massive base. This upward move was further halted by the horizontal resistance at the ₹1,465 level, which it failed to break on previous attempts.
🚀 2. The Fundamentally-Driven Breakout (Last Week)
Last week, this entire 4-year pattern changed:
- The Catalyst: Strong Q2 2026 earnings provided the "fuel" for a major move.
- The Surge: The stock surged +12.43% for the week.
- The Volume: This move was backed by a 3.45 Million share volume spike. This comes after a period of average volume, confirming institutional interest.
- The Close: The stock achieved a weekly close above ₹1,465 , confirming the breakout is not just an intraday spike.
📊 3. Confluence of Bullish Indicators
The alignment on high timeframes is exceptionally bullish:
- RSI: The Relative Strength Index is rising on both the Monthly and Weekly charts.
- EMAs: The short-term Exponential Moving Averages are in a "PCO" (Price Crossover) state on both the Monthly and Weekly charts.
- Volume: A clear spike on the breakout after a steady rise, confirming the move's validity.
🎯 4. Future Scenarios & Key Levels to Watch
🐂 The Bullish Case (Continuation)
- Trigger: If the bullish momentum continues, the stock is in a new "blue-sky" uptrend.
- Target: The next logical long-term price target is at ₹2,000 levels.
🐻 The Pullback Case (Healthy Re-test)
- Trigger: If the stock pauses to digest its 12.5% weekly gain or if the broader market pulls back.
- Support: The price would likely fall to re-test the resistance-turned-support level at ₹1,465 . A "bounce" off this level would be a classic, healthy confirmation of the breakout and an ideal entry point for those who missed the initial surge.

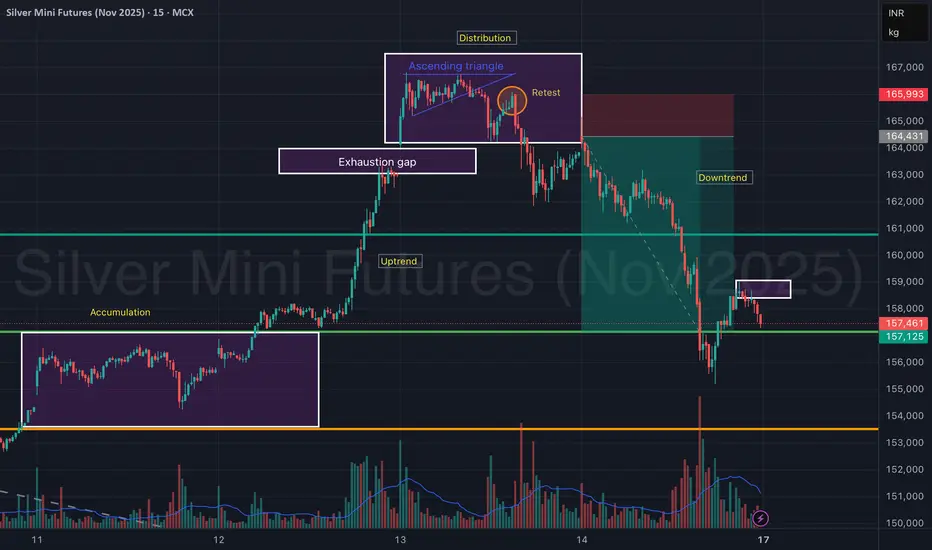
Silver Mini Futures (Nov 2025) – Accumulation to Distribution Silver Mini Futures on the 15-min chart clearly showcases a complete market cycle structure — transitioning from accumulation → uptrend → distribution → downtrend, providing an excellent study in price behavior and volume confirmation.
The move began with accumulation around ₹1,55,000, followed by a strong uptrend breakout, leading to a sharp rally. However, as price entered the ascending triangle near the ₹1,66,000 zone, momentum weakened, signaling distribution.
An exhaustion gap and a failed retest confirmed a reversal, leading to a steep downtrend, which remains active after a minor pullback.
📊 Phase Breakdown:
Accumulation Phase: ₹1,54,800 – ₹1,55,800
Sideways base formation with increasing volume at lows.
Uptrend Phase: Breakout above ₹1,56,000 triggered momentum.
Distribution Phase: Formed an ascending triangle with weak breakout follow-through.
Retest failure at ₹1,65,000 signaled exhaustion.
Downtrend Phase: Sharp decline with heavy volume, currently finding support near ₹1,57,000.
🎯 Key Technical Zones:
Resistance: ₹1,64,400 – ₹1,66,000 (supply zone)
Immediate Resistance (Retest Box): ₹1,58,200 – ₹1,58,800
Support Zone: ₹1,56,800 – ₹1,57,100
Major Support: ₹1,54,500
🧠 View:
Silver Mini Futures is currently in a downtrend continuation phase after a distribution top. A minor retest near ₹1,58,800 could invite short opportunities, while only a sustained move above ₹1,60,000 may signal trend reversal strength.
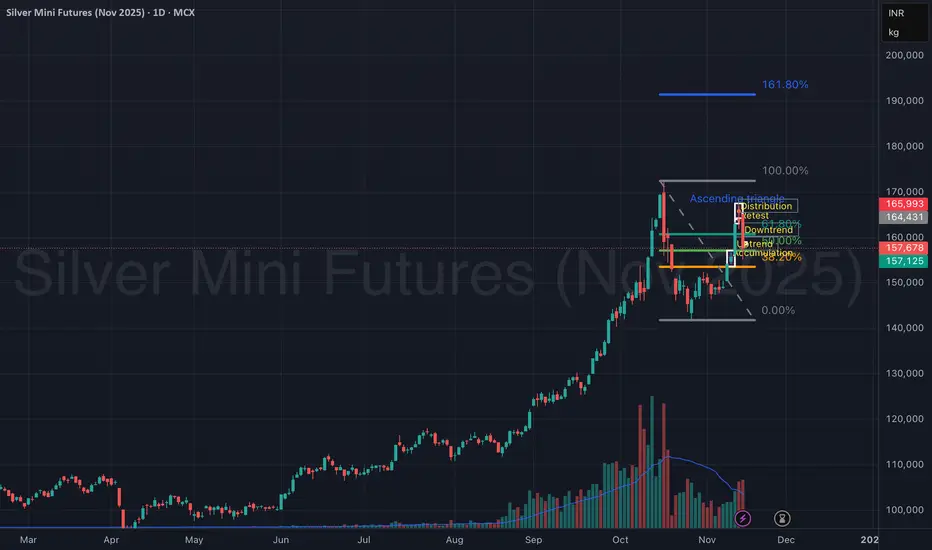
Silver Mini Futures (Nov 2025) – Accumulation to DistributionSilver Mini Futures on the 15-min chart clearly showcases a complete market cycle structure — transitioning from accumulation → uptrend → distribution → downtrend, providing an excellent study in price behavior and volume confirmation.
The move began with accumulation around ₹1,55,000, followed by a strong uptrend breakout, leading to a sharp rally. However, as price entered the ascending triangle near the ₹1,66,000 zone, momentum weakened, signaling distribution.
An exhaustion gap and a failed retest confirmed a reversal, leading to a steep downtrend, which remains active after a minor pullback.
📊 Phase Breakdown:
Accumulation Phase: ₹1,54,800 – ₹1,55,800
Sideways base formation with increasing volume at lows.
Uptrend Phase: Breakout above ₹1,56,000 triggered momentum.
Distribution Phase: Formed an ascending triangle with weak breakout follow-through.
Retest failure at ₹1,65,000 signaled exhaustion.
Downtrend Phase: Sharp decline with heavy volume, currently finding support near ₹1,57,000.
🎯 Key Technical Zones:
Resistance: ₹1,64,400 – ₹1,66,000 (supply zone)
Immediate Resistance (Retest Box): ₹1,58,200 – ₹1,58,800
Support Zone: ₹1,56,800 – ₹1,57,100
Major Support: ₹1,54,500
🧠 View:
Silver Mini Futures is currently in a downtrend continuation phase after a distribution top. A minor retest near ₹1,58,800 could invite short opportunities, while only a sustained move above ₹1,60,000 may signal trend reversal strength.
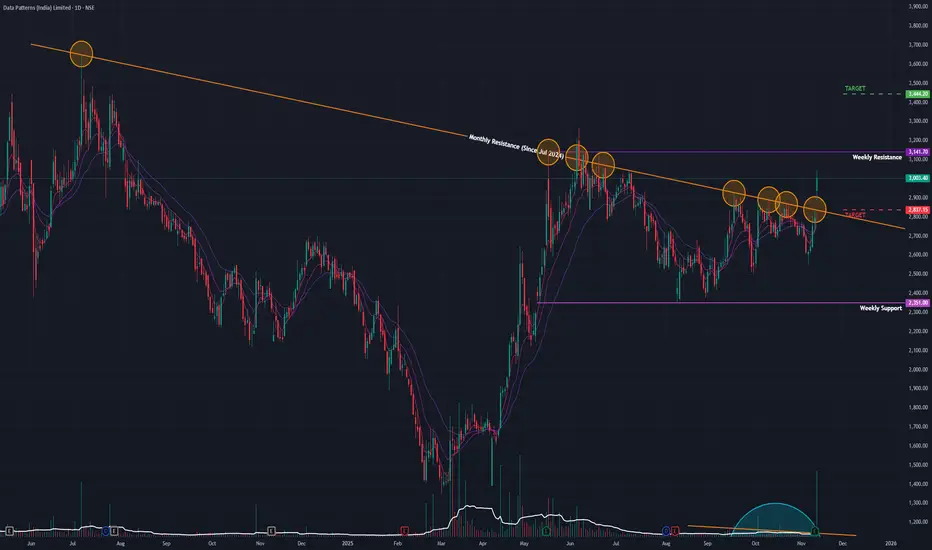
Data Patterns (D): Strongly Bullish, Fundamentally Driven BOThis is a high-conviction breakout event. The stock has decisively broken its 17-month angular resistance, driven by blockbuster quarterly earnings. All indicators are aligned, but the stock now faces its final horizontal resistance, which will determine the next major leg up.
🚀 1. The Fundamental Catalyst (The "Why")
Today's move is not speculative. It is a direct response to record-breaking Q2 2026 earnings :
- Revenue: Surged 238% year-over-year to ₹307.46 crore.
- Net Profit: Grew 62.5% year-over-year to ₹49.19 crore.
- Market Reaction: The gap-up open and +7.56% surge on 6.29 Million in volume confirms massive institutional interest.
📈 2. The Long-Term Context (The Setup)
- The 2024-2025 Correction: After its ATH in July 2024 , the stock entered a long-term downtrend.
- The Reversal: This trend found its bottom in March 2025 , and the stock began its recovery.
- The Angular Resistance: This recovery was capped by the angular resistance trendline from the July 2024 ATH.
- Drying Volume: Volume was drying up during the consolidation since May 2025—a classic sign of accumulation.
🎯 3. The Dual Resistance Battle
- Part 1 (CLEARED): Today, the stock gapped up and closed decisively above the 17-month angular resistance trendline. This is a significant bullish victory.
- Part 2 (THE NEXT HURDLE): The stock now faces a major horizontal resistance at ₹3,141 . This level is the last line of defense for the bears.
📊 4. Confluence of Bullish Indicators
This breakout is supported by a rare "trifecta" of bullish signals across all timeframes:
- EMAs: Short-term Exponential Moving Averages are in a "PCO" (Price Crossover) state on the Daily, Weekly, and Monthly charts .
- RSI: The Relative Strength Index is rising on the Daily, Weekly, and Monthly charts .
This alignment of all three timeframes gives the breakout very high technical validity.
🧠 5. Future Scenarios & Key Levels to Watch
🐂 The Bullish Case (Confirmation)
- Trigger: A decisive, high-volume close above the horizontal resistance at ₹3,141 .
- Target: This would confirm the start of a new bull run, and the target of ₹3,445 is the next logical objective.
🐻 The Pullback Case (Healthy Re-test)
- Trigger: If the stock is rejected at ₹3,141 or needs to pause after its big run.
- Support: The price would likely fall to re-test the angular trendline it just broke, at the identified level of ₹2,817 . A "bounce" off this level would be a textbook, healthy confirmation of the new support.
Asian Paints #Screener — Trend Reversal Before The Crowd Asian Paints Ltd (NSE: ASIANPAINT) has given a strong breakout from a long-term descending trendline with a sharp momentum candle.
This move signals a trend reversal after months of consolidation and price compression — supported by solid weekly volume.
Chart Structure #Screener
📌 Breakout from descending trendline
📌 Volume surge confirming buyer interest
📌 Price holding above 50 EMA on weekly
📌 Formation of higher lows since early 2025
📌 Strong bullish candle closing above key supply zone
Key Levels
Resistance Zone: ₹2880 – ₹3130
Support Zone: ₹2640 – ₹2720
Major Support: ₹2490 (structure base)
As long as price stays above ₹2640, trend bias remains bullish ✅
View
This setup represents a trend shift, not just a breakout — aligning with strength returning in large-cap sectors.
A healthy retest or consolidation above ₹2700 zone could provide follow-through opportunities.
Technical Snapshot
✅ Trendline breakout confirmation
✅ Volume expansion + wide-range candle
✅ Higher-low formation
✅ Momentum shift to buyers
✅ Mid-to-large cap stock showing leadership recovery
📒 Educational analysis only — not investment advice.

Biocon (D): Strongly BullishThis is a high-conviction breakout in progress. A major fundamental catalyst (record-breaking earnings) is providing the "great momentum", driving the price to challenge a critical multi-year resistance. All indicators are aligned for a major new uptrend.
🚀 1. The Fundamental Catalyst
The primary driver for today's move is a blowout Q2 2026 earnings report :
- Net Profit: Surged 392% year-over-year.
- Revenue: Grew 20% year-over-year.
- Today's Action: The market reacted with a gap-up open , a +5.40% surge , and massive 16.38 Million in volume, confirming strong institutional interest.
📈 2. The Long-Term Context
- The 2020 Peak: After its ATH in December 2020, the stock entered a multi-year downtrend.
- The 2023 Bottom: This trend found its bottom in March 2023 .
- The Reversal: Since then, the stock has been in a 2.5-year reversal, forming a bullish base of Higher Lows .
- The "Lid": This entire recovery has been capped by the key horizontal resistance zone formed back in June-December 2020 .
📊 3. The Decisive Breakout
Today's earnings-driven surge is challenging this multi-year resistance zone right now .
- Failed Attempts: There were multiple failed attempts to break this level in the past.
- Drying Volume: The consolidation phase before today's move saw volume dry up , a classic sign of seller exhaustion.
- The Breakout: Today's high-volume gap-up is the most powerful and fundamentally-backed attempt to break this "lid" to date.
🎯 4. Confluence of Bullish Indicators
This breakout is supported by a rare "trifecta" of bullish signals across all timeframes:
- EMAs: Short-term Exponential Moving Averages are in a "PCO" (Price Crossover) state on the Daily, Weekly, and Monthly charts .
- RSI: The Relative Strength Index is rising on the Daily, Weekly, and Monthly charts .
This alignment indicates that the long-term, medium-term, and short-term trends are all in sync for the first time in years.
🧠 5. Future Scenarios & Key Levels to Watch
The price action in the coming sessions is critical.
🐂 The Bullish Case (Confirmation)
- Trigger: The stock must get a decisive daily or weekly close above the 2020 resistance zone.
- Target: This would confirm the start of a new, long-term bull market, and ₹470 target is the logical next objective.
🐻 The Bearish Case (Breakout Failure)
- Trigger: If this move is a "bull trap" (e.g., profit-taking overpowers the good news).
- Confirmation: The stock fails to hold its gains and falls back below the resistance zone.
- Target: This failure would likely see the stock fall to retest the immediate support level at ₹375 .

Possible Nifty Resistance to supportMultiple bullish confluences in Nifty at current level is seen.
1. There is good resistance to support possible in Nifty nr ATH.
2. Good cup and handle pattern.
3. There is support nr weelky 20sma.
If nifty closes above Friday's high than it will trigger buy which can take nifty to 29000+ levels.
We need to wait for next week close. Target and SL marked on chart.

Nestle India – Retest Before the Final Push HigherNestle India appears to be unfolding a clean five-wave impulsive structure. After a powerful Wave 3 rally backed by strong volume expansion, the stock has entered a typical mid-trend pause — a falling wedge consolidation representing Wave 4.
The correction has so far retraced near the 0.382 Fibonacci level around ₹1,247, perfectly aligning with the prior breakout zone from Wave 1 highs. This overlap suggests that the current dip is more of a healthy retest than a trend reversal.
As long as the price action holds above ₹1,238.20, the bullish structure remains valid. A breakout above ₹1,311 — the Wave 3 high — would likely trigger Wave 5, opening room for upside continuation toward the ₹1,340–₹1,360 zone.
Both the 100-day and 200-day SMAs are sloping upward, reinforcing the medium-term bullish bias. Meanwhile, RSI remains steady in the 60 range, showing no signs of exhaustion — exactly what you want to see before a possible Wave 5 extension.
In short: the setup is healthy, confluence is strong, and risk is clearly defined. A decisive move above ₹1,311 could mark the start of Nestle’s next leg higher.
Invalidation: Below ₹1,238.20
Bias: Bullish continuation (Wave 5)
Timeframe: Daily
Disclaimer: This analysis is for educational purposes only and does not constitute investment advice. Please do your own research (DYOR) before making any trading decisions.

Bajaj Finserv rides a long-term bullish waveTopic Statement:
Bajaj Financial Services continues its evergreen bull run, supported by strong technical structure and improved affordability following its June 2025 stock split and bonus.
Key Points:
1. The stock is trading within a bullish up-trending channel, making it ideal for structured channel trading
2. Price rarely dips below the 200-day EMA, and such moments have historically been excellent long-term accumulation opportunities
3. Dips below the 50-day EMA offer favorable entry points for short-term swing trades or quantity accumulation
4. The stock faces stiff resistance at the 2000 level, which has historically acted as a ceiling
5. The June 2025 stock split and bonus have made the stock more affordable, resulting in increased volumes and improved liquidity

Silver Triangle BreakoutSilver is attempting breakout forming a ascending triangle pattern on 1h and 4h timeframe. It is also trading above 200ema.

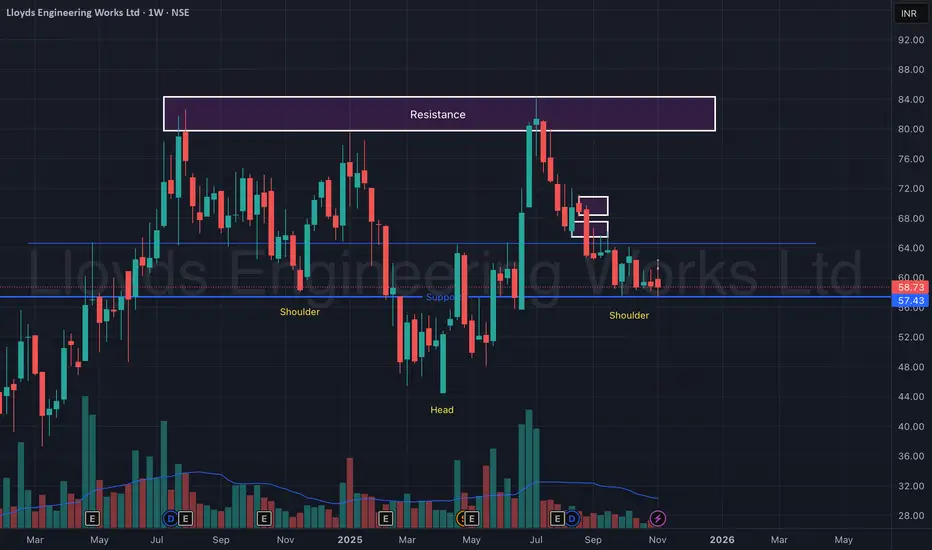
Lloyds Engineering Works Ltd – Ready to Blast from Support Zone!Lloyds Engineering is showing a textbook Inverted Head & Shoulders pattern on the weekly timeframe — a strong reversal formation that often precedes a major uptrend.
The support zone near ₹57–₹58 has held firmly for months, acting as a base for accumulation.
A bullish structure is clearly visible, with both shoulders aligning near the same horizontal support and increasing volumes hinting at smart money participation.
Once the stock decisively breaks above the ₹64 neckline zone, a powerful breakout toward ₹80+ could unfold in the coming weeks.
🎯 Key Levels:
CMP: ₹58.73 (+0.22%)
Pattern: Inverted Head & Shoulders
Support Zone: ₹57 – ₹58 (Strong base)
Neckline / Breakout Zone: ₹64 – ₹66
Target Zone: ₹80 – ₹85
Stop-Loss: ₹54 (Weekly close basis)
📊 Technical View:
Inverted Head & Shoulders forming over a year-long base.
Strong volume spikes near the right shoulder = early accumulation.
EMAs flattening and ready for crossover confirmation.
Sustaining above ₹64 could ignite momentum breakout toward ₹80+.
🧠 View:
Lloyds Engineering looks technically ready for a breakout. With the pattern structure completed and strong volume support, a close above ₹64 can trigger a new uptrend — this one’s “ready to blast.”
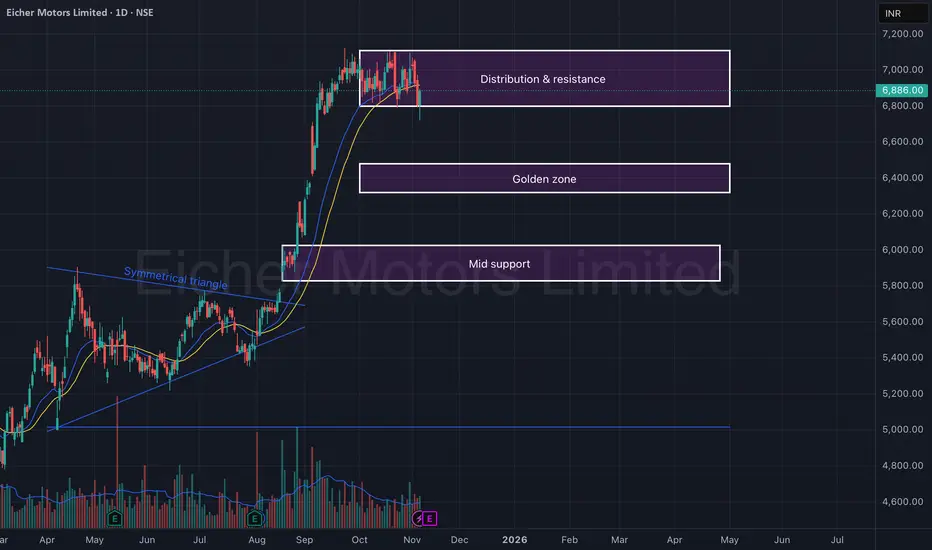
Eicher Motors Ltd – Distribution Zone & Golden Support Level (D)Eicher Motors is showing signs of short-term distribution after a strong uptrend. The price has been consolidating near the ₹6,850–₹7,050 resistance zone, which has acted as a supply area multiple times in recent sessions.
Following an extended rally from the breakout of the symmetrical triangle, the stock appears to be entering a cool-off phase — likely testing lower supports such as the golden zone (₹6,300–₹6,450) or mid support (₹5,900–₹6,000) before resuming its larger trend.
🎯 Key Levels:
CMP: ₹6,886 (+1.17%)
Resistance / Distribution Zone: ₹6,850 – ₹7,050
Golden Zone (Retracement Support): ₹6,300 – ₹6,450
Mid Support: ₹5,900 – ₹6,000
Stop-Loss (if long): Below ₹5,850
📊 Technical View:
Price facing resistance near prior highs, forming short-term distribution structure.
EMA alignment still bullish, but price is attempting a short-term retest.
Golden zone coincides with 38.2–50% retracement levels from the prior rally.
A reversal candle or bullish pattern in the golden zone could present a buying opportunity for swing traders.
🧠 View:
Eicher Motors remains structurally bullish in the medium term, but a short-term pullback is likely. The ₹6,300–₹6,450 golden zone will be key for a potential bounce, while ₹7,000 continues to act as the ceiling until a clear breakout occurs.
Suzlon (W): Cautiously Bullish, Pending BreakoutThis is a classic "wait and watch" scenario. The stock is coiling in a major, year-long consolidation pattern, and the pressure is building. A powerful fundamental catalyst (record-breaking results) is now meeting a critical technical resistance, setting the stage for a significant move.
📈 1. The Long-Term Context
- The Run-Up: After hitting its all-time low in March 2020, the stock has been in a massive, multi-year uptrend, which paused in September 2024.
- The Pattern: The stock has been consolidating in a Symmetrical Triangle for over a year. This pattern indicates a period of indecision and contracting volatility—a "coiling spring" before its next major trend.
- The Foundation: The long-term trend remains bullish, supported by an active Golden Cross (50/200 SMA) on both the Weekly and Monthly charts .
🚀 2. The Current Setup (The Decisive Hurdles)
The stock is currently squeezed between two key resistance levels that must be broken:
1. A Short-Term Horizontal Resistance: A minor "lid" formed around ₹59-₹61 .
2. The Primary Angular Resistance: The main, multi-month downtrend line that forms the top of the Symmetrical Triangle.
The stock must first break the short-term horizontal level to gain the momentum needed to challenge the main triangle.
📊 3. Indicators & Catalysts
Conflicting indicators are observed which is the key. This is a classic feature of a consolidation phase:
- Short-Term (Weak): The RSI is down (currently in neutral/sell territory), and the short-term EMAs are not yet in a PCO state . This shows the immediate price action is choppy and lacks momentum.
- Long-Term (Strong): The active Golden Cross on higher timeframes shows the underlying trend is still firmly bullish.
- The Catalyst: The "good results" are a massive fundamental driver. The company just reported its highest-ever quarterly net profit (a 539% YoY increase) and a record 85% revenue jump . This provides a strong fundamental case for the triangle to break to the upside .
🎯 4. Future Scenarios & Key Levels to Watch
This is a "wait for confirmation" setup.
🐂 The Bullish Case (Two-Step Breakout)
- Trigger 1 (Short-Term): A decisive, high-volume breakout and close above the horizontal resistance (₹61) .
- Target 1: This would likely trigger a quick move to the first target of ₹65 .
- Trigger 2 (Long-Term): A sustained move that breaks the main angular resistance of the triangle.
- Target 2: This confirms the end of the year-long consolidation and opens the door to long-term target of ₹74 .
🐻 The Bearish Case (Breakdown)
- Trigger: If the stock fails to break out (due to weak short-term momentum) and instead breaks the triangle's support .
- Target: The price would likely fall to retest the recent support level, which is the identified zone of ₹51 - ₹53 .

Thangamayil (M): Strongly Bullish, Blue-Sky BreakoutThis is a high-conviction breakout. The stock has broken out of a year-long consolidation base, created a new all-time high, and is supported by explosive volume and powerful fundamental results.
📈 1. The Long-Term Context (The "Big Picture")
- Logarithmic View: On a long-term logarithmic chart, this move is a continuation of a major uptrend.
- The Consolidation: After hitting its previous All-Time High (ATH) in October 2024, at ₹2,567.50, the stock entered a year-long sideways consolidation.
- Drying Volume: During this phase, volume "dried up," which is a classic bullish sign of seller exhaustion and accumulation by new buyers.
🚀 2. The Decisive Breakout (The November 2025 Event)
- The Surge: In the first week of November 2025, the stock shattered this consolidation with a massive +40.17% surge.
- High-Conviction Volume: This move was backed by exceptional, non-speculative volume of 3.67 Million shares, confirming strong institutional interest.
- New ATH: This surge pushed the stock into "price discovery" mode, creating a new all-time high.
📊 3. The Fundamental Catalyst (Why it's Breaking Out)
This powerful technical breakout is fully supported by blowout fundamental news, which gives the move high validity:
- Massive Profit: The company reported a sharp Q2 profit turnaround (from a net loss last year to a ₹58.5 Cr net profit).
- Record Sales: The company also announced record-breaking sales in October , crossing the ₹1,000 Cr mark for the first time in a single month.
🎯 4. Future Scenarios & Key Levels
- Bullish Indicators: The short-term EMAs are in a PCO state and the RSI is rising , confirming the momentum is strong and on the side of the buyers.
🐂 The Bullish Case (Price Discovery)
- Trigger: If this momentum is sustained, the stock is in "blue-sky" territory with no overhead resistance.
- Target: Projected target of ₹4,150 is a logical next-level based on technical extensions.
🐻 The Pullback Case (Support Test)
- Trigger: If the momentum pauses or a pullback occurs (which is healthy after a 40% surge).
- Support: The most critical level to watch is the old resistance-turned-support zone at ₹2,560 - ₹2,570 . A re-test and "bounce" off this level would be a textbook confirmation of the new support and an ideal entry point for those who missed the initial breakout.

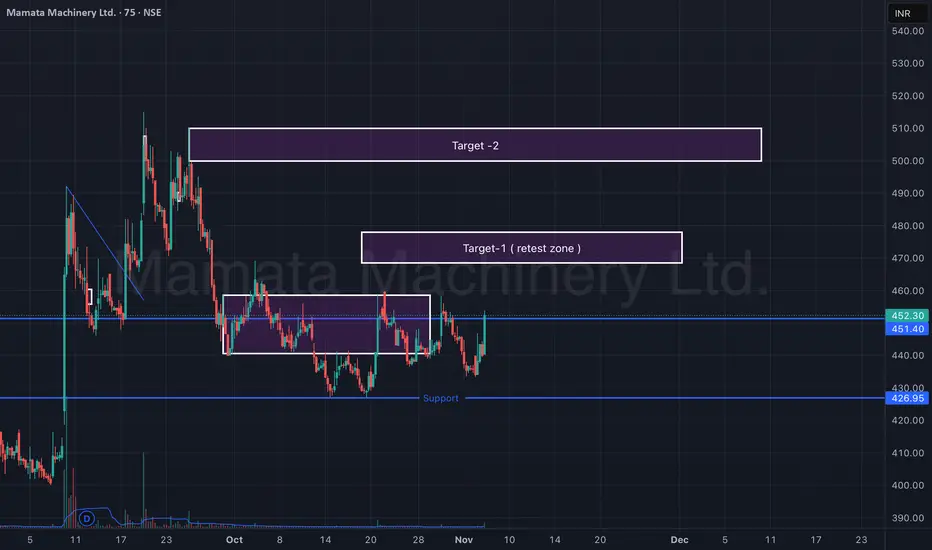
Mamata Machinery Ltd – Support Reversal & Retest Zone (75-min)Mamata Machinery is showing early signs of reversal from a strong support zone around ₹425–₹430. After forming a double-bottom-like structure, the stock has bounced sharply with rising volumes, indicating a possible short-term trend reversal.
Currently, price action is approaching a retest zone (Target-1) near ₹465–₹470. Sustaining above this level can open the path toward the next resistance cluster (Target-2) near ₹505–₹515.
🎯 Key Levels:
CMP: ₹452.30 (+3.81%)
Support Zone: ₹425 – ₹430
Target-1 (Retest Zone): ₹465 – ₹470
Target-2: ₹505 – ₹515
Stop-Loss: ₹425 (on 75-min close basis)
📊 Technical View:
Price rebounded from major support with visible volume spike.
Structure forming higher lows — early indication of momentum shift.
Short-term EMAs turning upward; potential crossover likely soon.
Sustained move above ₹470 can confirm breakout continuation toward ₹510+.
🧠 View:
Mamata Machinery has reversed from key support and is testing its retest zone. A breakout above ₹470 could trigger a short-term rally toward ₹510, while maintaining a stop-loss below ₹425.
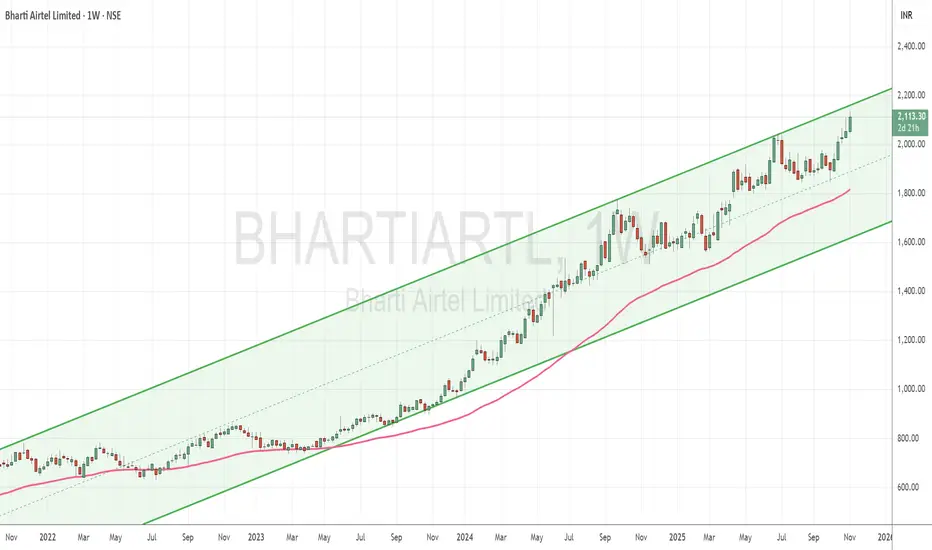
Bharti Airtel climbs relentlessly but risks overbought correctioTopic Statement:
Bharti Airtel is on a strong bull run, maintaining momentum within a defined channel, though overbought conditions hint at a potential correction risk.
Key Points:
1. The stock is moving in a bullish up-trending channel, making it ideal for channel-based trading
2. Price generally remains above the 50-day EMA, signaling continued strength
3. The stock is currently highly overbought, and a sharp correction may be on the horizon as risk builds
Sun Pharma trades sideways within a defined rangeTopic Statement:
Sun Pharma has remained in a sideways zone throughout the year, presenting recurring opportunities for accumulation at key technical levels.
Key Points:
1. The stock is rangebound between 1550 and 1800, with no clear breakout direction so far
2. It consistently takes strong support at the 23.6% Fibonacci retracement level at 1568
3. The stock can be accumulated when it dips below the 50-day EMA, with heavier investment opportunities when it falls below the 200-day EMA
