Bharti Airtel is still in a bull run?Major trend of the stock is bullish and repitition of a previous pattern is a possibility.
In this trade I will be trading a pattern, in fact 2 candle and 5 candle patterns.
Rising Three Method is there in the monthly charts
Bullish engulfing pattern formation on the 3 month chart.
Entry:- 1970
Risk :- 1880 (4.523960-%)
Reward :- 2360 (19.8%)
R:R is good, pattern setup is good.
Wait for the price to approach around my buying area.
Moving Averages

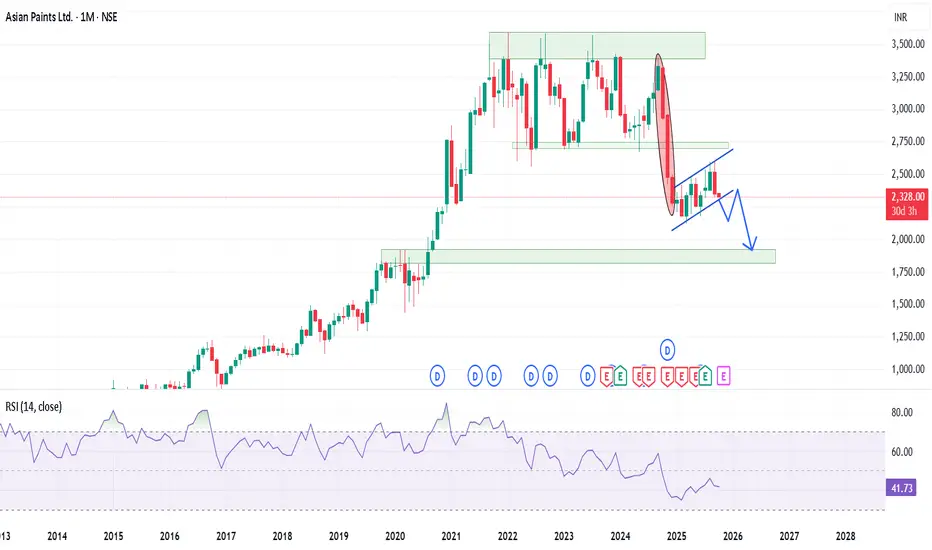
Good bearish setup on the higher time frame.Asian paints is one of the leading paint manufacturer in country and for the last few months the stock is trading in a parallel channel there are chance of it trying to retest the previous support zone of around 2700 levels before entering into another bearish leg.
Fundamentally stock shows some negativity as ~45% YoY decline in consolidated net profit in Q4 FY25.
Revenue slipped 4.3% YoY in this quater. Net profit fell 23.3% YoY in Q3 FY 2025.
Technically too the stock look to form bearish Flag and Pole pattern with a possible retracement to around 1700-1800 levels in upcoming months.
RSI is around in between on the monthly charts which is not in confluence.
BBand shows that the stock is trading below the median line of the band and chance of it travelling to the lower band it possible as stock it below the median line for around 11 months.
Exponential moving averages : 100 EMA on the monthly charts is providing good support to the stock while 20 & 50 EMA are acting as the resistance on the same time frame.
Target are different as per the trading setup.
Support and Resistance
Entry only once the channel is breached and retested.
Targe : 1815-1925 zone.
Bollinger Band
Entry has been triggered as per the BB strategy.
Target : 1935
EMA
As per the EMA strategy, there will be multiple entries in the stock.
Entry will be made once the stock closed below the 100 EMA.
Target : 200 EMA.
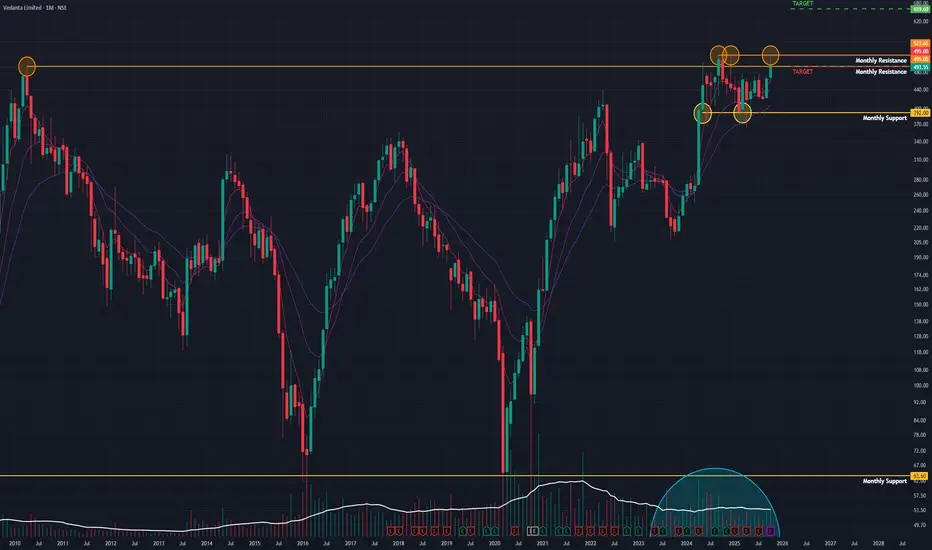
Vedanta (M): Bullish, but at a critical decision point.The stock is currently consolidating in a tight range after a historic, multi-decade breakout. The price is now coiling for its next major move. The key is whether the old resistance at ₹490 holds as new support.
📈 1. The Long-Term Context (The "Big Picture")
- Historic Breakout: After a long sideways trend, the stock finally broke its 14-year resistance line (dating back to April 2010) and subsequently set a new All-Time High (ATH) in December 2024.
- Consolidation Phase: Since that ATH, the stock has not rallied further but has entered a healthy sideways consolidation. This is a common pattern where a stock "digests" its massive gains and builds a new base.
- Failed Attempts: As you noted, there have been several attempts to break out of this new, smaller consolidation channel, but all have failed so far.
🔍 2. The Current Setup (The Decisive Range)
This consolidation has created two very clear levels that define the stock's next move:
- Short-Term Resistance: The ATH set in late 2024 (around Sep/Dec).
- Critical Support: The old long-term resistance level at ₹490 . This is the most important level to watch.
The recent surge this month ( +5.96% on 236.66 Million in volume ) was another test of the top of this channel, which was not yet successful.
📊 3. Key Technical Indicators
The underlying momentum supports a bullish resolution:
- RSI: The Relative Strength Index is rising, showing that buying strength is quietly building.
- EMAs: The short-term Exponential Moving Averages are in a "PCO" (Price Crossover) state, signaling positive momentum.
🎯 4. Future Scenarios & Key Levels to Watch
The price action in the coming days and weeks is critical. Monitor these two potential scenarios:
🐂 The Bullish Case (Continuation)
- Trigger: A decisive, high-volume breakout and close above the short-term resistance (the post-2024 ATH).
- Confirmation: This would confirm the consolidation phase is over and the next leg of the primary uptrend has begun.
- Target: The next logical price target is projected to be ₹650 .
🐻 The Bearish Case (Breakdown)
- Trigger: The breakout fails, and selling pressure pushes the stock below the critical support floor.
- Confirmation: A high-volume close below ₹490 . This would be a significant failure, as the "resistance-turned-support" level would have broken.
- Target: This breakdown would signal a deeper correction.
Conclusion
The bullish indicators (RSI, EMAs) combined with the recent high-volume surge suggest buyers are accumulating. The primary focus should be on the ₹490 level . As long as it holds, the bias remains bullish, and this is just a pause before the next rally to the ₹650 target.
LTFLTF shares have been trading within a defined channel and are currently positioned above their 200-day, 150-day, and 50-day moving averages. Over the last three months, this positioning—combined with a gradual price increase—indicates a potential for further upward momentum.
However, to manage risk effectively, implementing a stop-loss strategy remains essential.

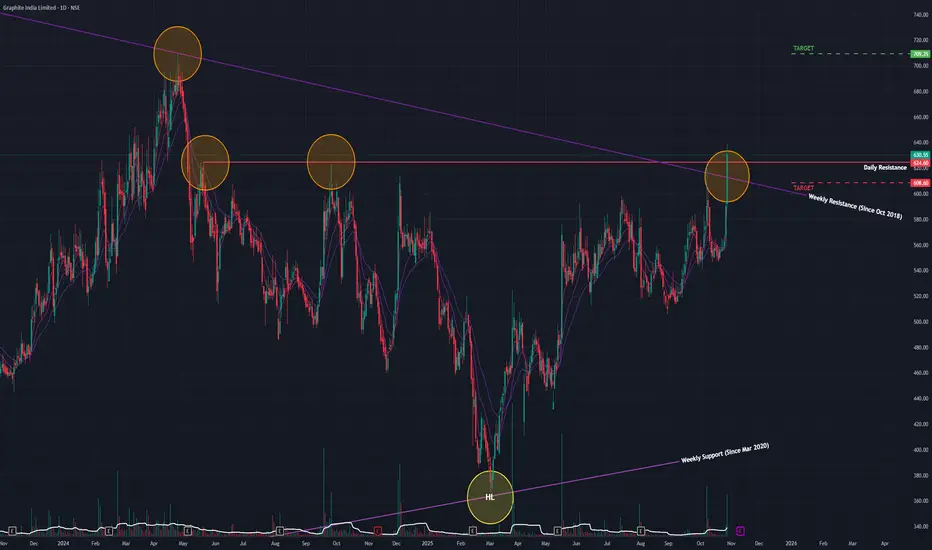
Graphite (D): Mighty Dual-Resistance Breakout Signals Major RevAfter being in a multi-year downtrend since its All-Time High (ATH) in August 2018, Graphite India (GRAPHITE) is showing compelling signs of a major trend reversal. Today's powerful price action has broken through two critical resistance levels, suggesting a new uptrend may be underway.
The Long-Term Bottoming Process
While the stock peaked in 2018, a very long-term bottoming process has been in place. Since April 2020, the stock has been forming a pattern of Higher Lows (clearly visible on the Monthly chart), indicating a gradual shift from supply to demand over the years. Although there was a more recent downtrend from May 2024, that appears to have reversed starting in March 2025.
Today's Decisive Dual Breakout
Today's session (Wednesday, October 29, 2025) was technically very significant:
- Strong Price Surge: The stock rallied by +6.82% .
- Massive Volume: The move was supported by a huge volume of 8.6 million shares , indicating strong buyer conviction.
- Dual Resistance Breach: In a powerful display, the stock broke out and closed above two key resistance levels simultaneously :
1. A long-term angular resistance trendline in place since October 2018.
2. A short-term horizontal resistance trendline formed since May 2024.
Breaking through a confluence of long-term and short-term resistance on high volume is a potent bullish signal.
Broad-Based Technical Strength
This breakout is strongly supported by a clear alignment of momentum indicators across all major timeframes (Monthly, Weekly, and Daily):
- Short-Term EMAs: All three timeframes are in a bullish Positive Crossover (PCO) state.
- RSI (Relative Strength Index): The RSI is also in a rising trend on all three timeframes.
Outlook and Key Levels to Watch
With this dual breakout, the technical landscape has shifted significantly in favor of the bulls.
- Bullish Target: If the stock can sustain this momentum, the next logical area of resistance and potential price target is the ₹709 level. The ideal confirmation, would be a successful re-test of the broken resistance zone followed by a bounce.
- Critical Support: If this breakout proves to be a "fakeout" and the price falls back below the broken resistance, the key support level to watch is ₹608 . A close below this would negate the bullish signal.
In conclusion, today's action represents a potentially major turning point for Graphite India. Confirmation via a successful retest would provide the highest confidence that a new long-term uptrend has begun.
Adani Green (D): Surges 10.79% But Fails at Key ResistanceAfter being in a downtrend since June 2024, Adani Green is showing clear signs of a potential trend reversal. Since March 2025, the stock has been building a bullish base by forming a constructive pattern of Higher Lows . However, this new uptrend is now facing its most significant test.
Today's Battle at Resistance
The stock's upward progress has been blocked by a major horizontal resistance trendline . Today's session (Wednesday, October 29, 2025) saw a powerful attempt to break this level:
- The stock surged by an impressive +10.79% .
- This move was backed by a very strong volume of 36.23 million shares .
Critically, despite the significant buying pressure, the stock was unable to close above this key resistance level , indicating that sellers are still actively defending this zone.
A Mixed Technical Picture
The technical indicators paint a picture of a new uptrend that is still fighting to confirm itself:
- Bullish Signals:
- The RSI (Relative Strength Index) is in a rising trend across the Monthly, Weekly, and Daily timeframes.
- A long-term SMA Golden Crossover has been in effect for the past month.
- Lagging/Cautionary Signals:
- The short-term EMAs have not yet formed a bullish Positive Crossover (PCO) state on the Daily and Monthly charts. This suggests the new uptrend is still in its early and unconfirmed stages.
Outlook and Key Levels to Watch
The stock is at a classic "prove it" moment. The battle at this horizontal resistance is the key.
- Bullish Scenario: A decisive, high-volume close above the resistance trendline is required to confirm the breakout and validate the new uptrend. If this occurs, the path could open for a move toward the *₹1,445 level.
- Bearish Scenario: If today's move was a "bull trap" and momentum fades, a rejection from this level could send the stock back to test its recent support, with a potential downside to ₹995 .
Given that the stock is attempting to reverse a significant downtrend, this resistance is a major hurdle. Caution is warranted until a successful breakout is confirmed with a strong daily close above the line.

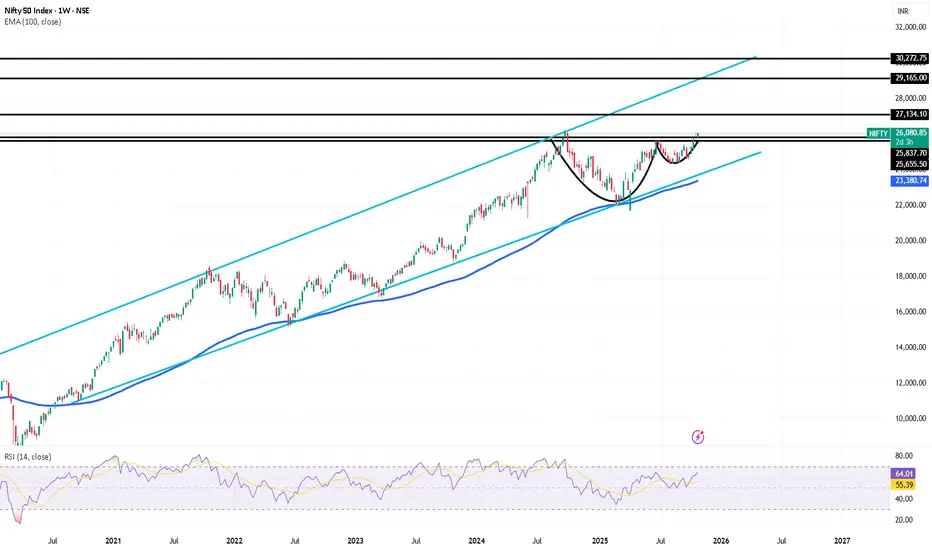
NIfty Positional on the verge of Breakout PatternHello everyone,
Nifty weekly forming Cup & handle pattern and about to break along with lifetime high with Good RSI strength is 64. Nifty corrected 16% from preivous high of 26270 falls continue for almost 6 month and in next 6 month recovered fully....possible trading in channel above 26600-700 there is 27500 and the 30000 is the targets.
Sai Silks (D): Confirms Major Breakout with Successful RetestAfter a long downtrend that ended in May 2025, Sai Silks (Kalamandir) has been in a clear trend reversal, establishing a constructive pattern of Higher Lows . This new uptrend has now achieved a significant technical milestone.
The Breakout and Confirmation
The stock's primary challenge was a long-term horizontal resistance trendline that had been in place since May 2024. This level has now been decisively cleared in a two-step process:
1. The Breakout (Yesterday): The stock successfully broke out and closed above this key resistance, signaling a major victory for the bulls.
2. The Confirmation (Today): Today, this breakout was put to the test. The stock gapped up at the open, but bears tried to push the price back down, resulting in a re-test of the old resistance line . In a very strong bullish sign, the level held. The stock closed positive at +2.28% on massive volume of 72.88 million shares, confirming that the old resistance has successfully flipped into new support.
Broad-Based Technical Strength
This powerful "Breakout and Retest" pattern is strongly supported by a complete alignment of momentum indicators. The short-term Exponential Moving Averages (EMAs) are in a Positive Crossover (PCO) state, and the Relative Strength Index (RSI) is rising across all three timeframes: Monthly, Weekly, and Daily .
This multi-timeframe alignment confirms that the underlying momentum is broad, synchronized, and strengthening.
Outlook and Key Levels to Watch
The successful re-test is a high-conviction signal that the primary trend has shifted and is poised to continue upwards.
- Bullish Target: If this bullish momentum continues, the next logical area of resistance and potential price target is the ₹270 level.
- Critical Support: The most immediate support level to watch is now ₹191 . A failure to hold above this level would be a cause for concern and would suggest the breakout has failed.

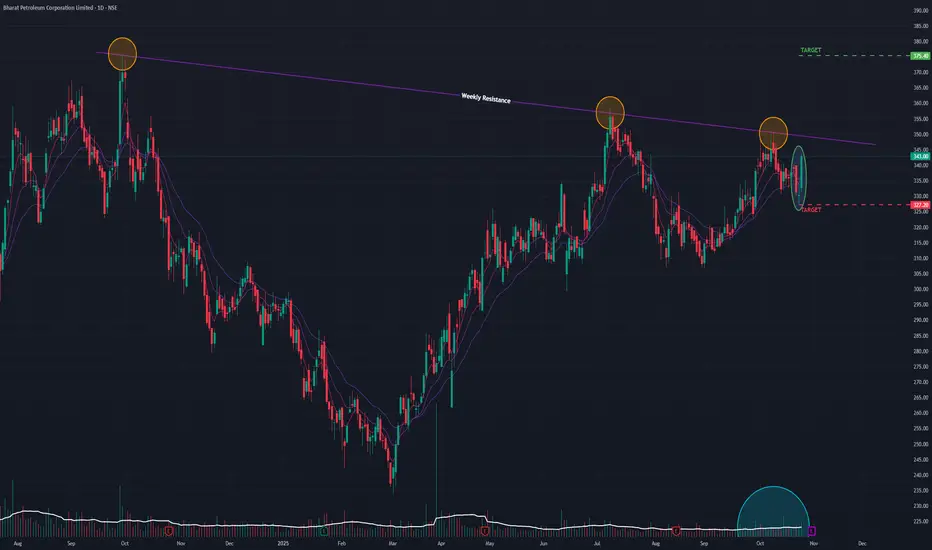
BPCL (D): Forms Bullish MorningStar, Challenges Major ResistanceAfter reversing from a short-term downtrend, BPCL (Bharat Petroleum Corporation Ltd) has flashed a powerful bullish signal. However, this newfound momentum is now running directly into a major, long-term resistance trendline that has capped its progress, setting the stage for a critical battle.
The Bullish Setup: A Morning Star at Support
Today's price action (Monday, October 27, 2025) was highly constructive for the bulls:
- Price & Volume Surge: The stock rallied +3.80% on a strong volume of 11.77 million shares .
- Classic Reversal Pattern: This move completed a "Morning Star" candlestick pattern . This is a classic three-candle bullish reversal pattern that often signals the bottom of a downtrend and a new shift in momentum.
Broad-Based Technical Strength
This bullish pattern is strongly supported by a powerful alignment of indicators across all major timeframes (Monthly, Weekly, and Daily):
- Short-Term EMAs: All three timeframes are in a bullish Positive Crossover (PCO) state.
- RSI (Relative Strength Index): The RSI is also in a rising trend on all three timeframes.
This multi-timeframe alignment indicates that the underlying momentum is broad, synchronized, and strengthening.
The Immediate Hurdle: Long-Term Resistance
Despite these bullish signals, the stock is now positioned less than 2% below a major long-term resistance trendline formed since its All-Time High. This line represents a significant historical barrier for the stock.
Outlook and Key Levels to Watch
The stock is at a clear "prove it" moment. The outcome of the battle at this resistance will likely determine the next major move.
- Bullish Breakout Scenario: A decisive close above the long-term resistance on high volume would confirm the breakout and validate the Morning Star pattern. This would signal a continuation of the new uptrend, with a potential next target of ₹375 .
- Bearish Rejection Scenario: If the stock fails to breach this resistance and momentum fades, it could be rejected. The first key support level would be the bottom of the Morning Star pattern, around ₹325 .
In conclusion, the price action in the coming days is critical. All eyes should be on this key resistance level for either a confirmed breakout or a rejection.
Triangle breakout in EdelweissEdelweiss is showing good triangular breakout on monthly.
Also it has taken support at monthly 20ma
Good risk reward trade is possible.
Target SL on chart.
Since it is monthly breakout target will take 4~6 months.

Ascending Triangle at Top Waiting For BreakoutStock is within 40% range since 3 years.
Ascending Triangle and 200 EMA perfect support.
CAGR of 20% of the stock has under performed till now.
Breakout can give min 30-40% returns.
Presently at good accumulation zone, with good volumes

Jayneco (W) - Breaks Out on Massive VolumeAfter an incredible 181%+ rally since April 2025, Jayaswal Neco Industries (JAYNECO) has been consolidating in a sideways trend for the past few weeks. This period of consolidation has now been decisively resolved to the upside.
This Week's Powerful Breakout
The past week's price action (ending Oct 24, 2025) was a significant win for the bulls:
- Strong Price Surge: The stock rallied by +15.95% for the week.
- Enormous Volume: This move was backed by a massive volume of 67.09 million shares , confirming strong buyer conviction.
- Key Resistance Breach: The surge shattered the consolidation's upper resistance trendline, and most importantly, closed the week above it .
Broad-Based Technical Strength
The breakout is underpinned by strong momentum across multiple timeframes. On both the Monthly and Weekly charts:
- The short-term Exponential Moving Averages (EMAs) are in a bullish Positive Crossover (PCO) state.
- The Relative Strength Index (RSI) is in a rising trend.
This alignment confirms that the primary momentum is strongly bullish and supports the case for a new leg up.
Outlook and Key Levels to Watch
With the resistance now cleared, the path of least resistance has shifted firmly upwards.
- Bullish Target: If this strong momentum is sustained, the next logical area of resistance and potential price target is the ₹84 level.
- Critical Support: The recently broken resistance, around the ₹75 level, now becomes the most critical new support zone.
As you noted, the price action next week will be crucial. Traders should watch for follow-through buying or a potential retest of the ₹75 breakout level, which would now be expected to act as strong support.

ICICI Bank marches upward, nearing major Fibonacci resistanceTopic Statement:
ICICI Bank continues its long-term bull run, supported consistently by technical levels, but now approaches a key resistance near the 1500 mark.
Key Points:
1. The stock trades reliably within a well-defined up-trending channel, maintaining long-term bullish structure
2. Price is repeatedly supported by the 50-day EMA, acting as a dynamic floor throughout its rallies
3. It has only dipped below the 200-day EMA during rare deep corrections, like the COVID crash of 2020
4. Based on the Fibonacci levels plotted from the 2020 correction, the 423.6% extension lies near 1500 — a level already reached, where the stock may now face stiff resistance

Torrent Power - Short Term Investment IdeasTorrent Power Limited - Technical Analysis Report
Current Market Price: 1,328.40
Opportunity: The Stock is Trading at 40% discount to intrinsic value, presenting a potential value investment in the #Integrated #powersector.
Technical Setup: Stock testing critical 20 #EMA support on monthly timeframe after forming #HiddenDivergence #pattern. Recent decline suggests caution but oversold conditions emerging.
Technical Snapshot
Trend: Monthly chart shows trend continuation pattern with classic divergence forming between February and October 2025 lows. Currently attempting support at 20 EMA (1,329).
RSI: Monthly RSI at 33.26 (oversold territory) with RSI 3 breakout indicating significant selling pressure but potential bounce setup.
Support Levels: 1328, 1200, 1055
Resistance Levels: 1539, 1743 (recent high)
Business Overview (Fundamentals)
Torrent Power operates across three segments: thermal power generation and LNG trading, transmission and distribution (largest revenue contributor), and renewable energy through wind and solar projects.
Trading Strategy
Aggressive Buyers: Accumulate at current levels with stop loss below 1,280. Risk-reward favorable given 40% discount.
Conservative Buyers: Wait for weekly close above 1,350 confirming support hold before entry.
Target:1,539 (short-term), 1,743+ (medium-term)

Bank of India (D) - Breakaway Gap Signals New MomentumAfter a severe, decade-long downtrend from its All-Time High in September 2010, Bank of India has been in a slow and steady reversal phase since June 2020. This bottoming process has become more evident since June 2022, with the stock consistently carving out a bullish structure of Higher Lows , indicating a gradual shift in control from sellers to buyers.
Today's Decisive Breakaway Gap
Today's session (Thursday, October 23, 2025) provided a powerful confirmation of this new strength. The stock surged +4.05% on huge volume of 22.05 million shares.
Crucially, this move was a breakaway gap , with the stock opening above a key short-term horizontal resistance trendline and closing strong. Gapping and closing above a significant resistance level on high volume is a very strong bullish signal, indicating aggressive buyer commitment.
Broad-Based Technical Strength
This bullish price action is strongly supported by a clear alignment of momentum indicators across all major timeframes (Monthly, Weekly, and Daily):
- Short-Term EMAs: All three timeframes are in a bullish Positive Crossover (PCO) state.
- RSI (Relative Strength Index): The RSI is also in a rising trend on all three timeframes.
This multi-timeframe alignment confirms that the underlying momentum is broad, synchronized, and strengthening.
Outlook and Key Levels to Watch
With the short-term resistance now cleared, the stock has two key levels to monitor:
- The Next Hurdle (Resistance): The stock is still "well below" its primary long-term horizontal resistance line. This is the next major obstacle to clear.
- Bullish Target: A successful, high-volume breakout above that long-term resistance would confirm a major, multi-year trend reversal and open the path towards the ₹150 level.
- Critical Support: The recently broken short-term resistance, around ₹130 , is now the most critical support level to watch. As long as the stock holds above this "line in the sand," the immediate bullish momentum remains intact.
In conclusion, today's gap-up is a significant development, but the stock must now prove it can overcome the far more significant long-term resistance to complete its multi-year reversal.

Reliance eyes breakout as bulls return post earningsTopic Statement:
Reliance has gained bullish momentum following strong earnings and a market rally, now approaching a key resistance zone with breakout potential.
Key Points:
1. The stock is climbing toward a triple top formation, which carries a high probability of a bullish breakout
2. It is trading above both the 50-day and 200-day EMAs, indicating strength but also making it relatively expensive in the short term
3. Price continues to move comfortably within its established up-trending channel, maintaining a well-supported bullish structure

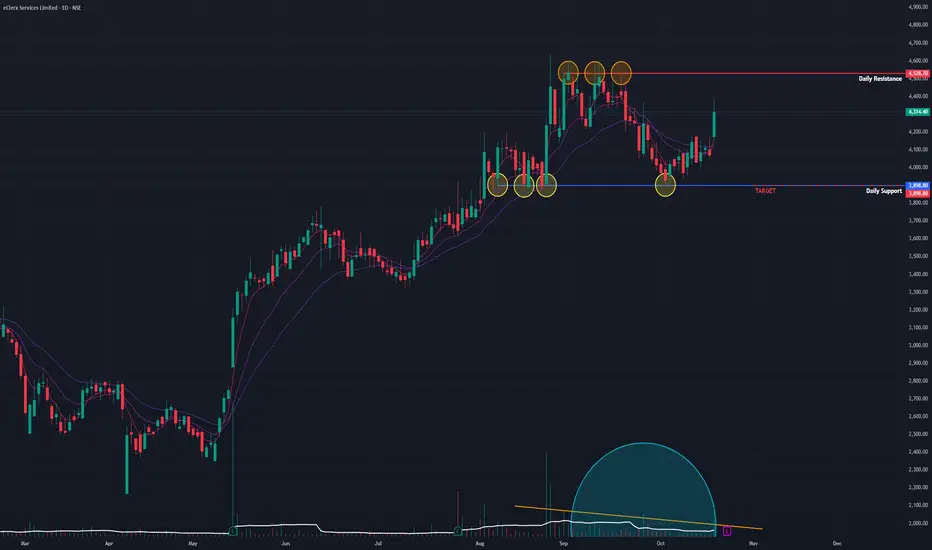
eClerx (D) - Gathers Momentum for All-Time High BreakoutAfter a lengthy consolidation phase, eClerx Services is showing strong signs of renewed bullish momentum, positioning itself for a potential breakout to new all-time highs.
The Context: A Healthy Consolidation
Since reaching its All-Time High (ATH) in April 2025 , the stock has been trading within a well-defined sideways range, consistently respecting the upper resistance and lower support trendlines. A key bullish characteristic of this consolidation phase has been the noticeable drying up of trading volume , which typically suggests that selling pressure is exhausted and the stock is gathering energy for its next move.
Today's Bullish Action
Today's session (Monday, October 20, 2025) saw a significant surge in buying interest:
- The stock rallied by +6.01%.
- This move has brought the price to within 5% of the critical horizontal resistance level formed by the ATH.
This action suggests that buyers are becoming more aggressive and are preparing to challenge the upper boundary of the consolidation range.
Underlying Technical Strength
The potential for a breakout is strongly supported by key momentum indicators across all major timeframes (Monthly, Weekly, and Daily):
- The Relative Strength Index (RSI) is in a rising state.
- The short-term Exponential Moving Averages (EMAs) are in a bullish positive crossover state.
These signals indicate a broad and strengthening underlying trend that could fuel a successful breakout.
Outlook and Key Levels to Watch
The immediate path for the stock hinges on its ability to overcome the ATH resistance.
- Bullish Scenario: If the current momentum continues and the stock achieves a decisive, high-volume close above the horizontal resistance , it would confirm a breakout. This would signal a continuation of the primary uptrend, with a potential next target of ₹5,150 .
- Bearish Scenario: If the stock fails to break out and momentum fades, it will likely be rejected from the resistance and could fall back to test the lower support of the consolidation range, around the ₹3,900 level.
Infy remains under pressure, stuck in long-term sideways rangeTopic Statement:
Infy has struggled this year with repeated price declines, remaining stuck in a wide sideways zone while trading at heavily oversold levels.
Key Points:
1. The price has fallen to the 38.2% Fibonacci retracement level multiple times, where it continues to receive support
2. It is currently trading below both the 50-day and 200-day EMAs, marking the stock as highly oversold
3. Infy has been range-bound between 1300 and 2000 since 2022, reflecting a prolonged phase of consolidation and indecision

Huhtamaki (D) - Explosive 12% "Gap-and-Go" BreakoutAfter a steep downtrend from its all-time high, Huhtamaki India has signaled a powerful bullish reversal, executing a massive "Gap-and-Go" breakout from a classic accumulation pattern today.
The Setup: An Ascending Triangle
Following its downtrend, the stock began a bottoming process by forming an Ascending Triangle . This bullish pattern is characterized by a series of Higher Lows pushing up against a flat horizontal resistance, indicating that buying pressure was systematically building under a well-defined supply level.
Today's Decisive Breakout
Today's session (Thursday, October 16, 2025) was a textbook example of a powerful breakout, leaving little doubt about the buyers' intent:
- Gap-Up Breakout: The stock opened with a significant gap up, clearing the horizontal resistance level right from the start.
- Massive Price Surge: It continued to rally throughout the day, closing with a gain of +12.58% .
- Enormous Volume: The move was validated by a huge volume of 19.27 million shares , confirming strong institutional participation.
A Nuanced Look at the Indicators
The technical indicators confirm a shift in trend, though they also suggest the new long-term trend is still in its early stages:
- Positive Signs: The Relative Strength Index (RSI) is now rising across the Monthly, Weekly, and Daily timeframes, showing a broad-based build-up in momentum. The short-term EMAs on the Daily chart have also flipped to a bullish state.
- Confirmation Pending: Importantly, the short-term EMAs on the longer-term Weekly and Monthly charts have not yet registered a bullish crossover . This indicates that while the short-term trend has reversed, the long-term trend is just beginning to turn.
Outlook and Key Levels
The stock has now cleared a major hurdle, shifting the balance of power to the bulls.
- Bullish Target: If this powerful bullish momentum continues, the next logical area of resistance and potential target is the ₹310 level.
- Critical Support Zone: The old resistance level, around ₹238 , now becomes the most critical new support. It would be a healthy sign for the stock to re-test this breakout zone and find support there. A failure to hold above this level would be a cause for concern.
In conclusion, today's explosive breakout is a major bullish development. The key now is to watch if the price can hold above the crucial ₹238 support level to confirm that a sustainable new uptrend has begun.

XAUUSD // Liquidity Grab // ATH# Gold Spot / U.S. Dollar - Liquidity Analysis
Market Structure Analysis
Key Liquidity Zones Identified
The chart highlights two critical liquidity zones where significant price action is anticipated:
**Upper Liquidity Zone: $4,212 - $4,219**
This zone represents an area of accumulated buy-side liquidity, typically formed by stop-losses from short positions and buy-stop orders. The red shaded area indicates where institutional players may target for liquidity capture before potential reversals.
**Lower Liquidity Zone: $4,157 - $4,162**
This zone marks the sell-side liquidity area, where stop-losses from long positions and sell-stop orders cluster. This level serves as a potential magnet for price action seeking to capture liquidity before any significant directional move.
Technical Setup
**Channel Pattern**
Gold is currently trading within a well-defined ascending channel on the intraday timeframe. The parallel trend lines show:
- Consistent higher highs and higher lows
- Price currently positioned in the mid-range of the channel
- Recent bounce from the lower channel boundary
**Demand Zone**
A marked demand zone is visible at lower levels, indicating previous buying interest and potential support.
Price Action Scenarios
Bullish Scenario (Green Path):
If price maintains support at current levels or the lower demand zone, we could see:
1. Continuation toward the upper liquidity zone ($4,219)
2. Potential liquidity sweep above this zone
3. Possible rejection after capturing buy-side liquidity
Bearish Scenario (Red Path):
If price fails to hold current structure:
1. Drop toward the lower liquidity zone ($4,162)
2. Liquidity grab below this level
3. Potential reversal after capturing sell-side liquidity
#Liquidity Concept
The annotation "Liquidity !!!!!!" emphasizes the importance of these zones. In institutional trading theory, price often moves to areas of high liquidity (where stop-losses cluster) before making significant directional moves. This is commonly referred to as a "liquidity sweep" or "stop hunt."
Trading Considerations
When price approaches either liquidity zone, traders should watch for:
- Rejection wicks suggesting liquidity capture completion
- Break and retest patterns for confirmation
- Changes in momentum indicators
Risk Management Notes
- The 5-minute timeframe requires precise execution and tight risk management
- Liquidity zones can be quickly swept through in volatile conditions
- Always use appropriate position sizing relative to account risk tolerance
- Consider wider timeframe context for overall trend direction
Disclaimer
This analysis is provided for educational purposes only and represents a technical perspective on price structure and liquidity zones.
It is not financial advice or a recommendation to buy or sell. Gold trading involves substantial risk of loss. Always conduct your own research, use proper risk management, and consider consulting with a qualified financial advisor before making trading decisions.

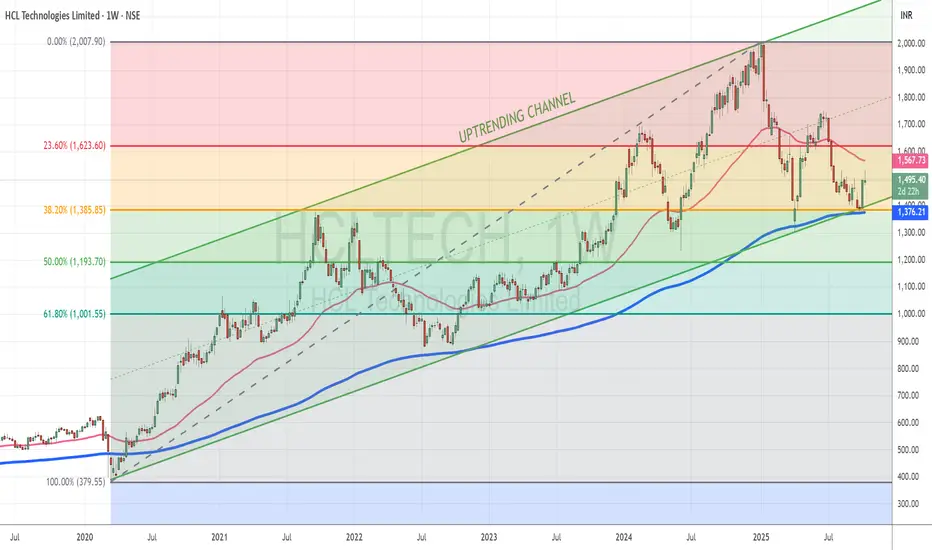
HCLTech shows signs of reversal after global-policy-driven correTopic Statement:
HCLTech, like other IT peers, has been dragged down by global economic policies but now shows early signs of recovery from key support levels.
Key Points:
1. The stock corrected down to the 38.2% Fibonacci retracement level at 1385, where it found strong support
2. Price reversed after touching the lower boundary of its bullish channel, reinforcing the trend structure
3. Currently trading below the 50-day EMA, the stock is oversold in the short term and presents a possible accumulation opportunity
Landmark (D) - 100%+ Rally from Lows Now Faces Key ResistanceLandmark Cars is at a critical juncture after a spectacular recovery from its all-time lows. A powerful surge today has brought the stock right up against a major resistance level, setting the stage for a potentially decisive breakout attempt.
The Context: A Dramatic Turnaround
After peaking at its All-Time High (ATH) in February 2024, the stock entered a significant downtrend, culminating in an all-time low in April 2025. From that bottom, however, the stock has staged an incredible reversal, surging over 100% to date. This powerful new uptrend has now brought the price to a key resistance trendline that has thwarted all previous rally attempts with "fake breakouts."
Today's Powerful Breakout Attempt
Today's session (Tuesday, October 14, 2025) demonstrated significant buying interest and a serious challenge to the overhead resistance:
- Gap-Up Opening: The stock opened with a gap-up, signaling strong overnight demand.
- Strong Price Gain: It surged to close with a gain of +10.62% .
- Huge Volume: The move was supported by a massive spike in volume, adding conviction to the rally.
This bullish action is underpinned by strong momentum indicators. The short-term Exponential Moving Averages (EMAs) are in a positive crossover state, and the Relative Strength Index (RSI) is rising across the Monthly, Weekly, and Daily timeframes.
Outlook and Key Levels to Watch
The immediate future hinges on whether this breakout attempt will succeed where others have failed.
- Bullish Breakout Scenario: A decisive close above the resistance trendline on sustained high volume would confirm a successful breakout. This would signal a continuation of the strong uptrend, with a potential next target of ₹800 .
- Potential Rejection Scenario: If the momentum is lost and the stock is once again rejected from this resistance, it could pull back to test its recent support level around ₹575 .
In conclusion, today's high-volume surge represents the most serious challenge to this key resistance yet. The price action in the coming days will be crucial in confirming whether the bulls have enough power to finally break through and continue the stock's impressive recovery.

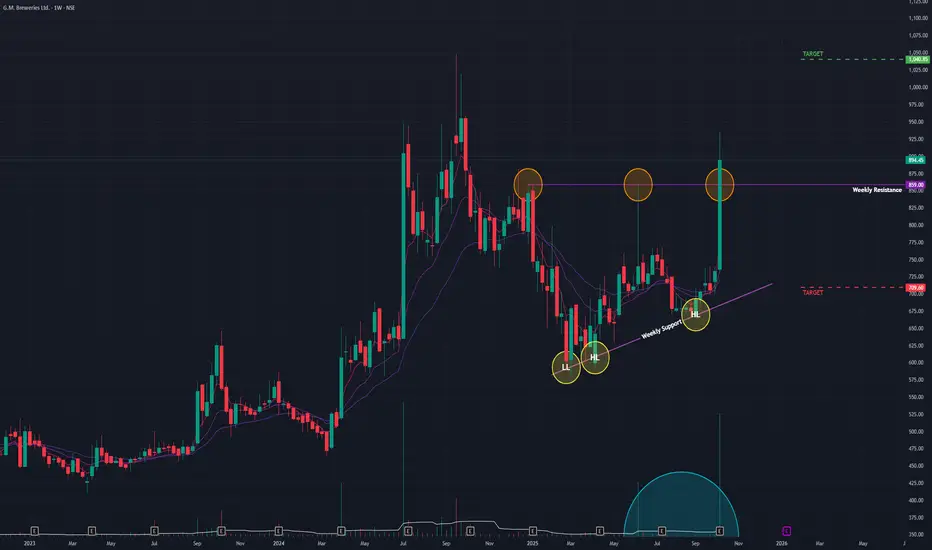
GM Breweries (W) - An Explosive 22% Breakout Signals New UptrendAfter a corrective downtrend from its September 2024 all-time high, GM Breweries has executed a powerful, high-volume breakout, signaling that its consolidation phase is over and a new uptrend is likely underway.
The Bullish Setup
Following its reversal from a low in March 2025, the stock began constructing a solid base. It formed a clear pattern of Higher Lows , indicating a gradual absorption of supply and a shift in control from sellers to buyers. This constructive price action set the stage for a potential upward move.
This Week's Decisive Breakout
The past week's trading session was exceptionally strong, confirming the bullish bias with authority:
- Massive Weekly Gain: The stock surged by an impressive +22% .
- Exceptional Volume: The move was fueled by a massive volume of 11.88 million shares , signifying strong participation and conviction behind the rally.
- Key Resistance Breach: This surge resulted in a decisive breakout and close above a critical horizontal resistance level that had been in place since December 2024.
This bullish price action is further supported by momentum indicators. The short-term Exponential Moving Averages (EMAs) are in a positive crossover state, and the Relative Strength Index (RSI) is rising on both the Monthly and Weekly timeframes.
Outlook and Key Levels
The powerful, volume-backed breakout has cleared a path for potential further upside.
- Bullish Target: If this strong momentum is sustained, the next logical resistance and potential target is the ₹1,040 level.
- Key Support: In the event of short-term profit-booking or a pullback, the recently broken resistance level around ₹710 is now expected to act as the new floor of support.
The key confirmation to watch for in the coming days is whether the price can hold above this crucial **₹859** breakout zone. A successful defense of this level would strongly validate the new uptrend.