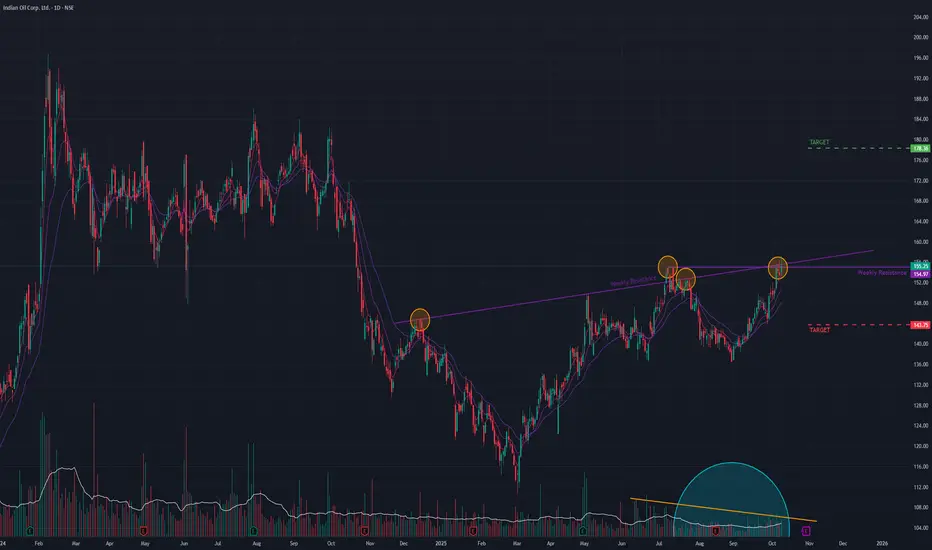
IOC (D) - Tussling with a Critical Resistance ZoneIndian Oil Corp (IOC) is showing a strong bullish structure, but it has arrived at a critical juncture where two significant resistance levels are converging. The price action suggests a battle between buyers and sellers is underway, and a decisive move is imminent.
The Bullish Foundation
After a year-long downtrend that ended in February 2025, the stock has carved out a clear new uptrend , consistently forming higher highs and higher lows. This upward momentum is well-supported by multiple technical indicators:
- Golden Crossover: A long-term bullish "Golden Crossover" of the Simple Moving Averages (SMAs) occurred a few months ago.
- Indicator Strength: The short-term Exponential Moving Averages (EMAs) and the Relative Strength Index (RSI) are in a bullish state across the Monthly, Weekly, and Daily timeframes.
The Resistance Test: A Mixed Signal
The primary challenge for IOC is a confluence of two resistance trendlines: a long-term angular resistance and a short-term horizontal resistance .
Today's trading session was a clear attempt to breach this zone, which resulted in a mixed signal:
- Partial Success: The stock managed to close above the short-term horizontal trendline , a minor positive.
- Key Rejection: However, while it did trade above the more critical long-term angular trendline intraday, it failed to hold these gains and closed below it .
This failure to close above the long-term resistance, combined with consolidating (non-expanding) volume, suggests that sellers are still active and buyers currently lack the conviction to force a decisive breakout.
Outlook and Key Levels
The next few trading sessions are crucial and will provide clarity.
- Bullish Scenario: A convincing daily close above the long-term angular trendline , especially if accompanied by an increase in volume, would confirm the breakout and signal a move towards the ₹178 level.
- Bearish Scenario: Continued rejection from this trendline could lead to a pullback, with the stock likely to find support around the ₹141 level.
The current price action warrants close monitoring. A breakout is clearly being attempted, but confirmation is required before a new directional trend can be established.
Moving Averages
McLeod Russel (D) - A Decade-Long Downtrend Reversal?After being in a severe downtrend for over ten years since its all-time high in February 2013, McLeod Russel is now showing compelling signs of a major trend reversal. A multi-year consolidation phase appears to have ended with a powerful, momentum-driven breakout.
The Breakout: A Shift in Momentum
The stock was locked in a sideways consolidation range since August 2020. However, recent price action signals a decisive shift in control from sellers to buyers:
- Building Strength: Over the past few weeks, the stock began forming a pattern of Higher Lows , an early indication that selling pressure was diminishing and buyers were stepping in at higher prices.
- Resistance Breach: On Friday, October 6th, the stock decisively broke out of a major, multi-year resistance level.
- Explosive Follow-Through: The breakout was followed by extremely bullish action this week, with the stock gapping up at the open and immediately hitting the upper circuit limit each day. This indicates intense buying interest with a complete absence of sellers.
This powerful move is confirmed by key technical indicators. The short-term Exponential Moving Averages (EMAs) are in a positive crossover, and the Relative Strength Index (RSI) is firmly in bullish territory across the Monthly, Weekly, and Daily timeframes.
Outlook and Key Levels
The current momentum suggests a significant new uptrend is underway.
- Bullish Target: If this strong momentum continues, the next logical resistance and potential target for the stock is the ₹85 level.
- Support Level: Should the momentum pause or a pullback occur, the breakout level around ₹35 is expected to act as a strong support zone.
Given the rapid, vertical ascent, traders should watch the price action closely in the coming days for signs of either continuation or short-term exhaustion.

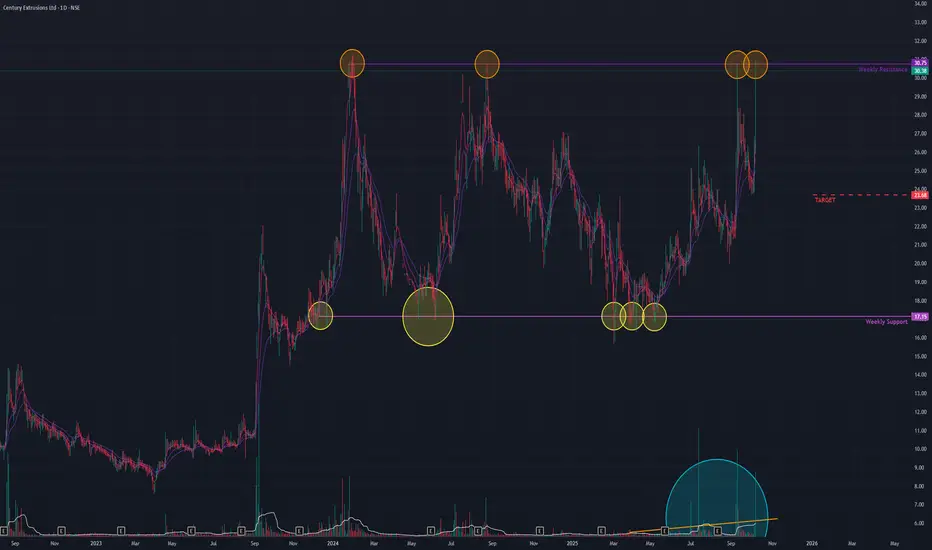
Century Extrusions (D) - Breakout or Fakeout?Century Extrusions has shown a significant sign of life after a prolonged period of sideways movement. However, a critical bearish indicator is flashing a warning sign, placing the stock at a crucial crossroads.
The Bullish Catalyst: A Powerful Surge
After a lackluster uptrend, the stock entered a consolidation phase in December 2023 , trading within a defined range. Today's session broke this monotony with authority:
- Massive Price Gain: The stock surged by +17.03% in a single session.
- Volume Spike: This price surge was backed by a significant spike in trading volume, indicating strong buyer participation.
- Resistance Retest: This move represents a serious attempt to break out of a persistent resistance trendline that has capped previous rallies.
Supporting this bullish action, key indicators are aligned positively across Monthly, Weekly, and Daily timeframes, with short-term Exponential Moving Averages (EMAs) in a positive crossover and the Relative Strength Index (RSI) showing rising momentum.
If the stock can successfully breach and sustain above the immediate resistance, the path could be clear for a move towards the ₹44 level.
The Bearish Warning: Waning Momentum
Despite the powerful price action, a significant red flag exists. A bearish divergence is clearly visible across the Monthly, Weekly, and Daily timeframes. This occurs when the price charts higher peaks while the RSI indicator forms lower peaks, suggesting that the underlying momentum is fading despite the price surge.
This divergence is a potent warning sign that the current breakout attempt may lack the strength to continue. If this signal proves true and the breakout fails, the stock could reverse course and decline towards the support level of ₹23 .
Conclusion and Outlook
The situation is a classic standoff between price action and momentum. The breakout is visually impressive, but the underlying bearish divergence cannot be ignored.
The price action over the next few trading sessions is critical for confirmation. A decisive close above the resistance would validate the bullish breakout, while failure to hold today's gains could confirm the bearish divergence, leading to a potential downturn. Prudent analysis requires waiting for the market to reveal its true direction.
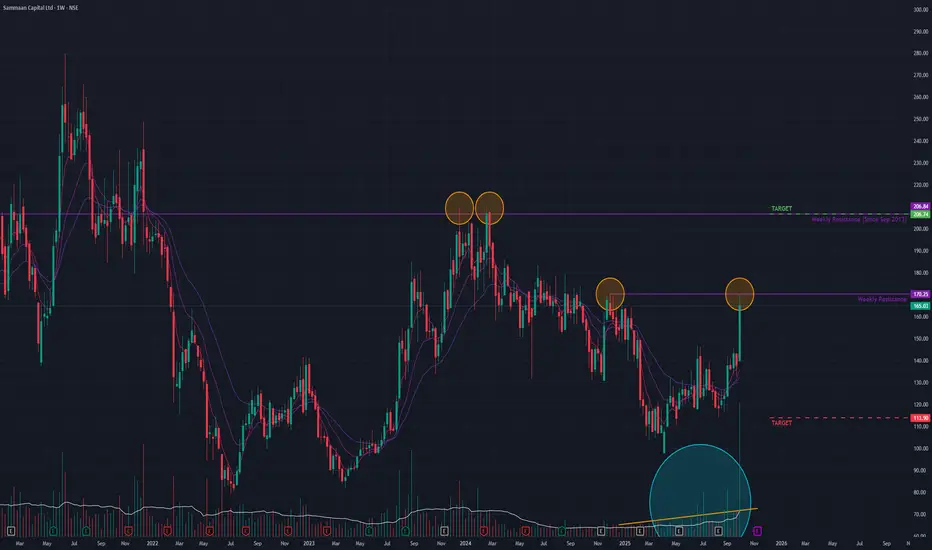
Sammaan Cap (W) - Poised for a Potential BreakoutAfter a prolonged downtrend that began in August 2018, Sammaan Capital transitioned into a sideways consolidation phase starting in March 2020.
Recently, the stock has shown significant bullish intent. Last week, it surged by +19.74% , accompanied by an exceptionally high volume spike of 462.74 million shares . This powerful move brought the price to the brink of breaking out from a key short-term resistance trendline.
Several technical indicators support a bullish outlook:
- Moving Averages: The short-term Exponential Moving Averages (EMAs) are in a state of positive crossover on both the monthly and weekly timeframes.
- Momentum: The Relative Strength Index (RSI) has also registered a positive crossover on both timeframes, signaling strong upward momentum.
- Volume: A steady increase in average volume suggests growing buyer interest.
Future Outlook:
The stock's direction hinges on its ability to overcome the immediate resistance.
- Bullish Scenario: If the current momentum is sustained and the stock achieves a decisive breakout with strong volume, the next potential target is the 205 level.
- Bearish Scenario: Conversely, a failure to breach this resistance could lead to a loss of momentum, potentially pulling the price back towards the 112 support level.
The price action in the coming week will be crucial in confirming the stock's next directional move.
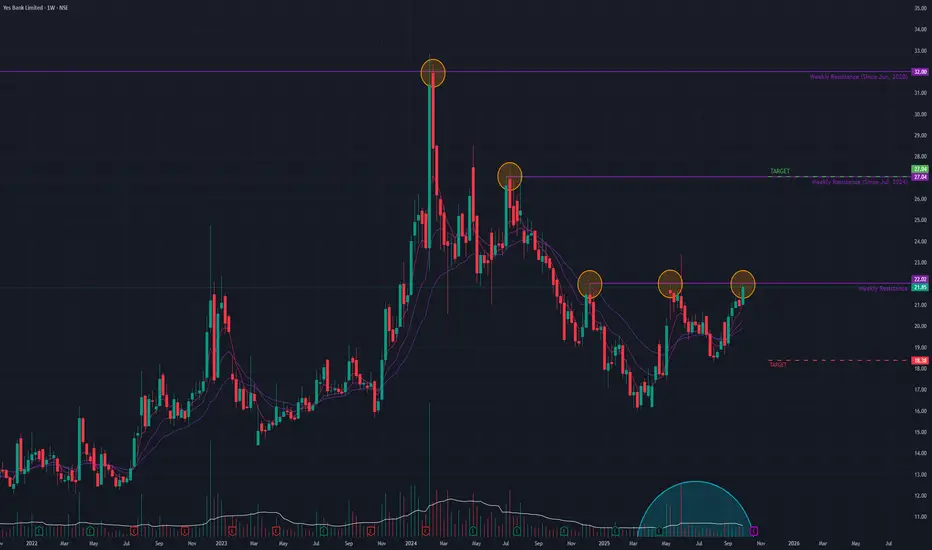
Yes Bank (W) - Challenges Key Resistance in Potential Trend RevYes Bank is showing signs of a potential trend reversal after being locked in a multi-year sideways consolidation since June 2020. Last week, the stock gained +4.2% on the back of a massive volume surge , indicating a significant increase in buyer interest.
The stock is now positioned directly below a critical horizontal resistance trendline . A decisive breakout above this level is required to confirm a shift from its long-term consolidation phase into a new uptrend.
Strong Long-Term Bullish Signals 👍
The potential for a reversal is supported by positive signals on higher timeframes:
- Monthly & Weekly Momentum: Short-term Exponential Moving Averages (EMAs) are in a bullish crossover state on both the monthly and weekly charts.
- Confirmed Strength: The Relative Strength Index (RSI) is also rising on both the monthly and weekly timeframes, confirming strong underlying momentum.
Outlook: A Breakout Awaits
The stock is at a crucial make-or-break point. While the long-term indicators are bullish, overcoming the overhead resistance is essential.
- Bullish Case 📈: If the current momentum is sustained and the stock achieves a decisive breakout, the next potential target is the ₹27 level.
- Bearish Case 📉: If the resistance holds and the momentum fades, the stock could pull back to find support near the ₹18 level.
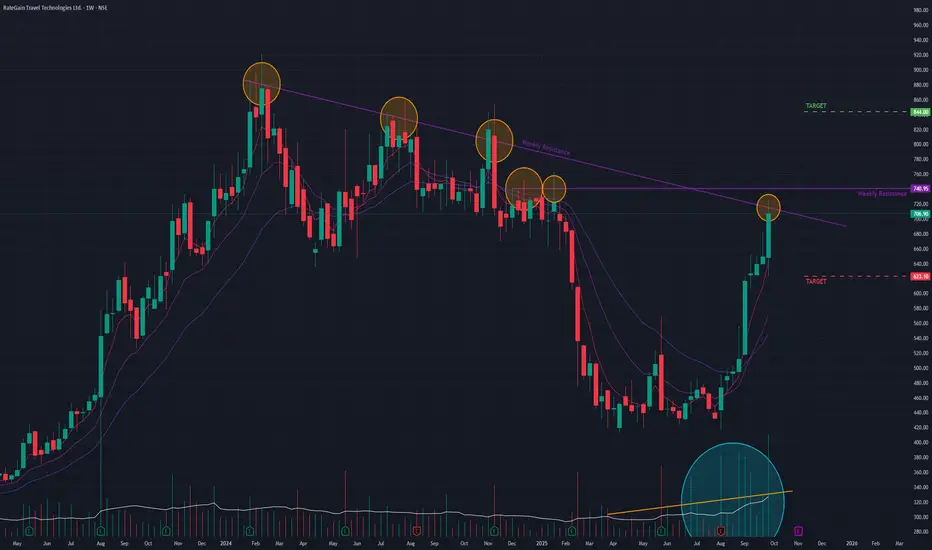
Rategain (W) - Challenges Major Resistance After Parabolic RallyFollowing a powerful trend reversal that began in August 2025, RateGain has surged over 70% and is now confronting a major confluence of resistance. The stock is simultaneously testing a long-term angular resistance trendline and a key horizontal resistance level .
This critical test comes after a prolonged downtrend that was in place since February 2024, positioning the stock at a crucial make-or-break point.
Strong Bullish Undertone 👍
The rally is supported by a host of positive technical indicators, suggesting strong underlying momentum leading into this resistance zone:
- Rising Volume: There has been a consistent increase in trading volume , indicating growing and sustained buyer interest.
- Positive Momentum: Short-term Exponential Moving Averages (EMAs) are in a bullish crossover state.
- Confirmed Strength: The Relative Strength Index (RSI) is also rising, confirming the bullish momentum.
Outlook: A Breakout Awaits Confirmation
The stock's ability to overcome this dual resistance will be the key determinant of its future trend.
- Bullish Case 📈: A decisive and high-volume breakout above both resistance levels in the coming week could trigger the next leg of the rally, with a potential price target of ₹845 .
- Bearish Case 📉: If the resistance holds and momentum fails to carry the stock through, a pullback towards the support level of ₹623 is possible.
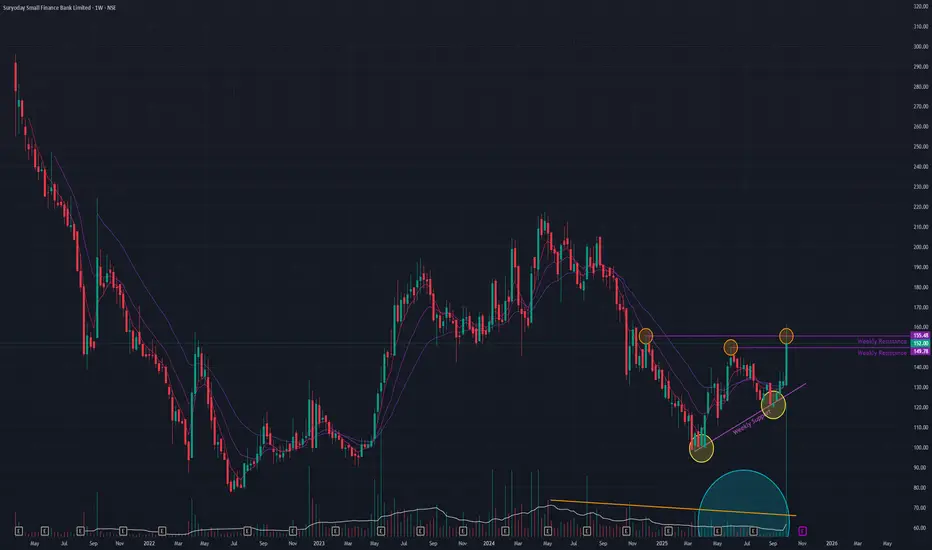
Suryoday (W) - Shows Reversal Signs but Halts at Key ResistanceSuryoday Small Finance Bank is showing signs of a potential trend reversal, marked by the recent formation of Higher Lows . Last week, the stock made a significant move, surging +14.38% on massive volume. During this session, it broke through two minor resistances but ultimately closed below a critical long-term resistance level .
This price action indicates a powerful attempt by buyers that was met with significant selling pressure at a key technical barrier.
Conflicting Technical Signals
The current technical landscape presents a mixed picture, highlighting the uncertainty at this juncture:
Bullish Signs 👍:
- Weekly Momentum: On the weekly timeframe, both the short-term Exponential Moving Averages (EMAs) and the Relative Strength Index (RSI) are in a bullish crossover state.
Bearish Signs 📉:
- Declining Volume: The overall trading volume has been drying up , which typically signals a lack of conviction from buyers, despite last week's volume spike.
Outlook: A Decisive Week Ahead
The stock is at a critical inflection point. The powerful surge last week shows bullish intent, but the failure to close above resistance and the low overall volume are causes for caution. The price action in the upcoming week will be crucial in determining whether the stock has the strength to finally break through resistance or if it will be rejected again.
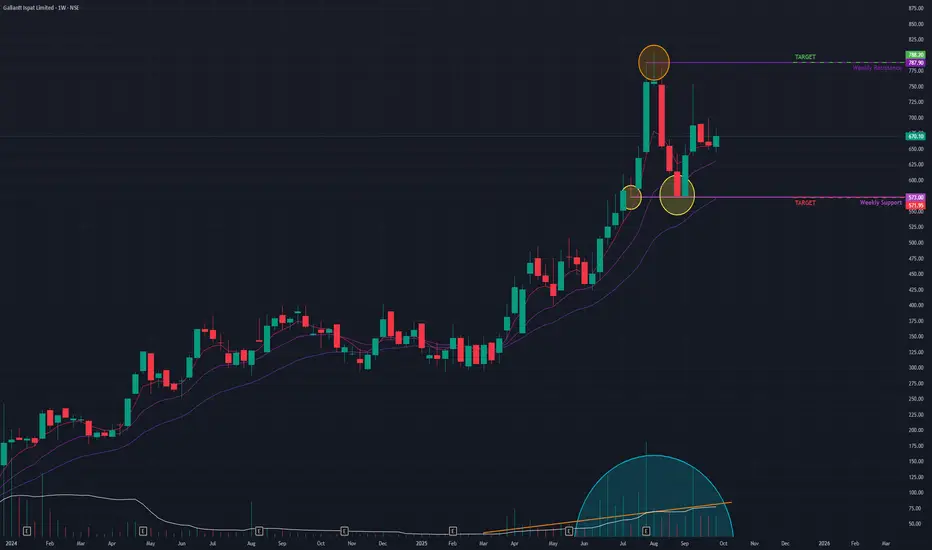
Gallant Isp (W) - Consolidates in Bullish Pattern After New ATHFollowing a powerful and sustained uptrend since May 2023, Gallantt Ispat Ltd. reached a new All-Time High (ATH) in August 2025. For the past few weeks, the stock has entered a healthy sideways consolidation phase . This type of consolidation after a strong rally is often a bullish continuation pattern, suggesting the primary uptrend is likely to resume.
Strong Underlying Bullish Indicators 👍
The positive long-term outlook is reinforced by several strong technical signals on higher timeframes:
- Sustained Volume: The average trading volume has been increasing , indicating growing and sustained interest in the stock.
- Long-Term Momentum: Short-term Exponential Moving Averages (EMAs) are in a bullish crossover state on both the monthly and weekly charts.
- Confirmed Strength: The Relative Strength Index (RSI) is also rising on both the monthly and weekly timeframes, confirming strong underlying momentum.
Outlook and Key Price Levels
The price action in the coming weeks will be crucial to determine the next move out of this consolidation.
- Short-Term Range: In the immediate term, the stock could fluctuate between a potential upside target of ₹780 and a downside support level of ₹570 .
- Long-Term Potential 📈: If the bullish momentum resumes and the stock breaks out of the current consolidation, a longer-term price target of ₹1,000 could be achievable.
Britannia holds mild bullish trend with steady support zonesTopic Statement:
Britannia remains a mildly bullish stock, resilient to broader market corrections and ideal for structured trading.
Key Points:
1. The stock recently formed a double top candlestick pattern, indicating possible short-term resistance
2. Price can be accumulated when it falls below the 50-day EMA, a level that has historically provided good entries
3. It moves within an up-trending bullish channel, making it well-suited for disciplined channel-based trading strategies

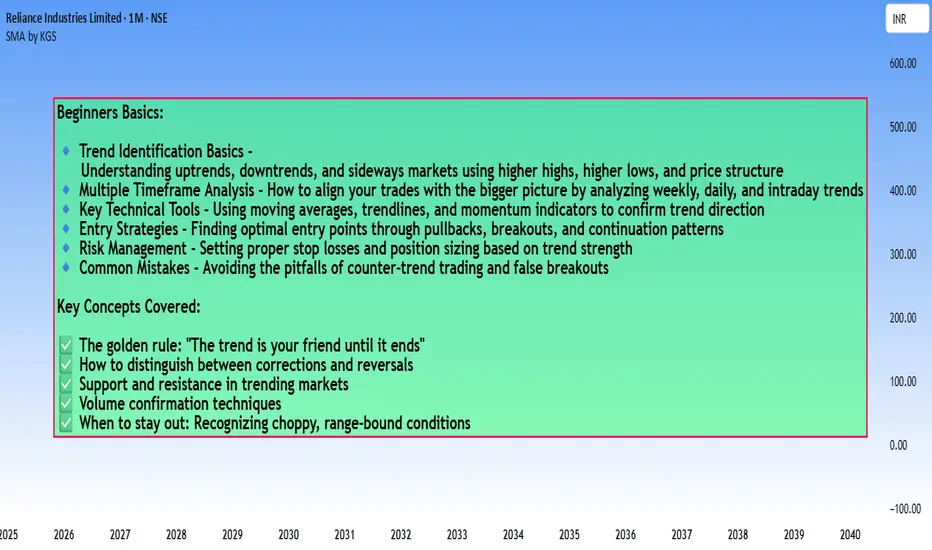
How to trade in the Right Trend - Beginners guide
How to Identify a Trend in a Chart?
Here's a practical breakdown of trend identification methods:
1. Price Structure Method (Most Fundamental)
Uptrend:
- Series of Higher Highs (HH) and Higher Lows (HL)
- Each peak is higher than the previous peak
- Each trough is higher than the previous trough
Downtrend:
- Series of Lower Highs (LH) and Lower Lows (LL)
- Each peak is lower than the previous peak
- Each trough is lower than the previous trough
Sideways/Range:
- Price oscillates between horizontal support and resistance
- No clear higher highs/lows or lower highs/lows
2. Moving Averages
Simple Rules:
- Price consistently above MA = Uptrend
- Price consistently below MA = Downtrend
- Price crossing back and forth = No clear trend
Popular MAs:
- 20 EMA (short-term)
- 50 SMA (medium-term)
- 200 SMA (long-term)
Golden Cross/Death Cross:
- 50 MA crosses above 200 MA = Bullish trend signal
- 50 MA crosses below 200 MA = Bearish trend signal
3. Trendline Method
Drawing Trendlines:
- Uptrend: Connect at least 2 higher lows with a straight line
- Downtrend: Connect at least 2 lower highs with a straight line
- The more touches, the stronger the trendline
- Price respecting the trendline confirms trend strength
4. Multi-Timeframe Analysis
The Complete Picture:
- Weekly chart: Overall market direction
- Daily chart: Intermediate trend
- 4H/1H chart: Entry timing
Rule: Always trade in the direction of the higher timeframe trend
#5. Indicators for Confirmation
ADX (Average Directional Index):
- Above 25 = Strong trend
- Below 20 = Weak/no trend
- Doesn't show direction, only strength
MACD:
- Histogram above zero = Uptrend
- Histogram below zero = Downtrend
- Crossovers signal potential trend changes
RSI:
- Consistently above 50 = Uptrend
- Consistently below 50 = Downtrend
6. Volume Confirmation
Healthy Trends Show:
- Rising volume on moves in trend direction
- Declining volume on corrections/pullbacks
- Volume spikes at breakout points
Quick Checklist for Trend Identification:
✅ Strong Uptrend:
- Higher highs and higher lows
- Price above rising moving averages
- Valid upward trendline intact
- ADX above 25
- Increasing volume on rallies
✅ Strong Downtrend:
- Lower highs and lower lows
- Price below falling moving averages
- Valid downward trendline intact
- ADX above 25
- Increasing volume on declines
⚠️ No Clear Trend (Stay Out):
- Choppy price action
- MAs flat or intertwined
- ADX below 20
- Price between support/resistance
Common Beginner Mistakes:
❌ Looking at only one timeframe
❌ Ignoring the bigger picture
❌ Trading every small wiggle as a "trend"
❌ Not waiting for confirmation
❌ Confusing corrections with reversals
Pro Tips:
💡 **The 3-Touch Rule:** A trend becomes more reliable after price respects a trendline at least 3 times
💡 **Trend is Your Timeframe:** What's an uptrend on daily might be a pullback on weekly
💡 **When in Doubt, Zoom Out:** Higher timeframes show the true direction
💡 **Trade WITH the trend, not against it:** Counter-trend trades have lower probability
**Remember:** Trend identification isn't about being perfect - it's about being on the right side of the market more often than not. Start with the basics (higher highs/lows), then add confirmation tools as you gain experience.
More updates with examples and Explanation on individual topics in a easy way to understand.
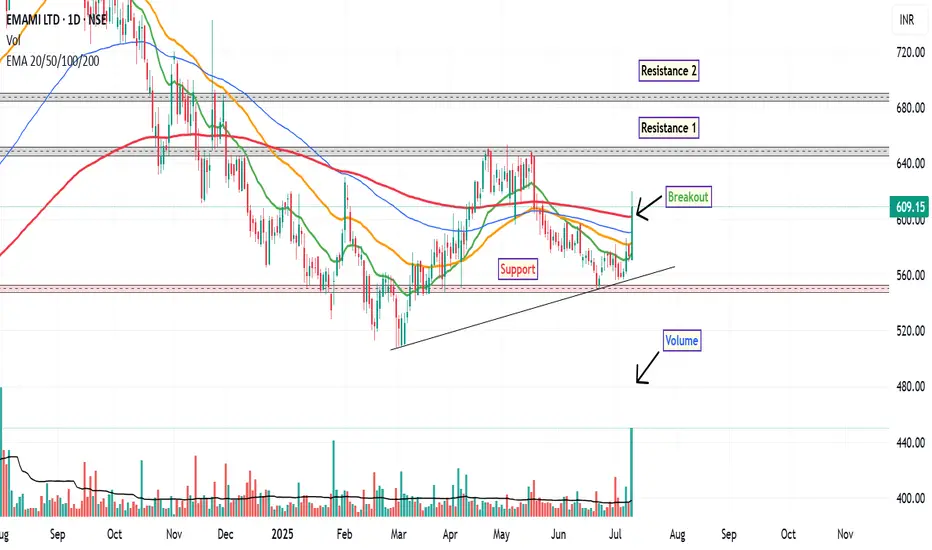
EMAMI: Technical Outlook UpdateFollowing a prolonged downtrend that began in September 2024, EMAMI Ltd. has recently exhibited signs of a potential short-term trend reversal on the daily chart. The stock has demonstrated a notable uptick in momentum, marked by several key technical developments.
The stock has decisively moved above its 200-day EMA, a level often regarded as a long-term trend indicator. This breakout was accompanied by a significant increase in trading volume—approximately 5 times the average volume of the 50-day moving average, suggesting heightened market participation. The RSI has crossed above the 60 level, indicating strengthening bullish momentum, though it is approaching the overbought zone.
A bullish crossover in the MACD was observed, further supporting the case for near-term strength.
Around ₹600, where the stock is currently consolidating post-breakout. First resistance near ₹650, Second resistance around ₹690. A technical stop-loss could be considered below ₹548, aligning with recent swing lows and support levels.
Disclaimer: This analysis is intended solely for educational and informational purposes. It does not constitute investment advice or a recommendation to buy or sell any financial instrument. Market participants are encouraged to conduct their own research or consult with a qualified financial advisor before making any trading decisions.
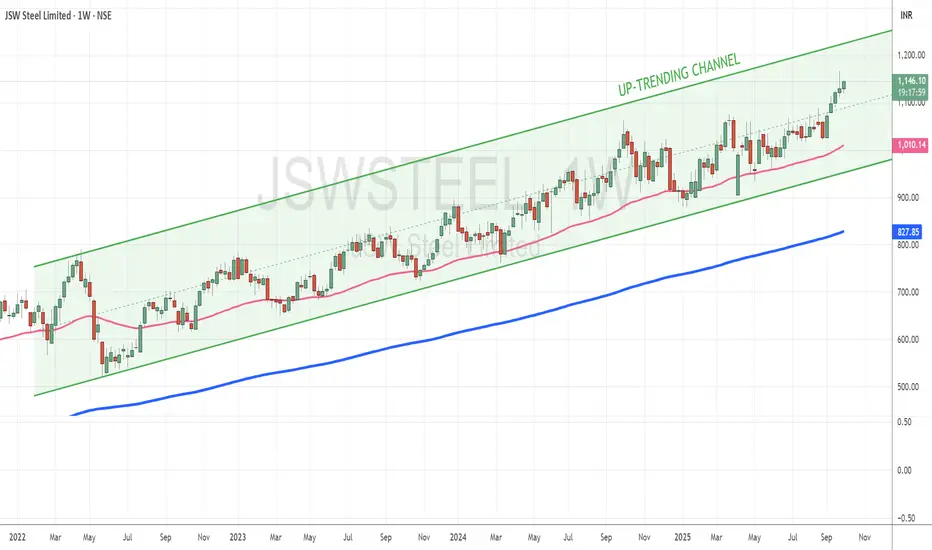
JSW Steel powers through bullish channel with momentumTopic Statement:
JSW Steel is on a relentless bullish run, steadily climbing within a strong up-trending channel that continues to attract accumulation.
Key Points:
1. The stock is moving consistently in a strong bullish channel, making directional trading highly structured and reliable
2. It rarely dips below the 50-day EMA, and when it does, it presents a strong investment or accumulation opportunity
3. The clearly defined channel makes it ideal for disciplined channel-based trading strategies
IFGL (D) - Rejects at Key Resistance Despite Massive VolumeIFGL Refractories is currently at a critical inflection point after a dramatic but ultimately unsuccessful breakout attempt. Yesterday, the stock surged an incredible +18.35% on massive, multi-year high trading volume, piercing a key horizontal resistance trendline .
However, the momentum was not sustained. Today, the stock faced selling pressure and closed back below this critical resistance level, signaling that sellers are still active at this price zone. This price action follows a period of uptrend and consolidation that began after the stock's initial downtrend from its All-Time High in December 2023.
Overwhelmingly Bullish Underlying Indicators 👍
Despite the failure to hold the breakout, the underlying technical picture remains exceptionally strong:
- Universal Bullish Crossover: Both the short-term Exponential Moving Averages (EMAs) and the Relative Strength Index (RSI) are in a confirmed bullish crossover state across the monthly, weekly, and daily charts .
- Volume Thrust: Yesterday's massive volume spike indicates a significant level of interest in the stock, even if it resulted in a short-term rejection.
Outlook: Awaiting a Confirmed Breakout
The stock is in a classic battle between strong underlying momentum and a stubborn overhead resistance. A decisive and sustained close above the resistance line is now required to confirm the next leg up.
- Bullish Case 📈: If buyers can overcome the selling pressure and secure a confirmed breakout, the next potential target is the ₹342 level.
- Bearish Case 📉: If the resistance continues to hold and momentum fades, the stock could pull back to find support near the ₹237 level. The price action in the coming days will be crucial.

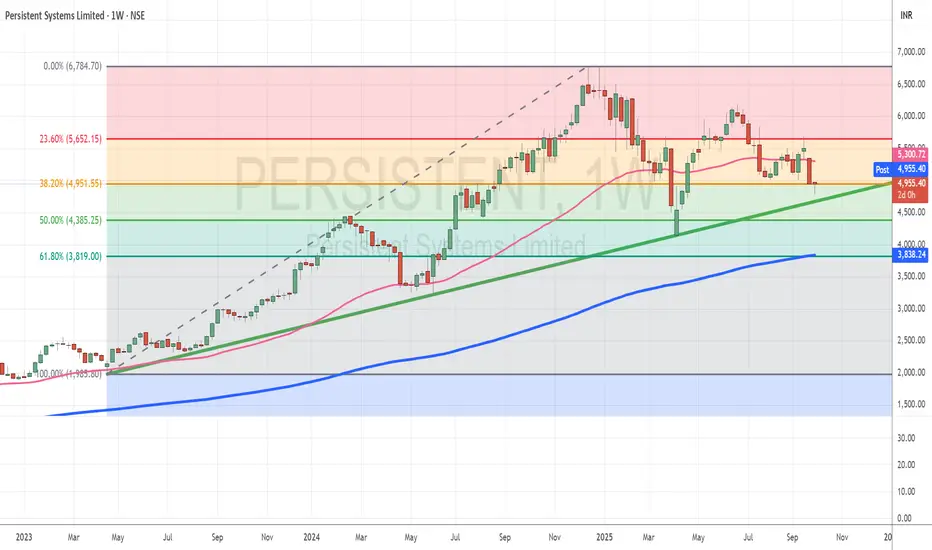
Persistent hovers near support after volatile swingsTopic Statement:
Persistent has seen a roller coaster price action this year and is now stabilizing near key technical and psychological support zones.
Key Points:
1. The stock is taking support at the 38.2% Fibonacci retracement level at 4951, a level it continues to hold
2. This support zone aligns with the barrier of 5000, reducing the likelihood of a breakdown
3. The price is also very close to a long-term trendline, adding structural strength to the current support
4. Currently trading below the 50-day EMA, the stock offers a strong investment opportunity at these levels based on past behavior
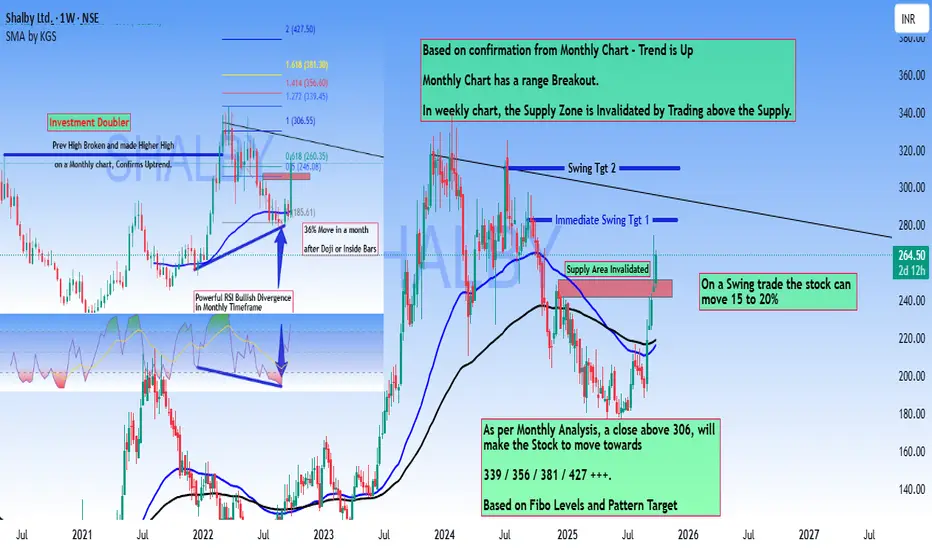
ShalbyLtd - Investment Doubler - High Conviction Trade Setup#Shalby Ltd - #Technical Analysis Report
Current Price: 264.50
Key Technical Signals
Bullish Confirmation from Multiple Timeframes:
- Monthly chart shows a confirmed range breakout with uptrend validation
- Previous high broken on monthly chart, establishing higher highs
- Powerful RSI Bullish Divergence observed in monthly timeframe
Weekly Chart Analysis:
- Supply zone has been invalidated by price trading above 246-250 Levels
- Stock is now in an active swing trade setup
- Expected Immediate 10 to 15% Move Swing Setup.
Investment Status:
The stock presents a compelling "Investment Double" opportunity, with the previous high broken and a higher high confirmed on the monthly chart. The pattern suggests significant upside potential after a period of consolidation.
Price Targets
Short-term Swing Trade: Potential move of 15-20% from current levels
Medium to Long-term Targets:
- ₹306 (Critical breakout level)
- ₹339
- ₹356
- ₹381
- ₹427++++
A decisive close above ₹306 will trigger momentum toward higher Fibonacci-based targets.
Risk Consideration
Expect a consolidation period of approximately one month following Doji or inside bar formations before the next major move materializes.
Conclusion
Shalby Ltd presents a strong technical setup with multiple timeframe confirmation. The invalidation of the supply zone and monthly breakout suggest the stock is positioned for a sustained upward movement. Traders should monitor the ₹306 level closely for breakout confirmation.
Disclaimer: Charts shared only for Educational purpose only. Its not a trade recommendation. Do your own analysis to survive in Trading for a longer run.
BBox (D) - Confirms Major Breakout After Prolonged StruggleBlack Box has successfully broken out from a major angular resistance trendline that had been a significant barrier since the stock's trend reversed in April 2025. After multiple failed attempts, the stock has spent the last few days decisively trading above this line, a move validated by sustained high volume and successful retests of the broken resistance as new support.
The breakout was further emphasized yesterday when the stock opened with a significant gap up , firmly establishing its position above the trendline. This entire sequence follows a bullish Double-Bottom reversal pattern in April 2025, which ended the downtrend from the stock's All-Time High in December 2024.
Comprehensive Bullish Confirmation 👍
The technical outlook is overwhelmingly positive, with strong confirmation across multiple timeframes:
- Multi-Timeframe Strength: The short-term Exponential Moving Averages (EMAs) are in a bullish crossover state across the daily, weekly, and monthly charts .
- Broad Momentum: The Relative Strength Index (RSI) also confirms a bullish crossover on the daily and weekly charts and is on the verge of doing so on the monthly chart.
- Volume Thrust: The breakout and subsequent trading have been characterized by exceptionally high volume , indicating strong institutional interest.
Outlook and Next Hurdle
While the breakout from the angular resistance is confirmed, the stock now faces another challenge: a long-term horizontal resistance trendline .
- Bullish Case 📈: If the current momentum is sustained and the stock can breach this upcoming horizontal resistance, the path could be clear for a move towards the ₹630 level.
- Bearish Case 📉: If this breakout proves to be false and momentum fades, the stock could pull back to find support near the ₹450 level. The price action in the coming days remains critical.

NALCO (D) - Challenges Major Resistance with Strong MomentumNational Aluminium is making a powerful attempt to break through a major resistance level that has previously thwarted several breakout attempts. The stock surged +4.88% today, closing at ₹213.87 on the back of exceptionally high trading volume, signaling strong buyer interest at this critical juncture.
This move is part of a broader uptrend that began in April 2025, which itself was a reversal from a downtrend following the stock's All-Time High in November 2024.
Broad-Based Bullish Signals Building 👍
The underlying technical picture is strong and showing signs of further improvement:
- Confirmed Long-Term Strength: The short-term Exponential Moving Averages (EMAs) are in a bullish crossover state on both the monthly and weekly charts. The Relative Strength Index (RSI) also confirms a bullish crossover on the weekly chart.
- Developing Daily Momentum: On the daily chart, both the EMAs and RSI are on the verge of a bullish crossover , which would provide immediate-term confirmation. The monthly RSI is in a similar poised-to-cross state.
- Volume Thrust: Today's price surge was driven by massive volume , indicating a high level of conviction from buyers.
Outlook: Awaiting a Decisive Breakout
The stock is at a pivotal point. While the indicators are overwhelmingly bullish, a confirmed close above the current resistance is necessary.
- Bullish Case 📈: If the stock successfully breaks and sustains its position above the key resistance, especially on good volume, the next potential price target is the ₹245 level.
- Bearish Case 📉: If it is rejected at this resistance once again and momentum fades, the stock could pull back to find support near the ₹195 level.

Investment Stock Analysis - BHEL Strong BuyTechnical Aanalysis
After making HH in July 24. Stock came to Prev Breakout Levels to Retest
and currently in Accumulation before making fresh Higher High.
1) Inverted Head & SHoulder in formation. Pattern will be active when Strong closing above 261. Inactive if Closes below 179.
2) Currently within falling wedge resistance. Confirmative entry will be above candle closing above 264.
3) Multiple and Confirmed Patterns on Weekly and Monthly Charts
4) Hidden Divergence formed in a weekly Tf, confirm Trend Conformation towards prev high and Fresh Higher High.
4) Strong candidate to hold for Better returns on Short to Long term Investment.
Disclaimer: Views shared are for Educational purpose only. Initiate your own analysis before taking any trades.

Munjal Au (D) - Challenges Major Resistance with Strong MomentumMunjal Auto Industries is showing significant bullish strength, surging +5.28% today on the back of massive trading volume. The stock has successfully broken through one long-term resistance and is now positioned just below a second, even more significant, long-term resistance level.
This powerful move is part of a broader trend reversal that began in March 2025, following a downtrend from the stock's All-Time High in October 2024.
Overwhelmingly Bullish Technical Confirmation 👍
The positive outlook is supported by a rare and powerful alignment of bullish indicators across all major timeframes:
- Broad-Based Momentum: Both the short-term Exponential Moving Averages (EMAs) and the Relative Strength Index (RSI) are in a bullish crossover state on the monthly, weekly, and daily charts .
- Golden Crossover: A Simple Moving Average (SMA) Golden Crossover occurred a few days ago, providing a strong long-term bullish signal.
- Volume Thrust: The recent price gains have been accompanied by significant volume spikes , indicating strong buyer conviction.
Outlook and Key Levels
The stock is at a critical juncture, facing a major long-term resistance. A successful breakout is required to confirm the next leg of the uptrend.
- Bullish Case 📈: If the upward momentum is sustained and the stock decisively breaks through the current resistance, the next potential target is the ₹127 level.
- Bearish Case 📉: If the stock is rejected at this major resistance and momentum fades, it could pull back to find support near the ₹90 level.

Cipla stays sideways as global policy risks loomTopic Statement:
Cipla has remained stuck in a sideways range for months, with potential downside pressure emerging from shifting global policies.
Key Points:
1. The stock has been hovering around the 23.6% Fibonacci retracement level at 1502, influenced by both national and global economic factors
2. Price is currently sitting on the 50-day EMA, offering short-term directional ambiguity
3. The stock may follow the drawn trend line, which could guide its next movement depending on policy and market developments

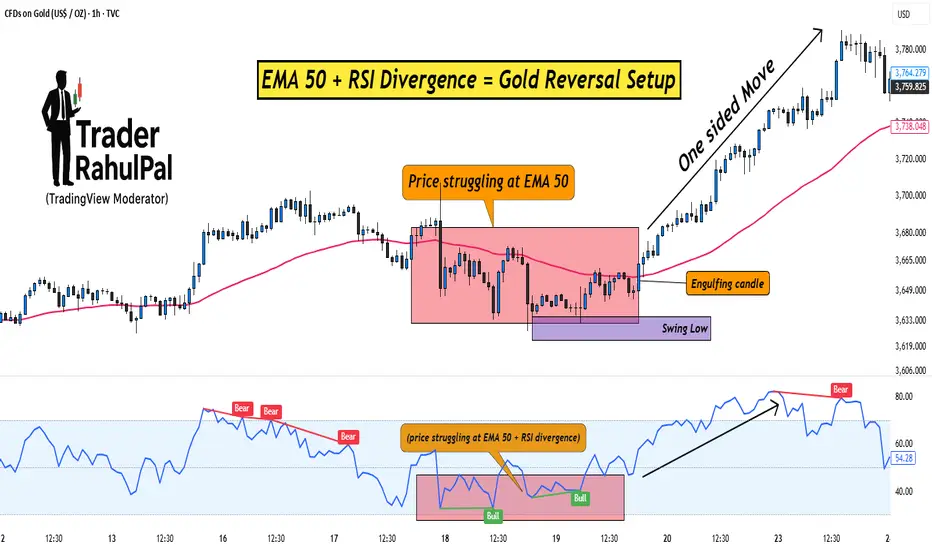
EMA 50 + RSI Divergence = Gold Reversal Setup!Hello Traders!
Gold often makes sharp one-sided moves, trapping traders who enter too late. But if you know how to combine a simple moving average with a momentum indicator, you can spot high-probability reversal setups.
One such method is using the EMA 50 together with RSI Divergence . Let’s break down how it works.
1. Why EMA 50?
The 50-period EMA acts as a dynamic trend filter.
When gold trades above it, the short-term trend is bullish; below it, bearish.
Price often retests the EMA 50 during pullbacks, making it a key level to watch for reversals.
2. What is RSI Divergence?
Divergence happens when price makes a new high/low, but RSI doesn’t confirm it.
Example: Price makes a higher high, but RSI makes a lower high → bearish divergence.
This signals that momentum is weakening, even if price is still moving strongly.
3. Combining EMA 50 with RSI Divergence
First, check where price is relative to EMA 50.
Next, look for divergence on RSI near that zone.
If both align (price struggling at EMA 50 + RSI divergence), chances of a reversal increase sharply.
4. Entry & Risk Management
Wait for a confirmation candle near EMA 50 (like engulfing or pin bar).
Place stop loss just above recent swing high/low.
Target the next support/resistance zone for exits.
Rahul’s Tip:
Don’t use divergence alone, combine it with EMA 50 for structure and you’ll filter out most false signals. This setup works best on higher timeframes like 1H or 4H for gold.
Conclusion:
EMA 50 gives you the trend filter, and RSI divergence reveals momentum weakness.
Together, they form a reliable reversal setup that helps you enter gold trades at the right time instead of chasing moves.
This Educational Idea By @TraderRahulPal (TradingView Moderator) | More analysis & educational content on my profile
If this post gave you a new setup idea, like it, share your thoughts in comments, and follow for more practical trading strategies!
Asian Paints struggles to recover, trades near oversold zoneTopic Statement:
Asian Paints has shown a weak recovery from its recent correction and suffered further downside in Friday’s market drop, now hovering in deeply oversold territory.
Key Points:
1. The stock continues to receive strong support at the 61.8% Fibonacci retracement level
2. Price is currently trading below both the 50 and 200-day EMAs, signaling an oversold condition and a strong long-term buying opportunity
3. It is moving within a short-term mildly bullish channel, though the momentum remains subdued compared to broader market trends

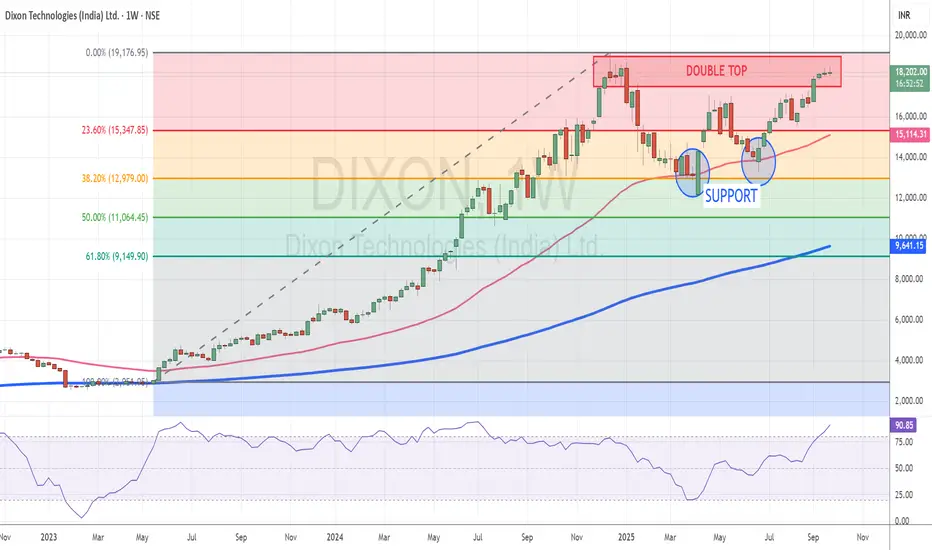
Dixon nears lifetime high after sharp recoveryTopic Statement:
Dixon has rebounded strongly in line with the broader market rally but now approaches critical resistance levels that may cap further upside.
Key Points:
1. The stock retraced to the 38.2% Fibonacci level where it found strong support and resumed its upward move
2. The 50-day EMA acted as a deflection point, offering additional support during the recovery
3. Price is now at its lifetime high near the 18,000 mark, where a double top candlestick pattern is forming
4. The double top indicates significant resistance, making it a potential shorting opportunity unless a breakout confirms further bullishness