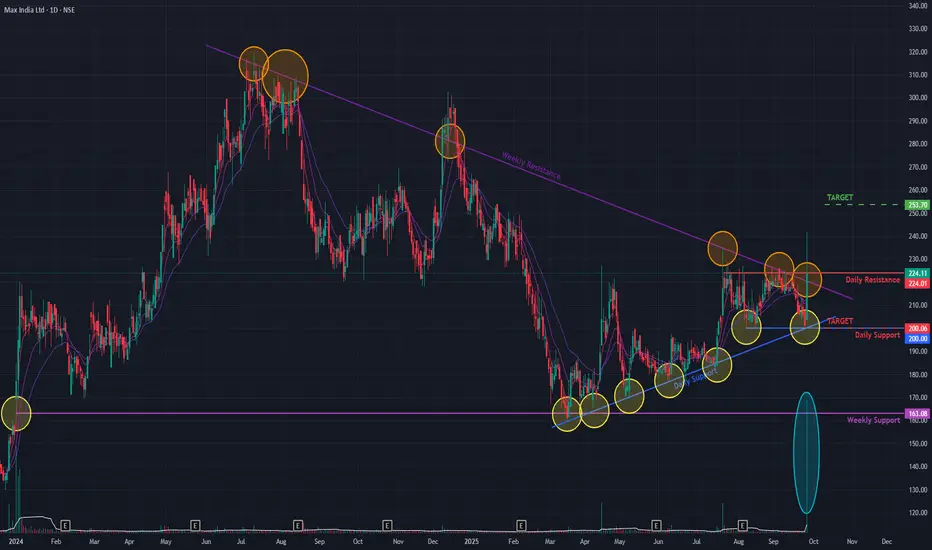
Max India (D) - Executes a Powerful Dual-Resistance BreakoutMax India has shown a significant bullish development, decisively breaking out of two key resistance levels today. The stock breached both a long-term angular resistance trendline from July 2024 and a short-term resistance from July 2025. This powerful move was confirmed by a massive surge of +14.95% on the back of exceptionally high trading volume, with the stock closing at ₹224.11 .
This breakout signals a potential acceleration of the reversal that began in March 2025, following a prolonged downtrend from the stock's All-Time High in July 2024.
A Mix of Bullish Indicators 👍
The technical landscape shows a confluence of positive signals, although some are still developing:
- Broad Momentum: The Relative Strength Index (RSI) is in a bullish crossover state on both the weekly and daily charts, confirming strong momentum.
- Long-Term Strength: A Golden Crossover appeared on the daily chart a few days ago, providing a strong long-term bullish signal.
- Developing Confirmation: While short-term Exponential Moving Averages (EMAs) show a bullish crossover on the weekly chart, they have not yet confirmed this on the daily timeframe, suggesting immediate-term momentum is still catching up.
Outlook: Awaiting Confirmation
While the breakout is powerful, re-confirmation is prudent. A common technical event is a retest of the broken resistance levels as new support.
- Bullish Case 📈: If the momentum continues and the breakout is sustained, the next potential target on the upside is the ₹250 resistance level.
- Bearish Case 📉: If the breakout fails to hold and momentum subsides, the stock could pull back to find support near the ₹200 level.
Moving Averages
HINDCOPPER H&S BREAKOUTHindcopper breaking H&S pattern weekly
huge volume this week with bullish rsi above 60
target1 375 target2 416
trading above all key ema
NO BUY/SELL RECOMENDATION

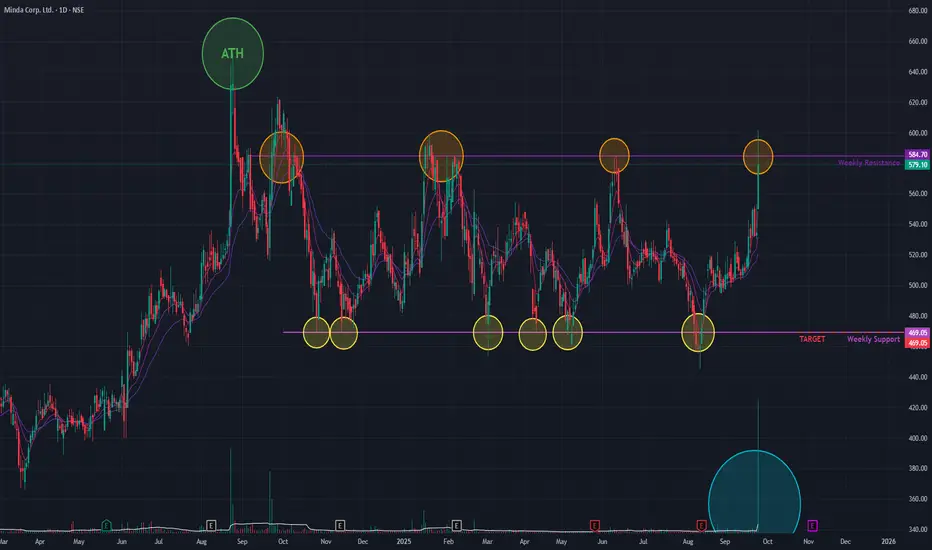
Minda Corp (D) - Challenges Major Resistance with Massive VolumeMinda Corp is making a powerful attempt to break out of a prolonged consolidation phase that has been in place since its All-Time High in August 2024. Today, the stock surged +8.34% on the back of exceptionally high trading volume —the largest spike seen in a considerable time.
The stock challenged a major resistance trendline that has been a barrier since September 2024, rejecting multiple breakout attempts. While today's price action breached this level intra-day, it failed to achieve a close above it , signaling that the battle between buyers and sellers at this critical juncture is not yet over.
Broad-Based Bullish Signals 👍
Despite the failed closing, the underlying technical picture is strong, with multiple indicators suggesting a bullish bias:
- Multi-Timeframe Strength: The short-term Exponential Moving Averages (EMAs) and the Relative Strength Index (RSI) are all indicating bullish crossovers on the monthly, weekly, and daily charts .
- Volume Thrust: Today's massive volume spike underscores the significant buying interest at this resistance level, even if it was not enough to secure a close above it.
Outlook: Awaiting a Decisive Close
The stock is at a critical inflection point. A decisive close above the resistance line on high volume is now required to confirm a true breakout.
- Bullish Case 📈: If a confirmed breakout occurs and the momentum is sustained, the next potential target is the resistance zone near ₹701 .
- Bearish Case 📉: If the stock is rejected again at this level, it could fall back to the lower end of its consolidation range, with a potential support level near ₹469 . The price action in the coming days will be crucial.
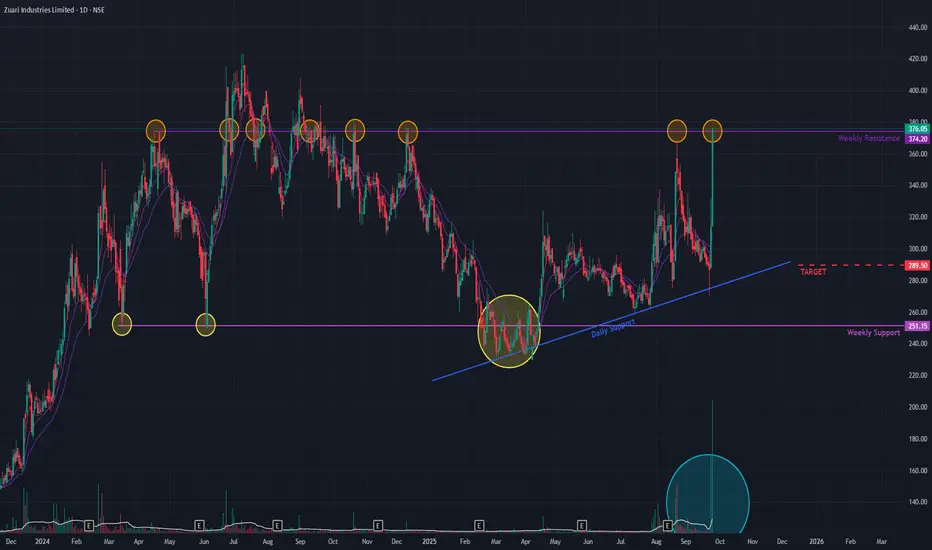
Zuari Ind (D) - Executes a Powerful BreakoutZuari Industries has decisively broken out of a prolonged consolidation phase, signaling a significant shift in momentum. Over the past two trading sessions, the stock has surged an incredible +29.72% , a move backed by a massive volume spike that validates the breakout from a key horizontal resistance level in place since April 2024. The stock closed today at ₹376.04 , hitting the 20% upper circuit.
This breakout appears more decisive than previous "fakeouts" due to the sheer force of the move and the exceptionally high volume. Furthermore, the strong closing candle, with its high and close being nearly identical, suggests intense buying pressure and a willingness for participants to push the price even higher.
Comprehensive Bullish Confirmation 👍
The bullish outlook is strongly supported by a rare alignment of positive indicators across all major timeframes:
- Multi-Timeframe Strength: Both the short-term Exponential Moving Averages (EMAs) and the Relative Strength Index (RSI) are indicating strong bullish crossovers on the monthly, weekly, and daily charts .
- Volume Thrust: The breakout was driven by enormous trading volume , indicating a high level of conviction and institutional participation.
Outlook and Key Levels
This powerful breakout has potentially initiated a new uptrend. The price action in the coming days will be crucial to confirm that buyers can absorb any profit-taking and hold the breakout level.
- Bullish Case 📈: If the current momentum is sustained, the next logical price target is the resistance zone near ₹497 .
- Bearish Case 📉: Should the breakout fail and momentum reverse, the stock could pull back to find support near the previous resistance (now support) level of ₹289 .
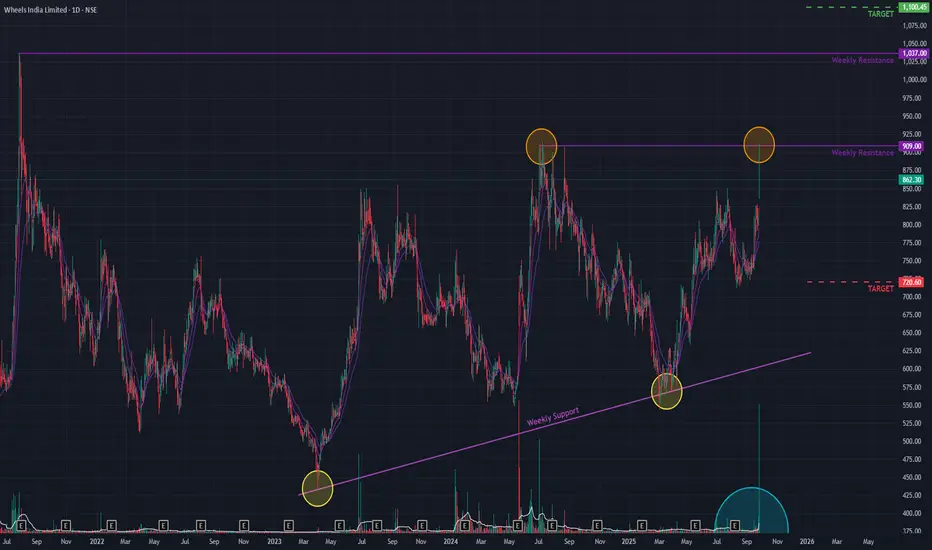
Wheels India (D) - Challenges Key Resistance with Massive VolumeWheels India is making another powerful attempt to break through a key horizontal resistance level that has been in place since July 2024. The stock, which has been in a long-term uptrend since March 2020, has been rejected at this level multiple times.
Today's session was marked by a gap-up opening and an exceptionally high trading volume , significantly larger than in previous attempts, signaling strong bullish intent. However, despite this strength, the stock closed at ₹862.30 , just below the critical resistance, indicating that the battle is not yet won.
Broad-Based Bullish Confirmation 👍
The underlying technical picture remains strong, with multiple indicators suggesting building positive pressure:
- Multi-Timeframe Strength: Both the short-term Exponential Moving Averages (EMAs) and the Relative Strength Index (RSI) are showing bullish crossovers on higher timeframes, confirming broad-based positive momentum.
- Volume Thrust: Today's massive volume spike indicates a significant increase in buyer participation at this crucial juncture.
Outlook: Awaiting a Decisive Close
The stock is at a critical inflection point. While the underlying indicators are bullish, a decisive close above the resistance is needed for confirmation.
- Bullish Case 📈: If the stock successfully breaks and holds above the current resistance, it could clear the path for a move towards the next major hurdle near the ₹1,100 level.
- Bearish Case 📉: If it is rejected once again and the momentum fades, the stock could pull back to find support near the ₹720 level. The price action in the coming days will be crucial.
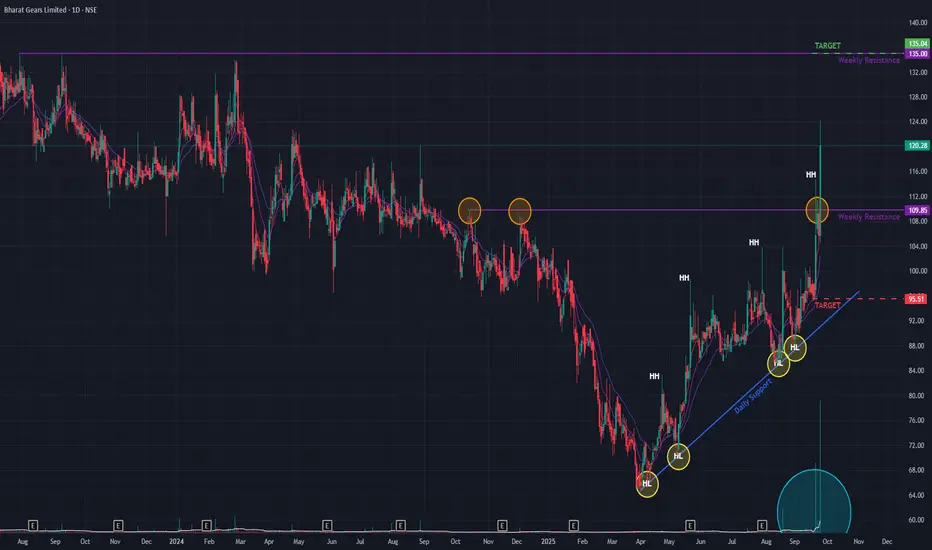
Bharat Gears (D) - Executes a Decisive BreakoutBharat Gears has confirmed a significant bullish development, decisively breaking out of a key resistance trendline. Today's powerful move saw the stock surge +13.74% to close at ₹120.28 , on the back of massive trading volume that was multiple times the recent average. This action reinforces the uptrend that began in April 2025, which has been characterized by a consistent pattern of higher highs and higher lows.
Notably, after several attempts over the past four days, today’s breakout was significant as the stock closed firmly above the resistance level, a strong technical confirmation.
Comprehensive Bullish Confirmation 👍
The breakout is validated by an overwhelmingly strong alignment of bullish signals across all major timeframes:
- Multi-Timeframe Momentum: The short-term Exponential Moving Averages (EMAs) are in a bullish crossover on the monthly, weekly, and daily charts .
- Dual Confirmation: This positive momentum is corroborated by the Relative Strength Index (RSI) , which also indicates a bullish crossover across all three timeframes.
- Volume Thrust: The breakout was accompanied by an exceptionally high volume spike , signaling strong conviction and participation from buyers.
Outlook and Key Levels
Following such a powerful breakout, the stock may potentially retest the breached resistance level as new support . This is a common technical pattern and would serve as further confirmation of the uptrend's strength.
- Bullish Case 📈: If the upward momentum is sustained, particularly on good volume, the next potential price target is the resistance zone around ₹135 .
- Bearish Case 📉: Conversely, if the breakout fails to hold and momentum is lost, the stock could pull back to find support near the ₹95 level.
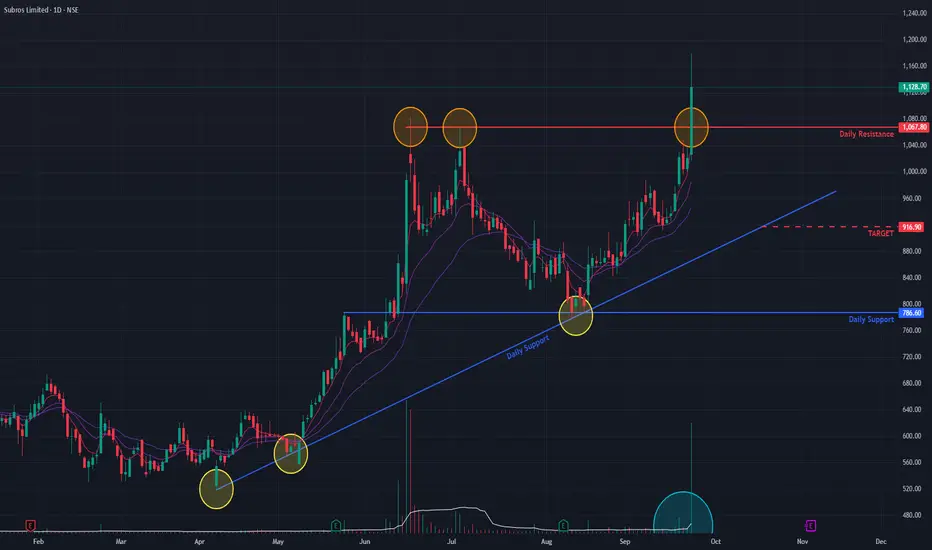
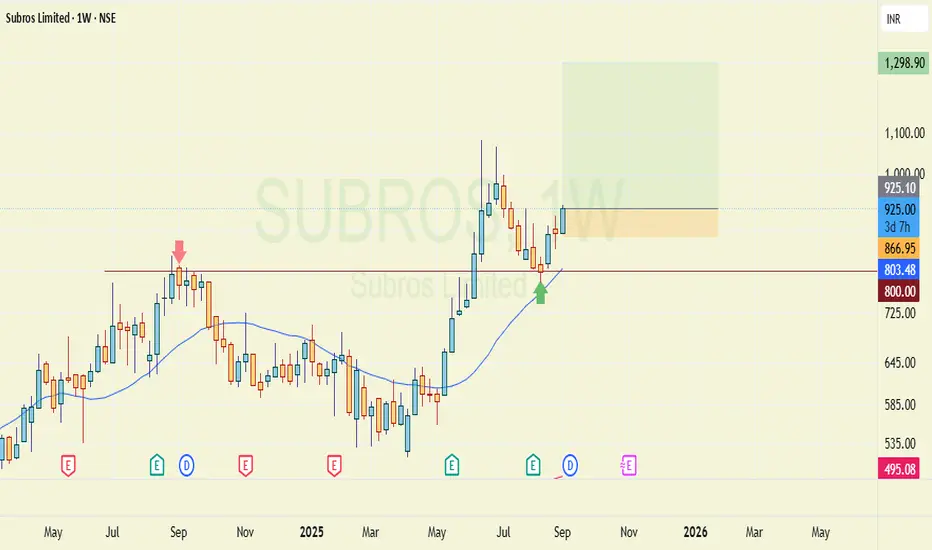
Subros (D) - Hits New ATH, Breaking Out of ConsolidationSubros has demonstrated exceptional strength, surging to a new All-Time High (ATH) today with a significant +10.45% gain . This powerful move was supported by a massive spike in trading volume, suggesting the potential end of the sideways consolidation phase that has been in place since June 2025.
Comprehensive Bullish Confirmation 👍
The breakout is validated by a strong alignment of bullish signals across all major timeframes:
- Multi-Timeframe Momentum: The Relative Strength Index (RSI) is indicating a bullish state on the monthly, weekly, and daily charts , showcasing broad-based strength.
- Short-Term Confirmation: The short-term Exponential Moving Averages (EMAs) are in a strong bullish crossover, confirming the immediate upward momentum.
- Volume Thrust: The breakout was accompanied by an exceptionally high volume spike , indicating strong conviction from buyers.
Outlook and Key Levels
Following a significant breakout, a retest of the previous resistance trendline as new support would provide strong confirmation of a continued uptrend.
- Bullish Case 📈: If the upward momentum is sustained, the next potential price target on the upside is ₹1,347 .
- Bearish Case 📉: Conversely, if the breakout fails to hold and momentum is lost, the stock could pull back to find support near the ₹916 level.
Axis Bank rally faces overbought pressureTopic statement:
Axis Bank has rallied sharply over the past 10 sessions, but signs of short-term exhaustion and resistance suggest a potential pause or pullback.
Key points:
1. The recent price surge has filled the gap created on 18th July 2025, reaching a potential resistance zone
2. MFI is elevated at 86, indicating the stock is highly overbought in the short term
3. Candlesticks have formed a steep 70-degree ascent, reflecting sharp bullish intensity
4. Price has jumped above both the 50 and 200-day EMAs, signaling strong momentum but potential overheating
5. The stock may now consolidate below the 1200 level due to increased selling pressure
6. The long-term bullish channel remains intact, as price bounced off the lower trendline support during its recent move

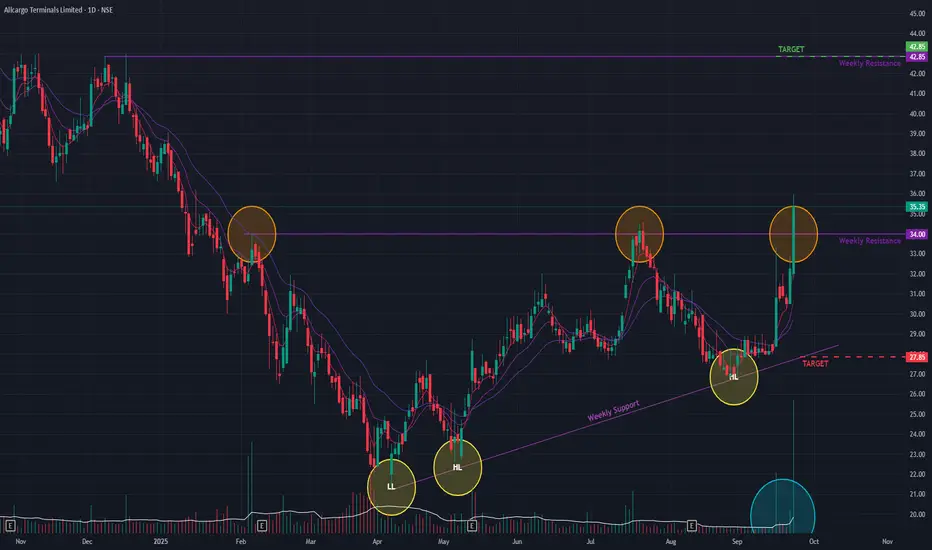
ATL (D) - Signals Bullish Reversal with Powerful BreakoutAllcargo Terminals has demonstrated a significant bullish development, suggesting its long-term downtrend may be reversing. Today, the stock decisively broke out of a key horizontal resistance trendline , a move confirmed by an impressive +9.61% price surge on the back of massive trading volume.
This breakout is the latest in a series of positive signs since May 2025, including the consistent formation of Higher Lows , which indicated a potential shift in market structure after the downtrend from January 2024.
Broad-Based Bullish Confirmation 👍
The positive outlook is strongly supported across multiple indicators and timeframes:
- Volume Thrust: The breakout was accompanied by exceptionally high volume , signaling strong conviction from buyers.
- Daily & Weekly Momentum: Both the short-term Exponential Moving Averages (EMAs) and the Relative Strength Index (RSI) are exhibiting bullish crossovers on both the daily and weekly charts, indicating synchronized positive momentum.
Outlook and Key Levels
Following a strong breakout, a common technical development is a retest of the former resistance level as new support . The price action in the coming days will be crucial for confirming the breakout's validity.
- Bullish Case 📈: If the momentum is sustained and the breakout level holds, the stock could proceed towards the next resistance target near ₹42 .
- Bearish Case 📉: However, if the stock fails to hold the breakout and momentum wanes, it could pull back towards the support level of ₹27 .
Resistance to support:Subros800 levels have acted as good resistance in sept 24 and now after a year it has acted as support.
This level is also 20week sma.
Target and SL on chart. This makes it a high probability bullish trade.
It will take 5~8 months for target.
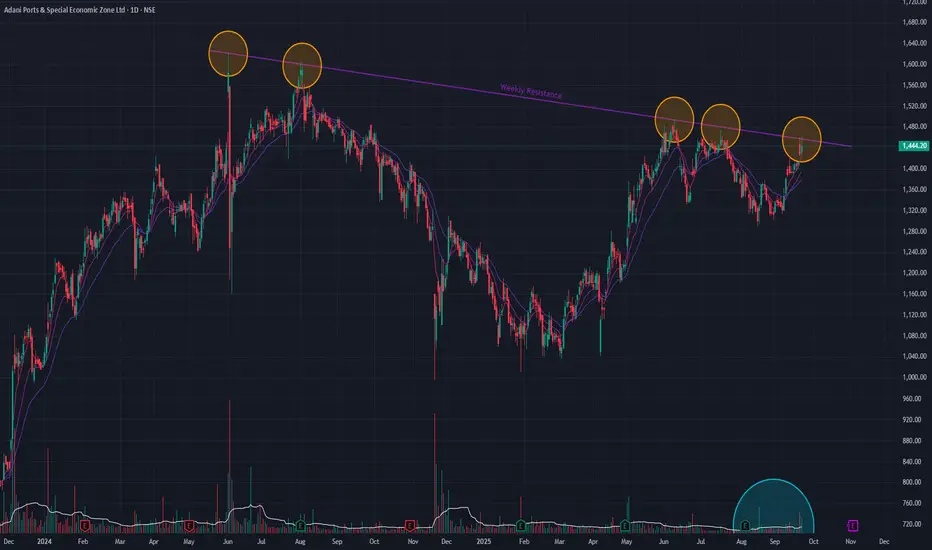
Adani Ports (Daily) - Coils for Potential BO at Critical ResAdani Ports is currently testing a significant long-term angular resistance trendline , a barrier that has persisted since the stock's All-Time High in June 2024. The stock has been in a sideways consolidation phase since March 2025, following a prolonged downtrend, and is now showing signs of building pressure against this key resistance.
Recent price action suggests a growing determination to break through, with breakout attempts becoming more frequent . Today's session saw a notable increase in trading volume, adding weight to this observation.
Broad-Based Bullish Signals 👍
The bullish case is strengthened by a confluence of indicators across multiple timeframes:
- Strong Momentum: On both the daily and weekly charts , short-term Exponential Moving Averages (EMAs) are in a bullish crossover state.
- Dual Confirmation: This is further corroborated by the Relative Strength Index (RSI) on both timeframes, which is also exhibiting a bullish crossover, confirming broad-based positive momentum.
Outlook: Awaiting Confirmation
The stock is at a critical inflection point. While multiple indicators are signaling a strong potential for an upward move, the long-term resistance remains a formidable obstacle. The price action in the coming days will be decisive. A confirmed breakout would signal the next major leg up, but until then, a cautious approach is warranted while waiting for the market to show its hand.
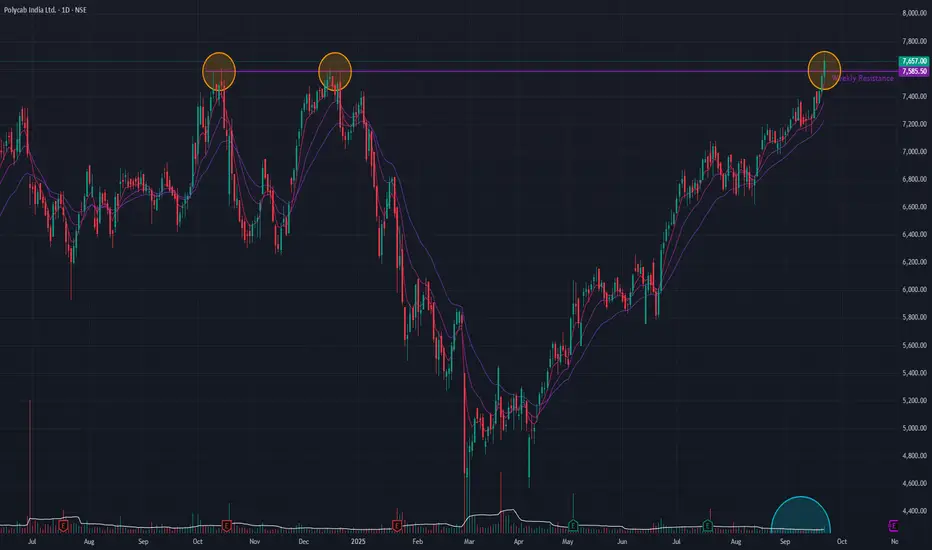
Polycab (Daily) - Reaches New ATH with Decisive BreakoutPolycab has demonstrated exceptional strength, achieving a new All-Time High (ATH) today. The stock decisively broke out of a significant long-term horizontal resistance level , a move that was confirmed by a healthy surge in trading volume.
This breakout is the latest milestone in a powerful rally that began from a Double-Bottom pattern in April 2025 . Since that point, the stock has surged over 65% to date.
Broad-Based Bullish Confirmation 👍
The bullish momentum is confirmed across multiple indicators and timeframes:
- Sustained Volume: Trading volume has remained consistently around the average in the recent past, indicating steady accumulation and persistent buyer interest.
- Daily Momentum: On the daily chart, both the short-term Exponential Moving Averages (EMAs) and the Relative Strength Index (RSI) are in a strong bullish crossover state.
- Weekly Strength: This positive sentiment is echoed on the weekly timeframe , where the EMAs and RSI also confirm a powerful bullish momentum, suggesting strength on a larger scale.
Outlook: Monitoring for Confirmation
Overall, Polycab is in a clear and powerful bullish trend. A common post-breakout behavior could involve the stock retesting the previous resistance level as new support .
The price action in the coming days will be crucial to watch. A successful retest would confirm the breakout's strength and suggest a continuation of the upward trend. Therefore, observing this near-term price action is vital before making any further decisions.
Nifty weekly expiry analysis for 23/09/2025.Nifty has created 3 consecutive red candle on the daily charts and might touch its 20 EMA.
Market is around the All time high levels and chances of profit booking are there.
Today, nifty has closed 125 points lower than the pervious close.
Major Resistance levels :- 25311, 25438
Support levels :- 25094, 25010
On the hourly charts, the market seems to be taking rejection from the hourly 20 ema and it trading between 20 and 50 EMA.
It is trading in a close parallel channel range. If it remains in the range avoid trading or scalp as per the risk appetite.
Though nifty has taking down the 50 EMA and there are chance of it tested the higher moving averages soon.
Tomorrow is nifty weekly expiry. Wait and watch for the price action near the price levels before entering a trade.

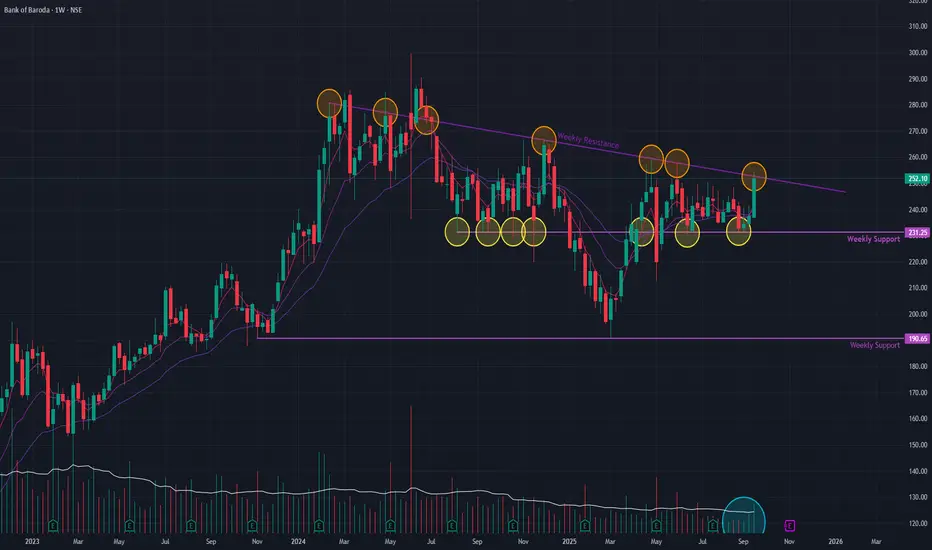
Bank of Baroda (Weekly) - Potential BreakoutBank of Baroda (BoB) is showing renewed strength as it challenges a key resistance level. The stock, which has been in a consolidation phase since its All-Time High in June 2024, made a significant upward move this week with a +6.15% price surge , backed by exceptionally high volume.
This powerful move brings the stock directly to a critical angular resistance trendline . This trendline has previously rejected several breakout attempts, establishing it as a major hurdle.
Bullish Indicators Signal Growing Strength 👍
The recent price action is supported by several positive technical signals:
- Volume Surge: The sharp price increase was accompanied by massive trading volume , indicating strong conviction from buyers.
- Momentum Confirmation: Both the short-term Exponential Moving Averages (EMAs) and the Relative Strength Index (RSI) have shifted into a positive crossover , confirming that bullish momentum is building.
Outlook: A Decisive Week Ahead
The stock is now at a critical juncture. The price action in the upcoming week will be crucial in determining whether this renewed momentum is strong enough to finally break through the persistent resistance. A successful breakout could signal the end of the consolidation phase, while another rejection could extend the sideways trend.
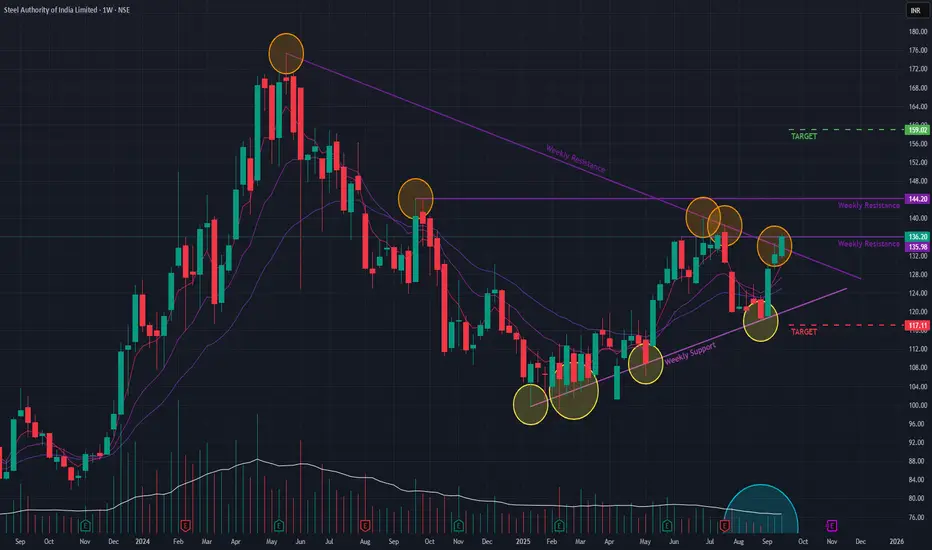
SAIL (Weekly) - Can it SAIL past the resistances ?SAIL is showing signs of a potential turnaround after a prolonged downtrend that began in May 2024. This week, the stock executed a significant breakout from a long-term angular resistance trendline , a move accompanied by a healthy increase in volume and a price surge of +2.98% .
This bullish development follows a period of consolidation that began after the downtrend reversed in January 2025. The stock is now testing a key short-term resistance level.
Bullish Indicators to Note 👍
The positive outlook is supported by the following technical signals:
- Breakout Confirmation: The move through the long-term trendline was validated by a notable increase in trading volume , indicating strong buyer participation.
- Momentum: Short-term Exponential Moving Averages (EMAs) are in a positive crossover , signaling building upward momentum.
Immediate Hurdles Ahead 🚧
Despite the positive momentum, a sustained rally depends on the stock's ability to overcome two significant upcoming resistance levels . The price action in the upcoming week will be crucial to watch for confirmation of the breakout's strength.
Future Outlook and Key Levels
- Bullish Case 📈: If the stock successfully breaks through the immediate resistances and the upward momentum continues, the next potential price target is ₹159 .
- Bearish Case 📉: However, if the stock fails to clear these hurdles and momentum wanes, a pullback towards the support level of ₹117 is possible.
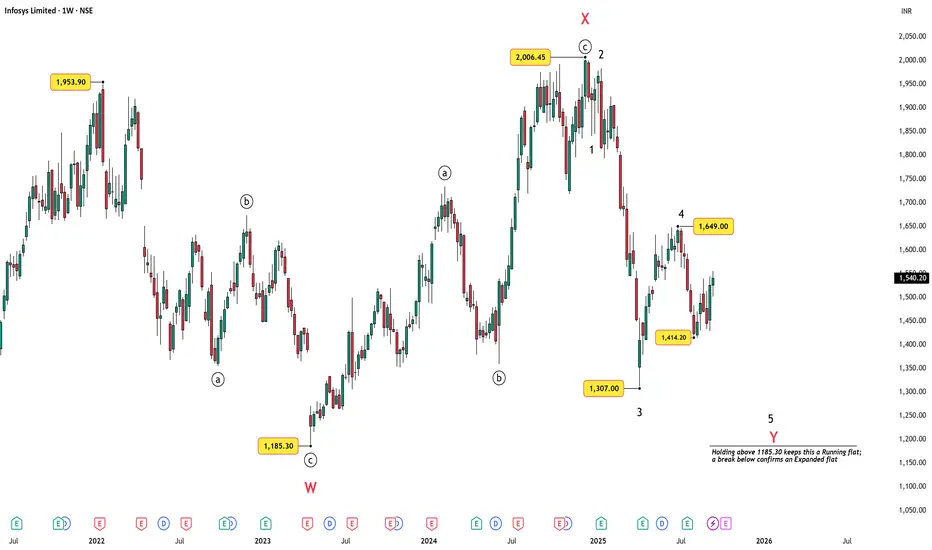
Infosys: Technicals Align with H-1B HeadwindsInfosys (NSE: INFY) has been moving within a larger corrective structure after topping near ₹2006. The weekly Elliott Wave count suggests a possible W–X–Y correction, where the Y-leg may be unfolding as a 3-3-5 flat. With prices currently hovering in the mid-1500s, the bigger picture hints at unfinished business on the downside.
Weekly Chart – The Bigger Picture
The weekly count shows:
Wave W completed near ₹1185,
A strong bounce into Wave X topping at ₹2006,
And now Wave Y in play, potentially forming a flat correction.
Key levels to watch:
₹1307 – the low of Wave 3, which remains the immediate bearish target.
₹1185 – the critical level that decides whether this becomes a Running Flat (if held) or an Expanded Flat (if broken).
In simple terms: holding above ₹1185 keeps this a controlled correction, but breaking below it could mean a deeper and more extended decline.
Fundamental Note – U.S. H-1B Visa Shock
Adding to the technical picture, fundamentals just turned heavy. Infosys ADR fell nearly 4% on Friday-Sep 19, after U.S. President signed an executive order imposing a $100,000 fee on new H-1B visa petitions.
Since North America contributes one-third to two-thirds of Indian IT revenues , this sudden spike in visa costs introduces a policy headwind. While not an existential threat, it raises uncertainty for future growth and could act as a catalyst for the bearish structures already visible on the charts.
News source: in.tradingview.com
Daily Chart – Zoomed In
On the daily timeframe, the larger Wave 4 looks complete near ₹1649. Infosys has since begun its Wave 5 decline. Within this drop, price found a low at ₹1414.20, which likely marks the end of a smaller Wave 3. The current bounce is best viewed as a smaller Wave 4 inside this ongoing Wave 5.
Price is still capped below the SMA100 and SMA200, both acting as strong resistance.
RSI at ~58 shows mid-range momentum, leaving room for the final Wave 5 leg to extend lower.
The key structural invalidation remains ₹1649. Any sustained move above this level would negate the bearish count.
As long as the stock stays under 1649, the expectation is for Wave 5 to resume down, aligning with the weekly flat structure.
Summary & Key Levels
The weekly and daily charts together point to a bearish bias in Infosys. The larger corrective W–X–Y flat is still in play, and the stock has already rolled into Wave 5 down.
Short-term: A smaller Wave 4 bounce is underway, but unless price clears ₹1649, the expectation is for a continuation lower.
Medium-term: A retest of ₹1414.20 is likely, with scope for an extension toward ₹1307.
Long-term pivot: Holding above ₹1185 keeps the structure a Running Flat; a break below it would confirm an Expanded Flat.
In short: 1649 is the bearish invalidation, 1414.20 is the immediate watch level, and 1185 is the big-picture decider.
Disclaimer: This analysis is for educational purposes only and does not constitute investment advice. Please do your own research (DYOR) before making any trading decisions.
Mazdock Long - Technical AnalysisMAZDOCK Technical Analysis Summary
Current Price : 2,985.00
Technical Reasons to Pick MAZDOCK
1 - Dow Theory Confirmation
- Higher Highs (HH) - Higher Lows (HL)
- Clear uptrend structure maintained
2 - EMA Support Structure - Took support from 100 EMA on a weekly Timeframe
- Trading above sorted EMA 100/200
- Strong momentum indication
- Bullish reversal from key moving average
4 - A clear Hidden RSI Divergence
- Indicates continuation of uptrend
- Target 1 : 3,240.00
- Target 2 : 3,502.30
- Target 3 : 3,774.00
- Grand Target : 4,094.00
Risk Management
Watch for sustained break below 100 EMA for trend reversal
Overall Bias : BULLISH
Strategy : Buy on dips near EMA support levels.

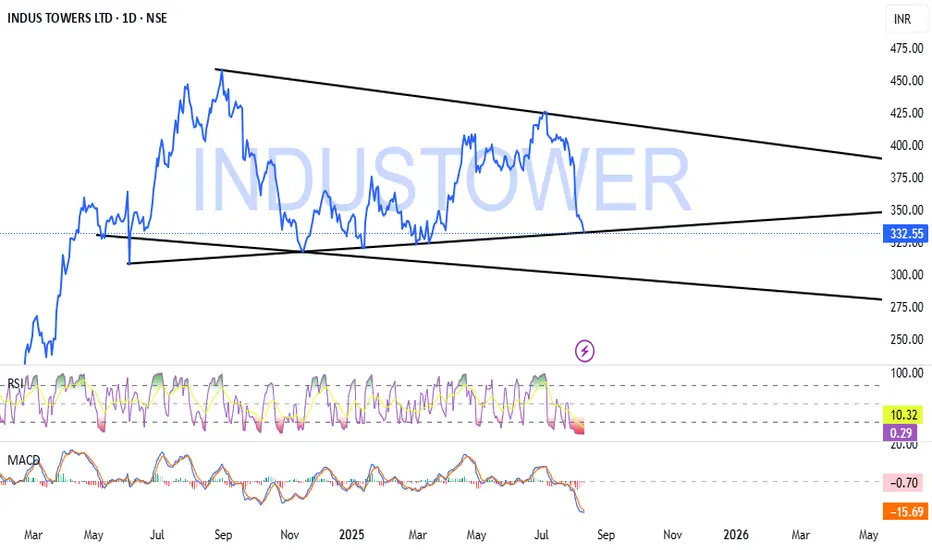
IndusTower Long - Forming Pattern & Entering into consolidationIndusTower - After the decent Breakout Forming Pattern & Entering into consolidation. Its Best buy at Bottom with Stoploss.
Righttime to enter before Breakout.
Do your own analysis before Entering into any trade. NSE:INDUSTOWER
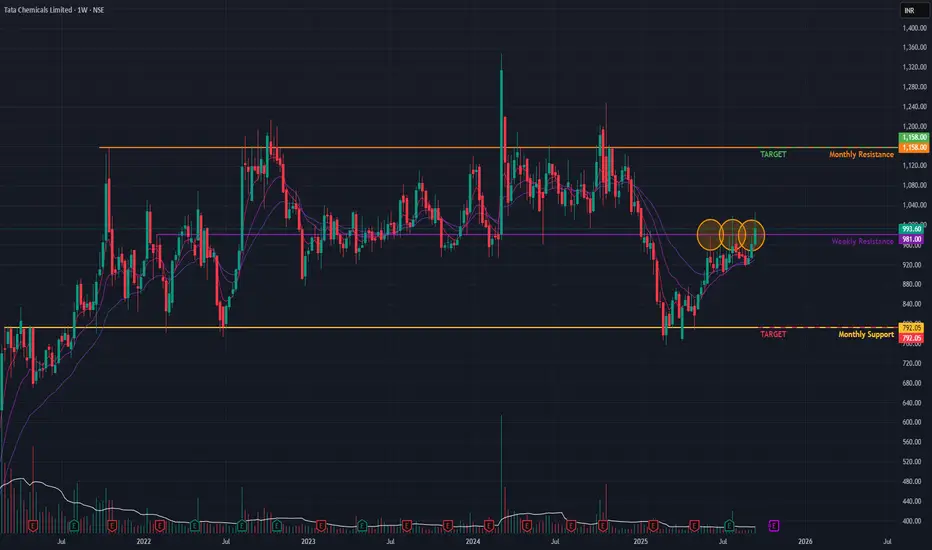
TATA Chemicals (Weekly) - Can it Breakout ??TATA Chemicals has been in a prolonged period of consolidation , trading within a well-defined range since August 2021. The stock has made several attempts to break out of this zone but has so far been unsuccessful.
The Key Battleground: A Major Resistance Level 🚧
The primary hurdle for the stock is a long-term horizontal resistance line that has been in effect since January 2022. This level has been repeatedly tested, and each breakout attempt has failed, confirming it as a significant barrier.
Conflicting Technical Signals 📊
The technical indicators across different timeframes present a mixed picture:
- Weekly Chart: Short-term Exponential Moving Averages (EMAs) are in a positive crossover state , suggesting building upward momentum. However, a confirming SMA Golden Crossover has not yet occurred.
- Monthly Chart: On the higher timeframe, a long-term SMA Golden Crossover remains active , providing a bullish backdrop for the bigger picture.
Future Outlook and Potential Scenarios
- Bullish Case 📈 : A decisive breakout above the resistance zone , supported by high volume, would be a strong bullish signal. If this upward momentum is sustained, the stock could rally towards the ₹1,158 level.
- Bearish Case 📉: If the stock fails to breach the resistance again, it is likely to fall back towards the lower end of its trading range, with a potential downside target near the ₹792 support level.
Let's watchout for next week's price-action
Heritage Foods (Daily) - Will the Bullish momentum continue ?Heritage Foods executed a powerful bullish move today, surging by +8.08% on the back of exceptionally high trading volume. The stock successfully breached two critical resistance levels, signaling a potential shift in trend.
The most significant of these was the breakout from a long-term horizontal resistance trendline , a barrier that has been in place for a considerable period. Additionally, it cleared a more recent short-term horizontal resistance .
Confirmation Signals 👍
The bullish outlook is supported by key technical indicators:
- Massive Volume: The breakout was accompanied by a huge surge in trading volume , indicating strong conviction from buyers and validating the move.
- Positive Momentum: Short-term Exponential Moving Averages (EMAs) are in a positive crossover state , which further confirms the building upward momentum.
Future Outlook and Scenarios
- Upside Potential 📈: If the breakout is sustained and the bullish momentum continues, the stock could be headed towards the next price target of ₹593 .
- Downside Risk 📉: Conversely, if the breakout fails to hold and the momentum reverses, the stock may pull back to find support near the ₹457 level.
Keep an eye on the price-action !!

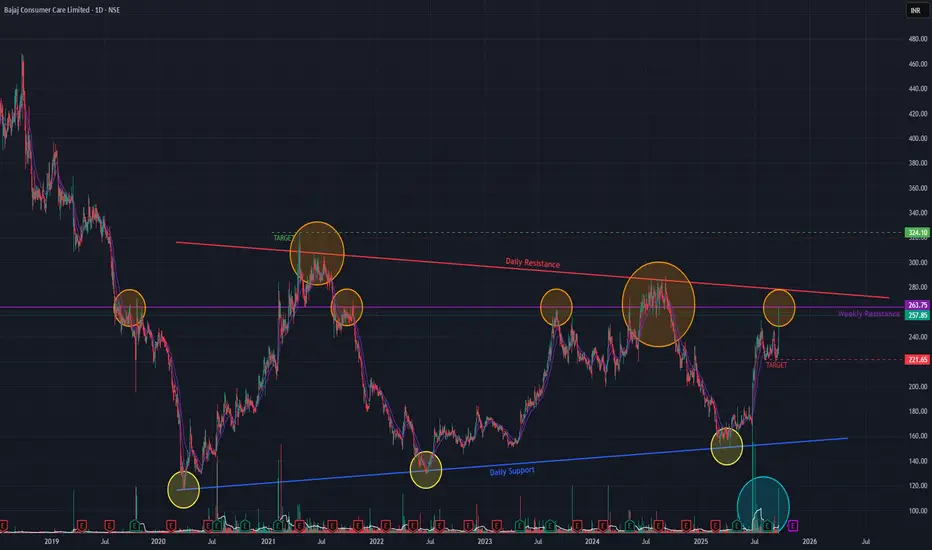
Bajaj Consumer (Daily) - Potential BreakoutBajaj Consumer Care is at a critical juncture following a prolonged downtrend from its January 2018 all-time high and a subsequent sideways consolidation period since March 2020. The stock recently demonstrated significant buying interest with an 8.59% surge on a high-volume spike.
Bullish Indicators 👍
Several technical signals support a positive outlook:
- Momentum: Short-term Exponential Moving Averages (EMAs) are in a positive crossover state, indicating strong upward momentum.
- Volume: Trading volume has been consistently above average for several months, suggesting sustained accumulation by buyers.
- Long-Term Trend: The weekly timeframe now shows a Simple Moving Average (SMA) Golden Crossover, reinforcing the potential for a long-term trend reversal.
Key Resistance Levels 🚧
Despite the bullish signals, the stock faces two significant hurdles:
1. A major horizontal resistance line that has been in place since January 2013.
2. A more recent descending resistance trendline formed since April 2021.
Future Outlook and Scenarios
- Bullish Case 📈: A decisive breakout above both the horizontal and angular resistance levels would be a strong confirmation of bullish momentum. This could propel the stock towards a potential price target of ₹324.
- Bearish Case 📉: If the stock fails to sustain its upward momentum and break these key resistance levels, it may retrace back towards the ₹221 support level.
Keep monitoring !!
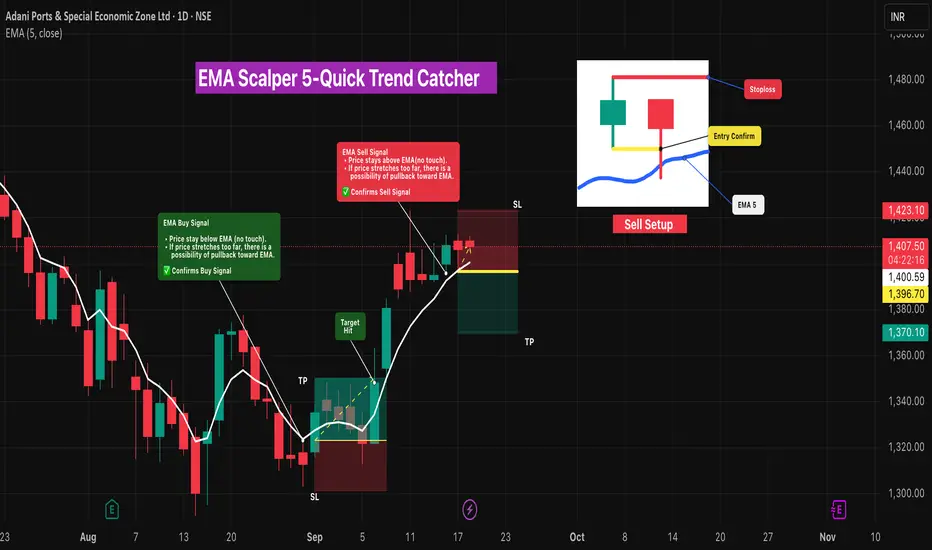
EMA Scalper 5-Quick Trend Catcher🔎 Intro / Overview
This idea uses a single EMA (Length 5) as a trend confirmation tool.
- When price stays below EMA (no touch), it signals bullish continuation.
- When price stays above EMA (no touch), it signals bearish continuation.
If price stretches too far from EMA, expect a possible pullback toward the line.
This EMA Scalping Strategy focuses on quick entries and exits 🎯.
- Best suited for intraday scalping where small, quick moves are captured. ⚡
___________________________________________________________
📌 How to Use
- In a downtrend , when price stays far below EMA(5) with no touch, then the next candle breaks the previous high → immediate Buy entry .
- In an uptrend , when price stays far above EMA(5) with no touch, then the next candle breaks the previous low → immediate Sell entry .
- EMA acts as a fast trend filter, confirming momentum while defining risk–reward levels.
- Once the signal is confirmed, entry is validated only if the next candle breaks the price level — otherwise, the signal is devalidated.
___________________________________________________________
🎯 Trading Plan
- Entry → When the next candle breaks the previous candle’s high , enter long (for immediate Buy).
- Stoploss → Swing Low for Buy / Swing High for Sell.
- Target → 1R (equal to stop distance).
___________________________________________________________
📊 Chart Explanation
ADANIPORTS
1️⃣ Buy Signal →
- Entry @ 1323.15
- Stoploss @ 1301.40
- Target @ 1345.70 → 🎯 Target Hit
2️⃣ Sell Signal →
- Entry @ 1396.70
- Stoploss @ 1423.10
- Target @ 1470.10
Trade continue in live
___________________________________________________________
👀 Observation
- EMA(5) gives fast and responsive trend signals.
- Works best in strong trending markets.
- False signals may occur in choppy sideways markets — use structure confirmation.
___________________________________________________________
❗ Why It Matters?
- Provides clear Buy/Sell confirmation with less lag.
- Defines structured entry, SL, and TP rules.
- Simple, rule-based system to avoid emotional trading.
___________________________________________________________
🎯 Conclusion
The EMA(5) Signal Strategy is a simple yet effective way to confirm trend and capture moves.
By combining breakout entries with disciplined SL/TP, traders can maintain risk–reward balance and trail winners effectively.
🔥 Patterns don’t predict. Rules protect. 🚀
___________________________________________________________
⚠️ Disclaimer
📘 For educational purposes only.
🙅 Not SEBI registered.
❌ Not a buy/sell recommendation.
🧠 Purely a learning resource.
📊 Not Financial Advice.
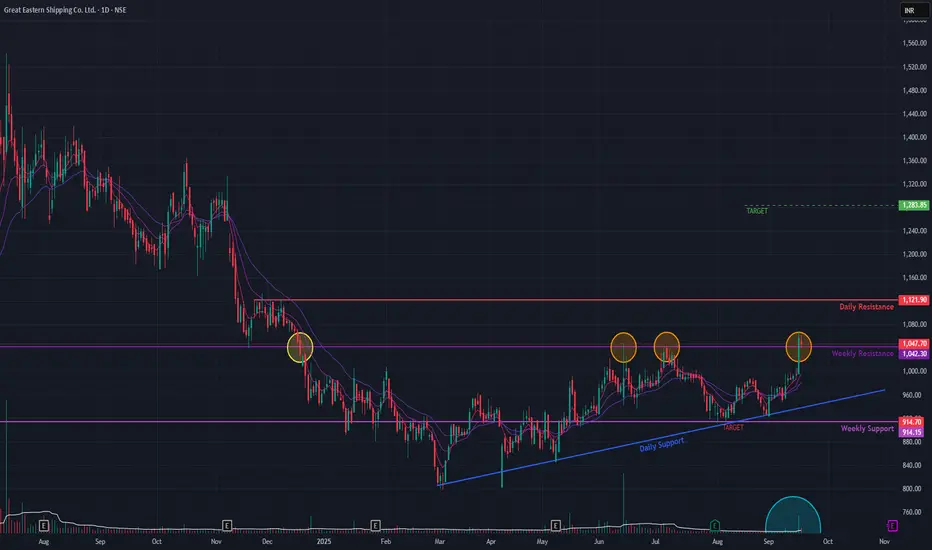
GE Shipping (Daily Timeframe) - Potential Breakout ??GE Shipping has broken out from a critical, long-term resistance level originating from December 2023. The stock is showing strong bullish momentum, confirmed by multiple technical signals.
Key Observations:
Pattern: A double-bottom in April 2025 ended the prior downtrend, leading to a period of consolidation.
Breakout: On Sep 16, 2025, the stock decisively broke above the resistance on high volume.
Confirmation: The breakout was confirmed on Sep 17, as the old resistance successfully held as new support.
Indicators: Bullish EMA crossovers and sustained above-average volume support the move.
Price Outlook :
Upside Target: ₹1283 if the price remains above the breakout level.
Downside Risk: A failure to hold this new support could lead to a decline towards the ₹914 level.