Kotak Swing Idea (Long)Kotak might move upside due to following logical reason:
1) Inside/doji candle on daily candle (trend reverse)
2)Trading above 20 EMA in 1 hr to 4 hr chart (Support)
3)GAP cover pending
4)Swing Low formation is shifting up
5)Consolidation from last 1.5 months
(Note: Author not responsible for anyone profits or loss, nor a sebi registered RA. Please do your own due diligence before taking any trades. For educational purpose only)
Moving Averages

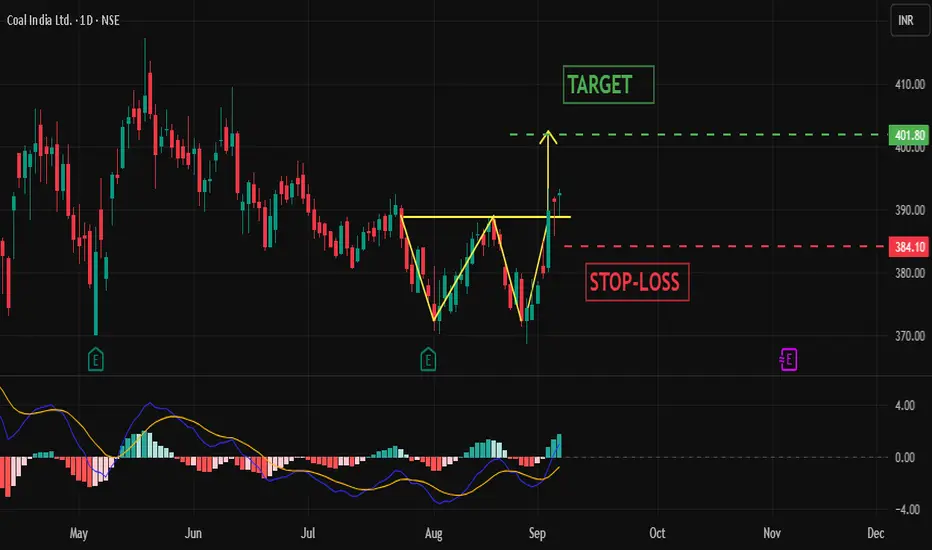
COALINDIA – Double Bottom Breakout with MACD Strength!📊 Pattern & Explanation
COALINDIA has formed a double bottom pattern, which looks like a “W” on the chart. This occurs when price tests the same support level twice and holds strongly. It signals that buyers are defending that zone. Once the neckline (resistance above the bottoms) is crossed with momentum, it often leads to a strong upward move.
📈 Key Levels
Target: 402 – calculated from the breakout projection.
Stoploss: 384 – to limit downside risk.
📊 MACD Crossover
The MACD (Moving Average Convergence Divergence) is a momentum indicator. A positive crossover happens when the MACD line moves above the signal line, showing fresh buying strength and supporting the bullish breakout setup in COALINDIA.
💡 Why This Setup Matters
This setup combines price action (double bottom breakout) with momentum confirmation (positive MACD crossover). When support holds twice and momentum shifts upward, the chances of a sustained rally improve. Traders can use this confluence to trade with higher confidence, while managing risk with a clear target and stoploss.
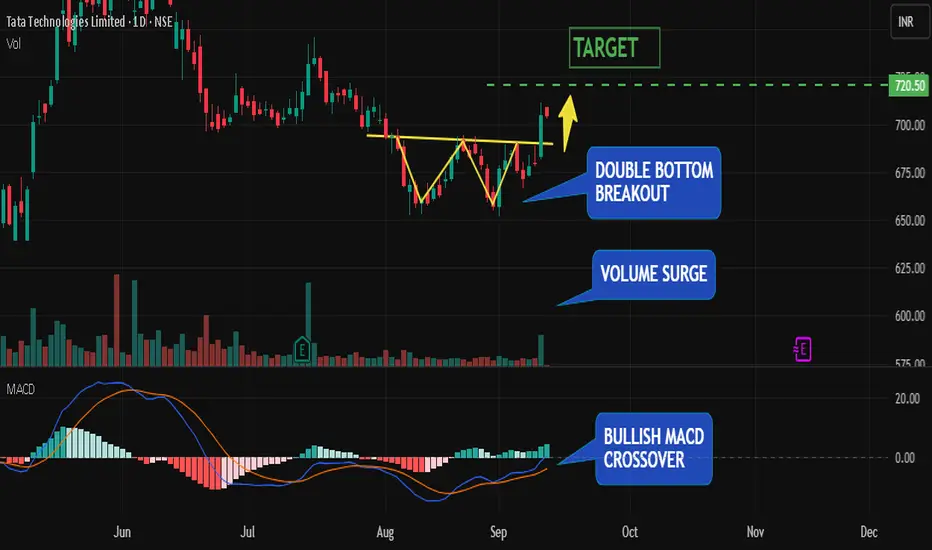
Tata Technologies Double-Bottom Breakout | Target ₹720The stock has recently completed a double-bottom reversal pattern . A double bottom is one of the most reliable bullish reversal setups, often described as a “W-shaped” formation. It occurs when price tests the same support level twice, with sellers unable to push lower both times. This repeated defense by buyers signals demand at those levels and exhaustion of selling pressure.
Once price broke above the neckline (the midpoint of the “W”), the pattern was confirmed, suggesting that buyers are regaining control and an uptrend may be unfolding.
But what makes this breakout even stronger is the confluence of technical signals:
Bullish MACD Crossover : The MACD line has crossed above the signal line, shifting momentum to the upside. This indicates that bullish momentum is not only present but accelerating.
Volume Surge : Breakouts accompanied by rising volume are considered stronger and more reliable. In this case, the surge in volume confirms that institutions and larger players are participating in the move, adding credibility to the breakout.
Together, these signals create a powerful alignment of pattern, momentum, and participation.
Trade Plan :
Entry : On breakout above neckline or on a healthy retest of the neckline as support.
Target : ₹720, calculated as the measured move objective from the double bottom formation.
Risk Management : Always size positions carefully. Risking only 1–2% of capital per trade ensures you can survive a string of losses and stay in the game long-term.
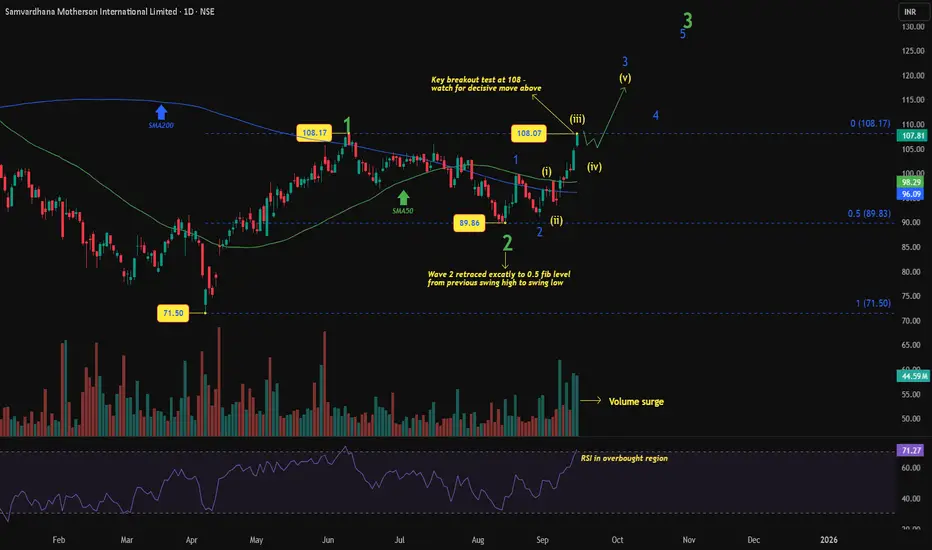
Samvardhana Motherson: Breakout or Double Top?Samvardhana Motherson has been carving a clean Elliott Wave structure since bottoming at ₹71.50.
Wave count : Wave 1 peaked at 108.17, followed by a textbook Wave 2 retracement to ₹89.86 (near the 0.5 Fib).
Current leg : Price has surged from Wave (ii) into 108, likely completing Wave (iii) of 3. A short Wave (iv) pullback would be natural before an eventual breakout in Wave (v) of 3.
Momentum factors : Strong volume surge supports the impulsive setup, while RSI in the overbought region suggests cooling off in the near term.
Moving averages : Price is now above both SMA50 and SMA200, the trend bias has turned positive, and moving averages may act as support on any pullback.
Summary : 108 is the make-or-break level. A brief consolidation is possible, but a sustained breakout above this zone in Wave (v) would confirm the Wave 3 extension.
Disclaimer: This analysis is for educational purposes only and does not constitute investment advice. Please do your own research (DYOR) before making any trading decisions.
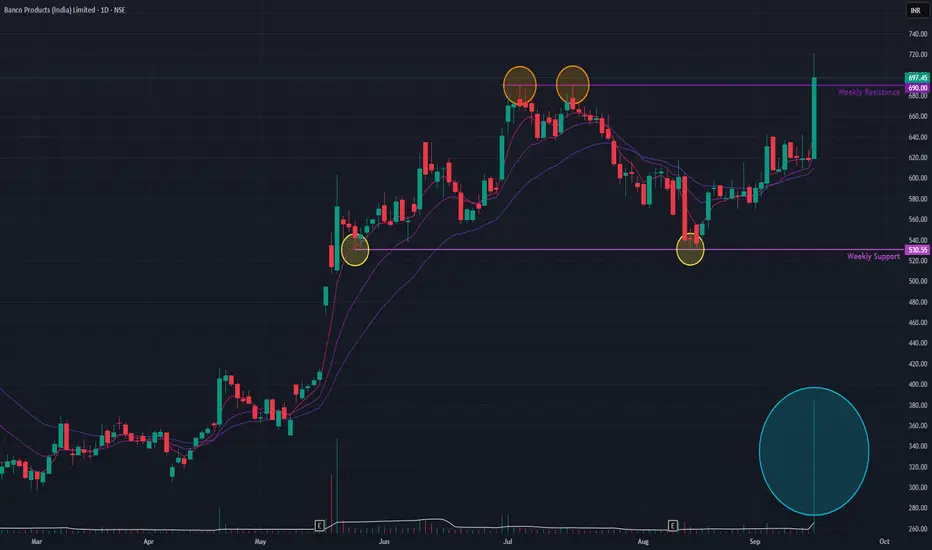
Banco India (Daily Timeframe) - Potential ATH ??Banco India remains in a dominant long-term uptrend that started in June 2020. After a brief corrective downtrend from November 2024 to April 2025, the stock entered a sideways consolidation phase.
Today, the stock decisively broke out of this consolidation range with a surge of +12.84% on significant volume , signaling strong buyer commitment & a new All Time High (ATH) . This bullish move is further supported by short-term Exponential Moving Averages (EMAs), which are in a positive crossover state.
If this upward momentum is sustained, the next potential price target is the ₹850 level. Conversely, a failure to hold the breakout could see the price retrace to support near the ₹530 level.
Price-action is what matters !!
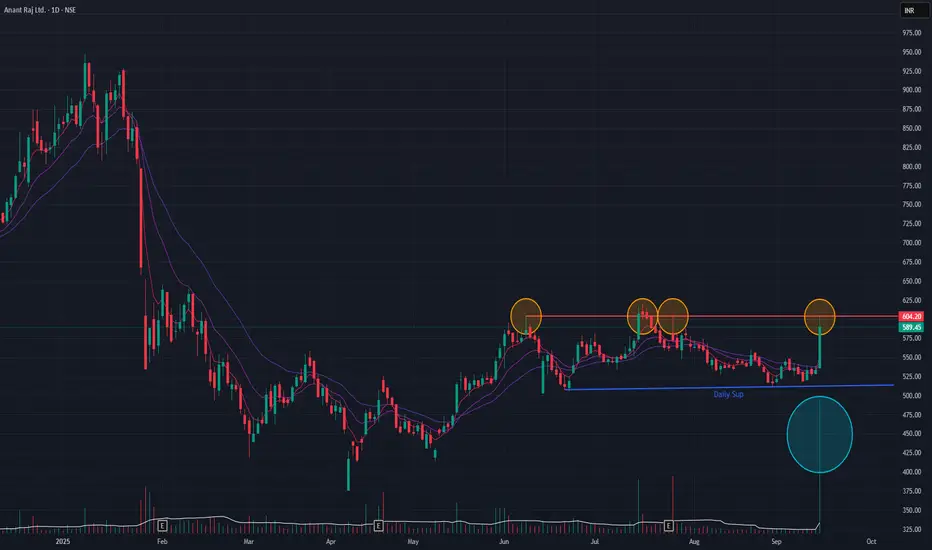
Anant Raj (Daily Timeframe) - Potential BreakOut candidate ??Following a downtrend that began in January 2025, Anant Raj has been in a sideways consolidation phase since May 2025. After several failed breakout attempts from this range, the stock demonstrated significant buying interest today, surging +10.53% on substantial volume.
While this move is positive, a cautious approach is recommended as the short-term Exponential Moving Averages (EMAs) have not yet registered a bullish positive crossover. The price action in the coming sessions will be critical for confirmation.
A sustained breakout above the consolidation channel could pave the way for further upside, with a potential short-term target of ₹667.
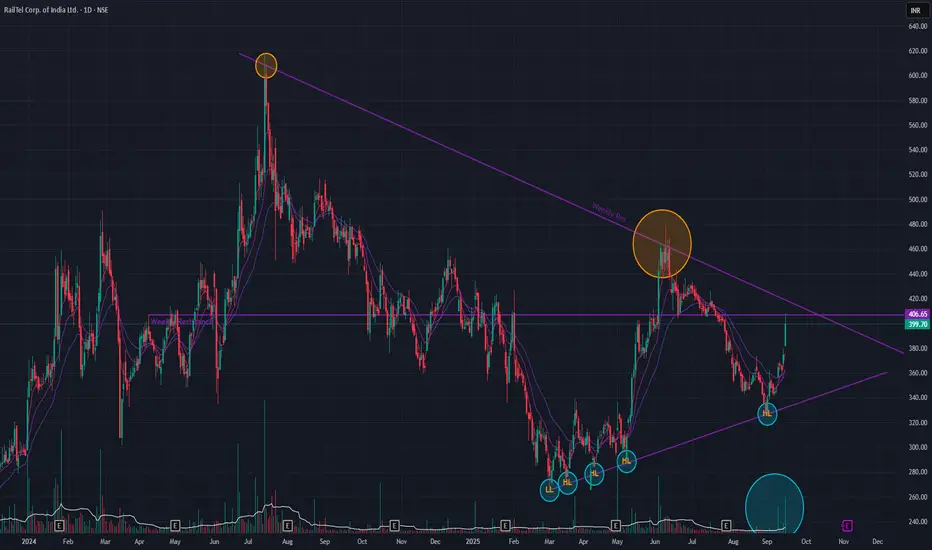
Railtel (Weekly Timeframes) - Is the trend reversing?After a sustained downtrend since July 2024, Railtel is showing signs of a potential trend reversal , evidenced by the formation of higher lows since March 2025.
Today, the stock exhibited significant bullish momentum, opening with a gap-up and closing with a 6.70% gain on substantial volume . This move is supported by short-term Exponential Moving Averages (EMAs) which are in a bullish positive crossover state.
The price is now at a critical juncture, testing a long-term horizontal resistance line. A decisive breakout above this level is essential for further upside. If successful, the next major obstacle will be the descending trendline that rejected a breakout attempt in June.
Keep a watch on this one !!
Bitcoin Market Update – September 15, 2025🔴 Bitcoin Market Update – September 15, 2025
📈 The main trend is still UP
💹 Last week, Bitcoin closed the trading session around 115k2 and is currently hovering near 115k4. The weekly (W) candle of Bitcoin is showing quite a good signal, closing as a green candle with a short wick.
📊 Volume is at an average level, but this gives the market a positive outlook as the price just successfully retested the 20 EMA. Most of this volume comes from traditional inflows via BTC ETFs (as I analyzed in last week’s LIVE session).
📰 News: This week, the Federal Reserve Interest Rate decision is an important event, scheduled at 1 AM on Thursday.
⚡ Short-term strategy:
✅ The current market condition is favorable for altcoins.
✅ Focus on trading altcoins.
✅ Only do scalping trades and prioritize LONG (BUY) positions.
⚠️ Current disadvantage for Bitcoin:
🔻 MACD has shown a bearish divergence at the top.
🔻 The current price zone may form a consolidation range on the W timeframe (Gray box zone).
🛡️ Nearest support: 108k
🚀 Nearest resistance: 123k
🍀 Wishing everyone an efficient trading week ahead!

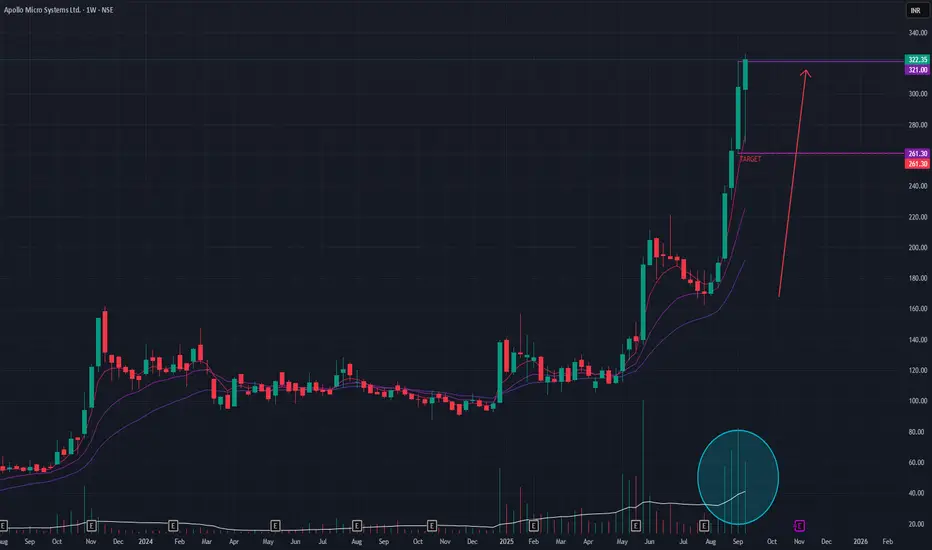
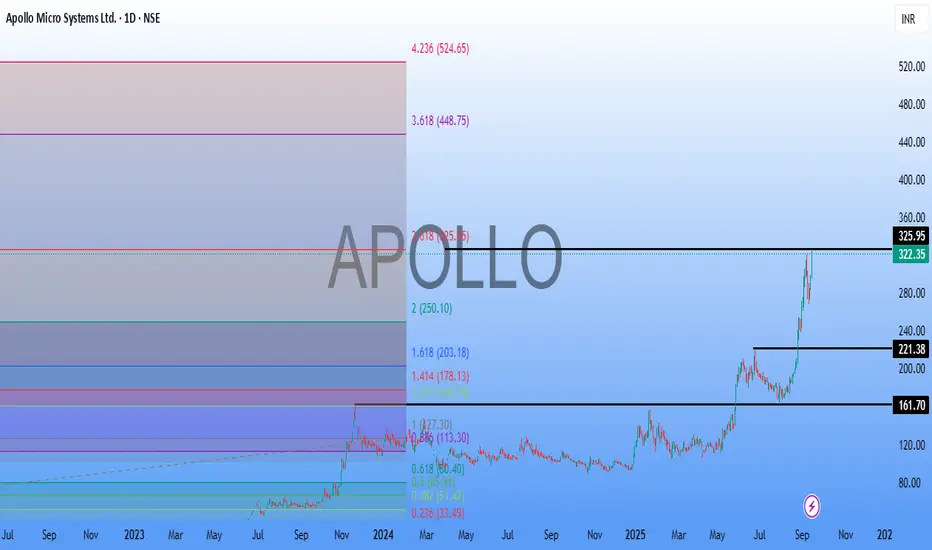
Apollo Micro Systems (Weekly Timeframe) - Momentum to continue ?Apollo Micro Systems has been in a steep, aggressive uptrend since August 2025, delivering a remarkable +92% return in a short period. The stock is exhibiting classic signs of strong bullish momentum, but the velocity of the rise warrants a closer look at its sustainability.
## Bullish Momentum Indicators 📈
Exceptional Volume: The rally has been supported by extraordinary trading volume for the past four to five weeks, indicating significant and sustained buying interest.
Technical Strength: The short-term Exponential Moving Averages (EMAs) are in a Positive Crossover (PCO) state, confirming the powerful upward momentum.
Buyer Conviction: The recently formed weekly candle indicates strong demand and suggests that buyers remain in control of the trend.
## Outlook and Key Levels
While the trend is undeniably strong, the rapid ascent raises the possibility of near-term profit-booking. Such a pullback could be a healthy correction, potentially offering more favorable entry points for those who missed the initial move.
Upside Potential: If the current momentum continues, the stock could surge towards the next logical target of ₹376.
Downside Risk: A correction or loss of momentum could see the stock pull back to test the support level around ₹261.
In summary, while the underlying trend remains powerful, traders should be mindful of the potential for increased volatility after such a sharp and rapid advance.
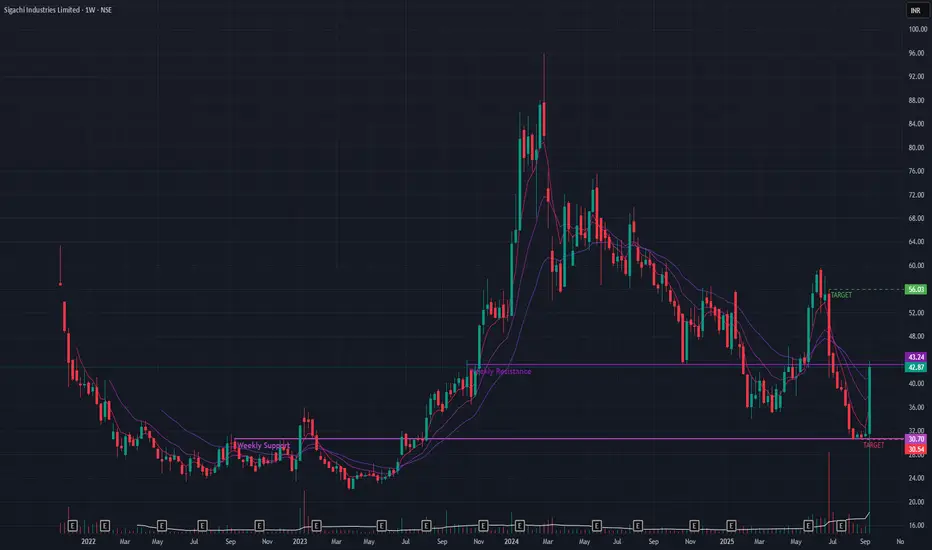
Sigachi Ind (Weekly Timeframe) - Is this the trend reversal?After a period of decline following its February 2024 peak, Sigachi Industries has shown a dramatic burst of momentum. However, the stock has now reached a critical juncture, and confirmation is required to suggest a sustainable trend reversal.
## Recent Price Action
A massive +36.27% rally last week, backed by exceptionally high volume , has put the stock back on the radar. This surge has pushed the price directly against a significant long-term resistance trendline . A breakout above this level would be a major technical victory for the bulls.
## Cautionary Signals to Consider
Despite the powerful rally, several indicators suggest a "wait-and-see" approach:
Trend Confirmation: The stock has not yet formed a higher low , a key technical signal required to confirm a reversal from a downtrend to an uptrend.
EMA Posture: The short-term Exponential Moving Averages (EMAs) have not yet achieved a Positive Crossover (PCO) . This indicates that the recent surge, while strong, has not yet been sustained long enough to reverse the short-term trend momentum.
## Key Levels and Outlook
The stock is at a clear decision point.
Bullish Scenario: A decisive breakout above the current resistance trendline, again on high volume , would be a strong bullish signal. If this occurs, the next potential upside target is the ₹56 level.
Bearish Scenario: If the stock fails to breach this resistance and the momentum fades, it could fall back to test support near the ₹30 level.
Wait for further price-action !!
bbtc bearishi think can go to below 1000 , already below 200 dma
Disclaimer- Just my view and opinion trade at your own risk not an investment advice these are only for educational purposes

ApolloMicro SystemsApollo Micro Systems (AMS) is an Indian defense and aerospace electronics company poised for growth due to strong order books and expansion plans.
Apart from the Fundamentals, from Technical Point of view based on previous high breakout, stock has reached the Fibo Extension of 325.95. and its the Major Resistance.
Its a buy on dip candidate for a short to long term Investment stock,
with next target of 448.75 / 524.65.
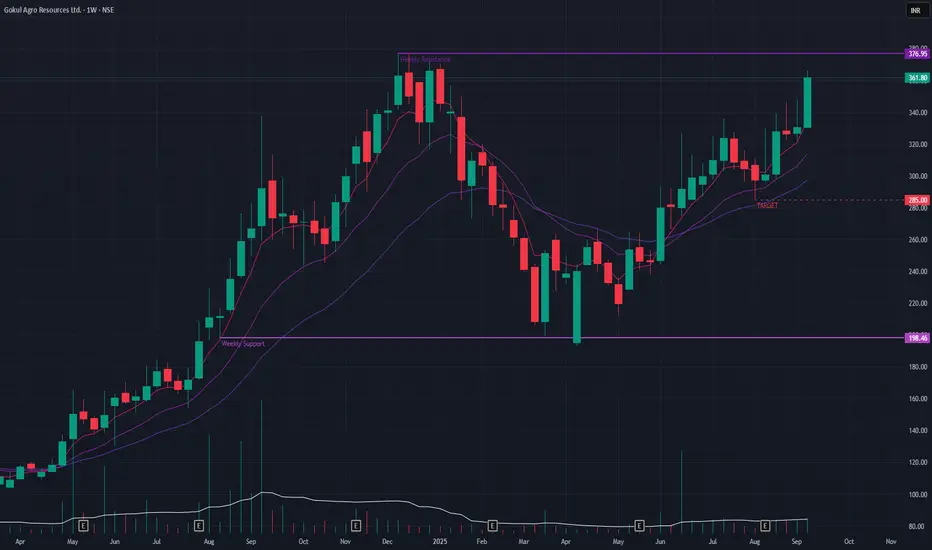
Gokul Agro (Weekly Timeframe) - Can it BreakOut & new ATH ?Gokul Agro has undergone a significant trend reversal, shifting from a downtrend that began in December 2024 to a renewed uptrend since April 2025. This recovery has brought the stock within striking distance of its all-time high (ATH).
Recent price action has been particularly strong, highlighted by a +9.39% gain last week, which was supported by healthy trading volumes, indicating strong buyer conviction. Further technical confirmation comes from the short-term EMAs, which are stacked in a bullish formation, signaling strong upward momentum.
A sustained push through the current resistance could propel the stock to a new ATH. Beyond that, the next projected technical target is the ₹490 level. Conversely, a failure to break out could see the price pull back to the primary support zone around ₹285 .
Monitor the price-action !!
Bajaj Finserv – Double Bottom Breakout Hits 2082!Bajaj Finserv recently broke out of a double bottom pattern , confirming strong bullish momentum. After the breakout, price action swiftly reached the target of 2082 , validating the pattern’s strength.
Adding to the bullish sentiment, the stock also achieved a breakout above 50D SMA and 100D SMA , showing renewed medium-term momentum and strong follow-through buying.
This breakout above critical levels suggests that the trend is gaining strength. Sustaining above these moving averages could attract further momentum traders and long-term investors.
📊 Key Highlights:
Breakout from double bottom pattern ✅
Target of 2082 achieved 🎯
50D SMA & 100D SMA breakout 🔑

Mazagon Dock – Breakout Victory: Target Achieved at 2925!Mazagon Dock recently delivered a strong breakout from a descending wedge pattern , signaling a shift in momentum. After the breakout, price action surged and successfully reached the target of 2925 .
Interestingly, the stock also took a reversal from the 200D SMA , which acted as a major resistance zone . This confluence of technical factors highlights the importance of moving averages in identifying key turning points.
Currently, traders should watch how the price reacts around this zone. A sustained move above 200D SMA may open the doors for further upside, while rejection could trigger some healthy consolidation.
📊 Key Takeaways:
Breakout from descending wedge pattern ✅
Target of 2925 achieved 🎯
200D SMA acted as resistance 🔑

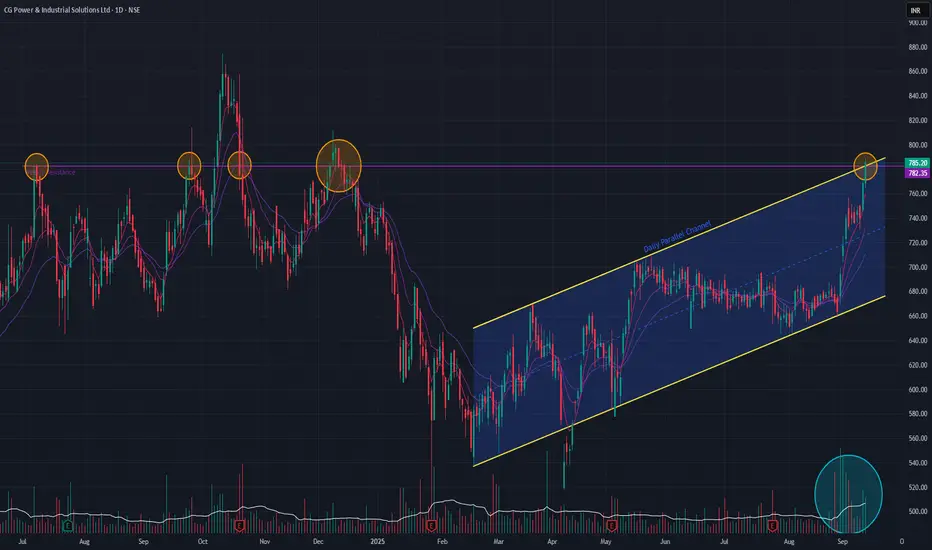
CG Power (Daily Timeframe) - Potential BreakOut CG Power has been consolidating below a major horizontal resistance line established in July 2024, which has so far prevented new all-time highs. Following a downtrend that began in October 2024, the stock has been trading within a well-defined parallel channel.
Today's price action is particularly bullish, as the stock is attempting a breakout from a confluence of resistance: the top of the parallel channel and the long-term horizontal trendline.
This significant move is supported by two key technical indicators:
The short-term EMAs are in a Positive Crossover (PCO) state.
An SMA Golden Cross occurred just a few days ago.
A sustained breakout above this confluence would be a strong signal that the uptrend is resuming.
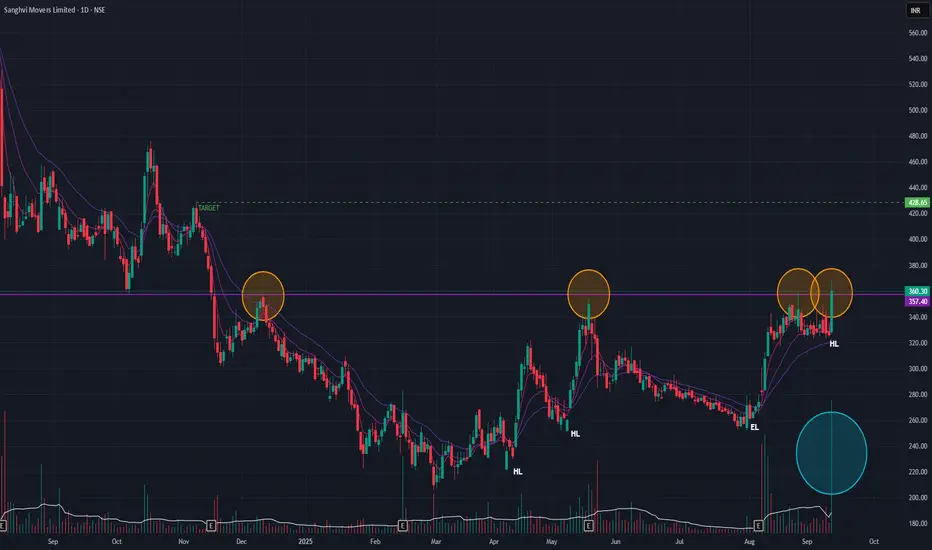
Sanghvi Movers (Daily Timeframe) - Potential BreakOut ??Sanghvi Movers has been in a corrective downtrend since peaking at its all-time high in May 2024. A notable shift in market structure appeared in March 2025, with the stock starting to print a series of higher lows —an early sign of a potential trend reversal.
A significant horizontal resistance, established in August 2023, has capped multiple rally attempts. Today, however, the stock challenged this level with conviction, closing +10.45% higher on massive volume , which suggests strong institutional interest. Bullish sentiment is further reinforced by a recent Simple Moving Average (SMA) Golden Cross.
While we await a confirmatory Positive Crossover (PCO) on the short-term Exponential Moving Averages (EMAs) , a sustained breakout above this resistance could signal the start of a new uptrend. The next logical price target on a successful breakout would be the ₹428 zone.
GreenPly Ind (Daily Timeframe) - Will it BreakOut?Greenply was in a downtrend since Aug 2024 and the trend reversed since Mar 2025. A Long-Term angular resistance that had formed since Aug 2024 has not been breached even after multiple tries. Today the stock made a positive BreakOut with exceptionally huge volume. At the same time, a Long-Term resistance from Dec 2017 is more significant. Short-term EMAs are yet to form PCO state, but we can already see Golden Cross-over since few days.
Will this BreakOut sustain? Let's watchout.

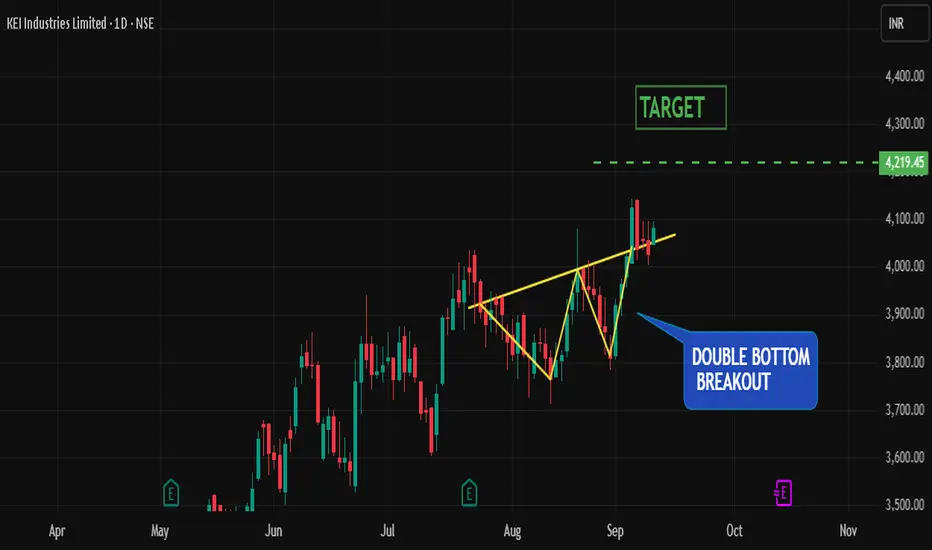
Double-Bottom Breakout → Bulls in Control | Target ₹4219The stock has recently completed a double-bottom reversal pattern . A double bottom forms when price tests the same support level twice and fails to break lower, creating a “W-shaped” structure. This indicates that sellers tried twice to push the stock lower but were unable to, while buyers stepped in to defend the level. Once price breaks above the neckline (the midpoint of the “W”), the pattern is confirmed, often signaling the start of a bullish trend.
Adding further strength to this setup, price is holding firmly above the 50D, 100D, and 200D SMA . Here’s why this matters:
50-Day SMA : Represents short-term trend. Interestingly, the stock has now tested the 50D SMA thrice and held each time , showing strong buyer interest and reinforcing bullish momentum.
100-Day SMA : Reflects medium-term structure; price above this confirms that buyers dominate the broader swing.
200-Day SMA : The long-term benchmark; trading above this signals the stock is firmly in an uptrend.
When price stays above all three moving averages, it shows alignment across short, medium, and long-term trends — a powerful confirmation that bulls are in control.
Trade Plan :
Entry : On breakout above neckline or on a pullback retest of neckline as support.
Target : ₹4219 (measured move objective from the double bottom pattern).
Risk Management : Stick to disciplined sizing; risk no more than 1–2% of trading capital.
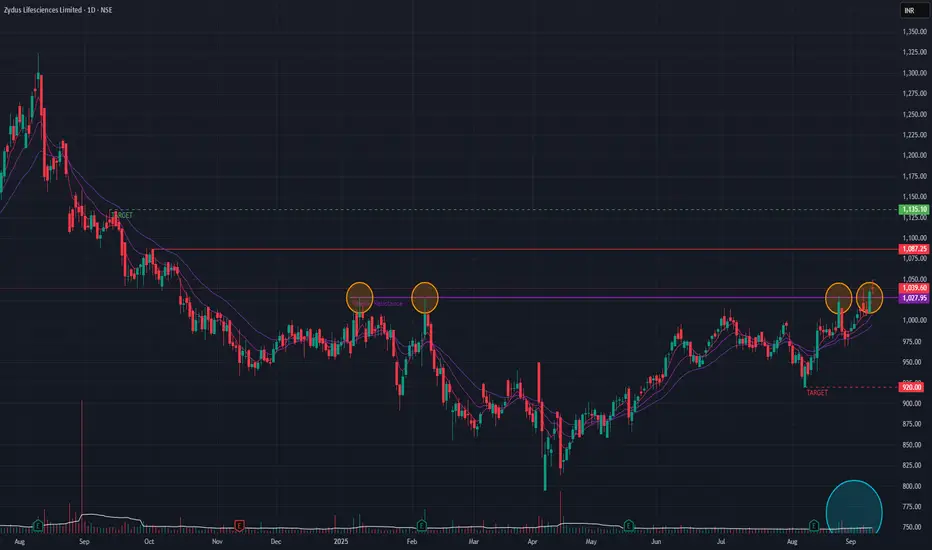
Zydus Life (Daily Timeframe) - Potential BreakOut candidate ??Zydus Lifesciences BrokeOut of a major resistance zone (since Oct 2024) couple of days back and it re-tested the zone again today. The volume is above average though. Short-term EMA's are in PCO state which indicates bullishness.
If the BreakOut sustains then we may see the stock reaching levels of 1135. We may see levels of 920 if the BreakOut does not sustain.
Price-action is to be monitored !!
TVS Holdings (Daily Timeframe) - Can we expect new ATH ??TVSHLTD BrokeOut of a major resistance that formed since Nov 2024. On a daily basis, the stock did retest the trendline and moved up today which is a positive indication. This was accompanied with good volume. In the Weekly timeframe the stock is indicating bullish momentum as well as Short-term EMAs are in PCO state.
On the upside, we may see the stock reaching 14,495 levels if the momentum continues. While on the downside, it may reach 11,667 levels as well if there is a trend reversal.
Keep watching the price-action !!

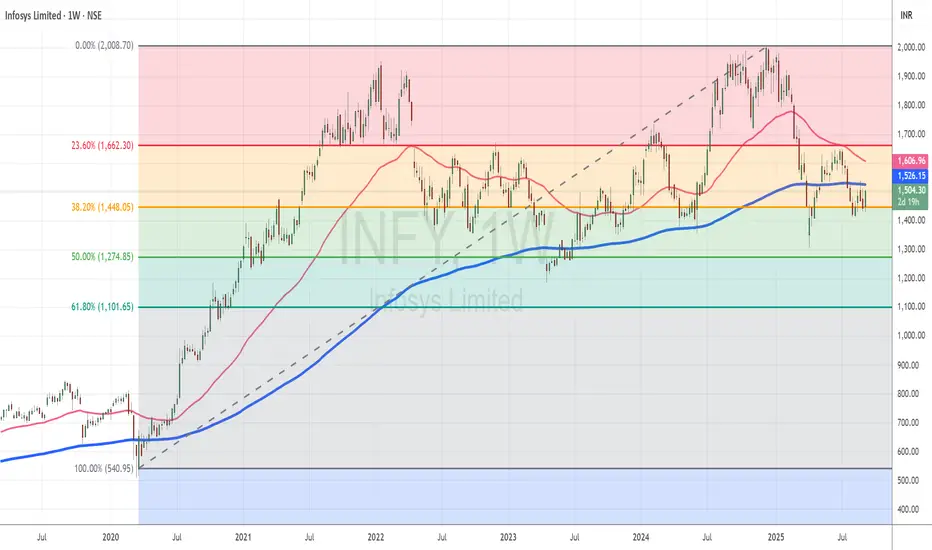
Infy Trades Sideways Since 2022, Offering Support-Driven Entry OTopic Statement:
Infosys has remained stuck in a broad sideways zone since 2022, with strong support levels offering promising long-term accumulation signals.
Key Points:
1. The stock has been range-bound between 1400 and 2000, repeatedly failing to break above the upper resistance
2. It currently stands on the 38.2% Fibonacci retracement level, where it is receiving strong support
3. Price is below the 200-day EMA, making the stock technically oversold and presenting an attractive investment opportunity
Motherson Sumi (Daily Timeframe) - A new ATH ??MSumi has broken out of a major resistance trendline today after couple of earlier attempts as indicated. The volume has been exceptionally high since last week. Today as well the volume was huge indicating buyer interest. Short-term EMAs are in PCO state indicating Bullishness. If the momentum continues, we may see the stock making new ATH. Few major resistances to be breached before it can achieve new ATH.
If the stock is able to sustain the momentum, then we may see 67 levels on the upside & if the trend reverses, we may see 40 levels on the downside.
Keep watching!!
