MRF Breakout Swing CandidateChart Analysis :
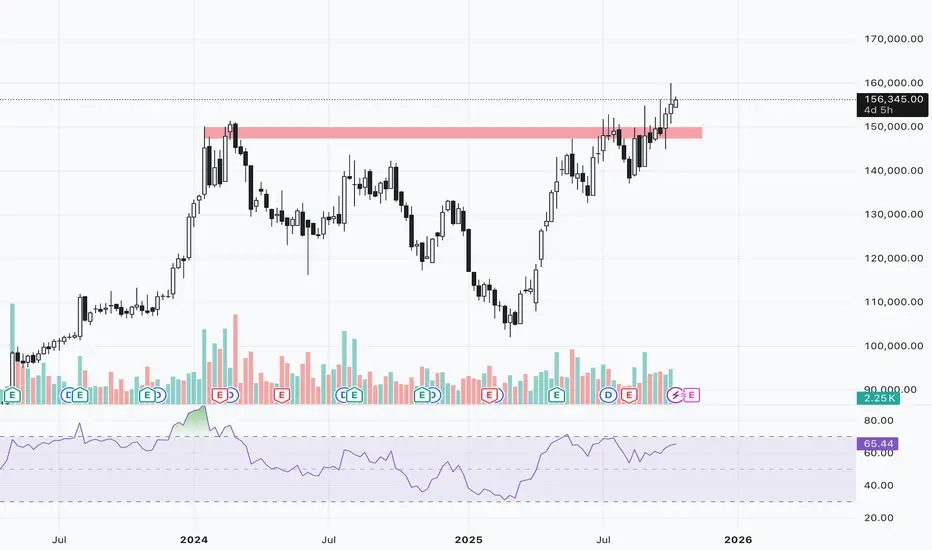
The stock has broken out above the all time high resistance and major psychological level of 150000 and is sustaining above the zone. A long position can be considered around 156500 zone.
Key Levels :
Entry : 156350-156500
Targets : 160000/163170
Stop-Loss : 152500 below day tf close
Disclaimer:
I am not SEBI registered. This analysis is for educational purposes only and not investment advice. Please do your own research before trading or investing.
MRF
MRF - BEARISH SETUP (DAILY TIMEFRAME) DOUBLE TOPA double top pattern is a bearish reversal pattern that can be observed on a stock's price chart after an uptrend. It signals that the upward trend may be losing momentum and that a downtrend could be imminent.
Please sell if your setup agrees too - I will sell if 1,45,000 Levels is broken Your Boost and like will remind me to sell so please keep supporting so that this post reminds me to sell MRF at 1.45K levels

MRF: Inverted Head & Shoulders Breakout |Targets Ahead! MRF has confirmed a breakout from an Inverted Head & Shoulders pattern on the daily chart, signaling a potential bullish trend reversal. The breakout has occurred with strong volumes, adding conviction to the move.
🔍 Trade Setup:
Buy Above: ₹115,579
Stop Loss: ₹111,230 (Closing Basis)
Targets:
🎯 Target 1: ₹118,028
🎯 Target 2: ₹120,443
🎯 Target 3: ₹123,358
🎯 Target 4: ₹126,157
🎯 Target 5: ₹129,019
The pattern structure aligns well with Fibonacci extension levels and previous resistance zones, providing a favorable risk-to-reward ratio.
📌 Chart Highlights:
Breakout above neckline with volume surge
Positive RSI momentum confirming breakout strength
Price sustaining above key moving averages
⚠️ Disclaimer:
I am not a SEBI-registered advisor. This analysis is shared for educational and informational purposes only. Please consult your financial advisor before making any investment or trading decisions. Trade at your own risk.

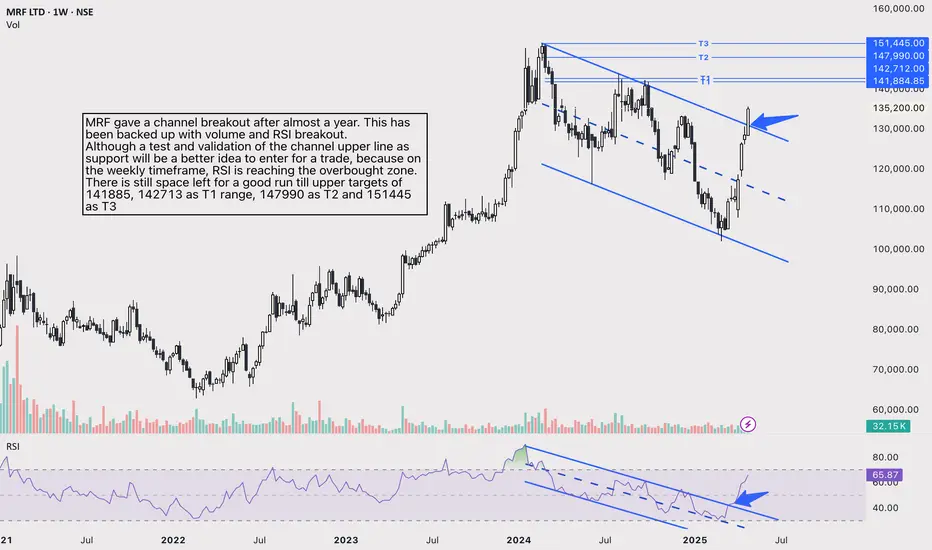
Channel breakout in MRFMRF gave a channel breakout after almost a year. This has been backed up with volume and RSI breakout.
Although a test and validation of the channel upper line as support will be a better idea to enter for a trade, because on the weekly timeframe, RSI is reaching the overbought zone.
There is still space left for a good run till upper targets of 141885, 142713 as T1 range, 147990 as T2 and 151445 as T3
MRF - Weekly EW Analysis - Long Set-up5 Wave down in C of 4 done. We should head up to ATH in 5.
Low risk trade for 130k and trail to 150-160k.

MRF - Weekly EW Analysis - Long Set-up5 Wave down in C of 4 seems done.
If not entire 4, maybe a larger W down in 4 done and a larger X to unfold.
Can play for 1,30,000 in X and ATH in 5.

Viaz Tyres Ltd: On the Verge of a Major Breakout or ReversalKey Highlights:
Resistance Zone (₹70-₹72):
The chart shows a well-defined resistance zone marked in red. This level has been tested multiple times without a breakout, making it a critical hurdle for the stock.
Ascending Trendline Support:
The blue trendline indicates a steady upward movement, with the stock consistently making higher lows. This trendline is currently acting as a strong support level, near ₹63.
Critical Support Level (₹53.90):
A red horizontal line at ₹53.90 highlights a strong support zone. If the price breaks below the ascending trendline, this level could act as the next major support.
Volume Analysis:
The stock is witnessing moderate volume near the consolidation phase, indicating indecision. A spike in volume could confirm a breakout or breakdown.
Potential Scenarios:
Bullish Outlook:
A breakout above ₹72 with strong volume could lead to a rally towards ₹85 or higher.
The ascending trendline suggests a positive bias as long as the price respects this support.
Bearish Outlook:
A breakdown below the trendline (₹63) may push the stock towards ₹53.90, the next support zone.
Failure to hold ₹53.90 could trigger further downside.
Takeaway:
The stock is currently consolidating between ₹65-₹72, forming a critical juncture for traders and investors. A breakout above resistance or breakdown below support levels will determine the next trend. Keep a close watch on volume for confirmation of the next move.

The Tyre King MRF Done with Upside?? Then Downside Levels hereStock is down almost -9% from it's freak trade all time high 150233 dated 17 Jan. 2024
There is only strong resistance around 145800
All other unnamed green horizontal lines could be work as short term support to bounce back and profit booking from short postions.
If Green line broken down decisively then "Support becomes Resistance" theory suppose to be applied.
Disclaimer: Analysis & View are personal and for the educational purposes only. Trade at your own risk. We recommend consult your financial advisors and do your own analysis before taking any trade. Profit and Losses are subject to your own risk management and constantly changing market conditions.

SellSell around 84350 stop loss 87460 target 78700.
Disc : It's not a recommendation to buy or sell.

MRF possible Elliott wave countsHello Friends,
Here we had shared possible Elliott wave counts of MRF chart, in which we can say that currently we are near to make one more top as a wave 5, so any dip could be used as an opportunity to go long with strict invalidation level of 95164, which is stoploss level of current view.
Thanks
I am not sebi registered analyst.
My studies are for educational purpose only.
Please Consult your financial advisor before trading or investing.
I am not responsible for any kinds of your profits and your losses.
Most investors treat trading as a hobby because they have a full-time job doing something else.
However, If you treat trading like a business, it will pay you like a business.
If you treat like a hobby, hobbies don't pay, they cost you...!
Disclaimer and Risk Warning.
The analysis and discussion provided on in.tradingview.com is intended for educational purposes only and should not be relied upon for trading decisions. RK_Charts is not an investment adviser and the information provided here should not be taken as professional investment advice. Before buying or selling any investments, securities, or precious metals, it is recommended that you conduct your own due diligence. RK_Charts does not share in your profits and will not take responsibility for any losses you may incur. So Please Consult your financial advisor before trading or investing.

MRF strong bull case scenarioMRF: The counter is set to become the first company to kiss 1 lac figure/ share
the counter is in a visible uptrend and has strong support at 93000-94000 ZONE
and as long as it holds support areas, it is likely to move beyond 1.10 L

Mrf daily chart wave analysis mrf share full explain elliot wave analysis daily time
first mrf go upside 5 wave and correction start wave a,b,c price retracment 38% and again go upside 5 wave 3 cycle

MRF soon going to make a new life high mrf forming triangle pattern near its high once break out the triangle than ATH possible on cards.


MRFMRF looking bullish Triangle Pattern look volatile STOCK Practice for future Trading setup practice start now ( keep Practice ) .okh

MRFMRF LOOKING BULLISH sentiment i draw a price action see the chart and watch how levels and chart work.
Do you trade on volatile Stock comment on comment section , and tells what is a positive and Negative point on volatile stock.

mrf Mrf on Big resistance trendline level so i buy Mrf when trendline breck. then Mrf very big green candle


MRF formed a bull pennant patternA Bull Pennant Pattern Formed in MRF After a Rally After a Breakout You Can Expect a Good Move Again

Long MRFPosting here the Idea and explained the details why we should by the MRF
MRF- Buying is based on falling channel breakout, Time cycle pattern and Bollinerband expansion.
If you feel the content is good , like the and subscribe.

MRF at resistanceMRF has come to a resistance level and can show short term downside here, however, any dip should be a reason to buy into this stock as the sector remains in an uptrend.

MRF LTD_ROUNDING BOTTOM BULLISHMRF LTD seems like a Rounding bottom. It's Bullish pattern and also minor trend moving in rising wedge pattern. So, Its more probability to reach Tgt 76000.
