BUY TODAY SELL TOMORROW for 5%DON’T HAVE TIME TO MANAGE YOUR TRADES?
- Take BTST trades at 3:25 pm every day
- Try to exit by taking 4-7% profit of each trade
- SL can also be maintained as closing below the low of the breakout candle
Now, why do I prefer BTST over swing trades? The primary reason is that I have observed that 90% of the stocks give most of the movement in just 1-2 days and the rest of the time they either consolidate or fall
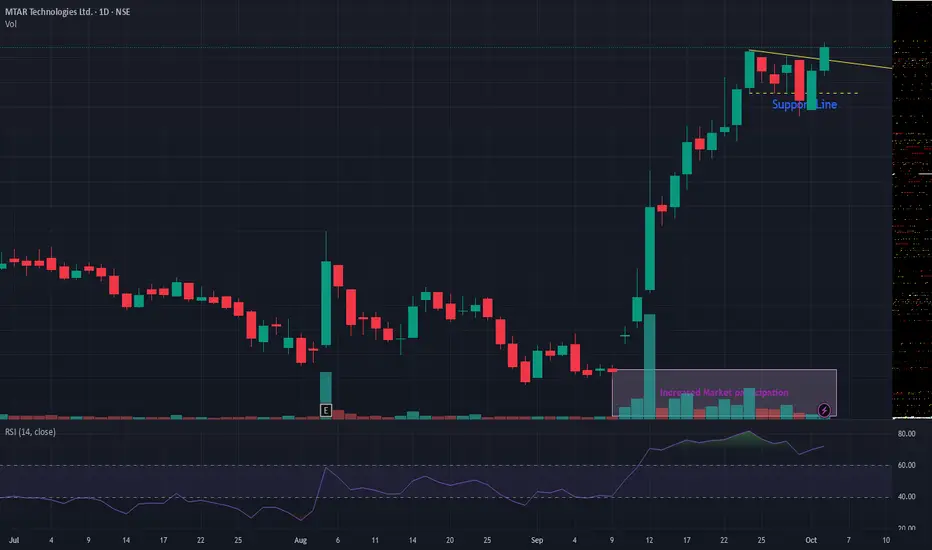
Resistance Breakout in MTARTECH
BUY TODAY SELL TOMORROW for 5%
MTARTECH

BUY TODAY SELL TOMORROW for 5%DON’T HAVE TIME TO MANAGE YOUR TRADES?
- Take BTST trades at 3:25 pm every day
- Try to exit by taking 4-7% profit of each trade
- SL can also be maintained as closing below the low of the breakout candle
Now, why do I prefer BTST over swing trades? The primary reason is that I have observed that 90% of the stocks give most of the movement in just 1-2 days and the rest of the time they either consolidate or fall
Resistance Breakout in MTARTECH
BUY TODAY SELL TOMORROW for 5%

MTARTECH - STWP Equity SnapshotPrice moved up strongly earlier, pulled back and found support.
Now it is testing the same selling area again, showing strength.
Watching how price behaves near this level is important.
STWP Equity Snapshot – MTARTECH(Educational | Chart-Based Interpretation)
📌 Intraday Reference Levels (Structure-based)
Reference Price Zone: 2,742
Risk Reference (If structure fails): 2,351.84
Observed Upside Zones: 3,210.19 → 3,522.32
📌 Swing Reference Levels (Hybrid Model | 2–5 days | Observational)
Reference Price Zone: 2,742
Risk Reference (If price weakens): 2,156.76
Higher Range Area (If strength continues): 3,912.48 → 4,790.34
Key Levels – Daily Timeframe
Support Areas: 2,548 | 2,407 | 2,310
Resistance Areas: 2,786 | 2,883 | 3,024
🔍 STWP Market Read
MTAR Technologies Ltd has moved up strongly after spending time in a sideways range. The rise happened with very high trading activity, which shows strong interest from bigger market participants. The stock also stayed strong even when the overall market was weak, which is a positive sign.
The price strength is steady and not overdone. Buying interest is clearly visible, and the move does not look rushed. As long as the price stays above the earlier breakout area, the overall price structure remains positive.
🧭 News-Linked Price Behaviour (Simple Scenarios | Educational)
Recently, a large global institution bought a stake in the company. This news has already had a positive impact on the stock price. Based on how markets usually behave after such news, a few outcomes are commonly seen:
Scenario 1: Strong and Stable Start
The stock may open slightly higher or stable and continue to trade above recent levels. This shows buyers are comfortable at higher prices.
Scenario 2: Sideways Movement
The stock may open flat and move in a narrow range. This means the market is taking time to adjust after the recent rise. This is normal and healthy.
Scenario 3: Early Rise, Then Pause
The stock may rise early in the day and then slow down or move sideways. This usually happens when short-term traders book profits and does not mean the trend has turned weak.
A sharp fall only because of this news is unlikely unless the overall market turns very negative.
📊 Chart Structure Summary
Price Structure: Strong move after a long pause
Trend Direction: Up
Price Strength: Strong
Momentum: Positive
Trading Activity: Very high, supporting the move
📈 Final Outlook (Condition-Based)
Momentum: Strong
Trend: Up
Risk: High (price can move fast both ways)
Volume: High
💡 STWP Learning Note
News can bring attention, but price behaviour after the news matters more. When price stays strong after a rise, it shows confidence. Focus on how price holds important levels instead of guessing what will happen next.
⚠️ Disclaimer
This post is for educational purposes only. It is not a recommendation or advice. Stock market investments involve risk. Please consult a SEBI-registered financial advisor before making any trading or investment decision.
📘 STWP Approach
Watch price behaviour. Control risk. Let the chart guide you.
💬 Did this help you understand the market better?
🔼 Boost to support learning
✍️ Share your thoughts or questions
🔁 Forward to someone who is learning trading
👉 Follow for simple, structured STWP insights
🚀 Stay Calm. Stay Clean. Trade With Patience.
Trade Smart | Learn Zones | Be Self-Reliant 📊

MTARTECH: Trendline BO with Fresh Momentun, Chart of the WeekNSE:MTARTECH Trendline Breakout after Signals Fresh Momentum as BofA Takes Stake in It. Let us understand it in the "Chart of the Week."
As per the Latest SEBI Mandate, this isn't a Trading/Investment RECOMMENDATION nor for Educational Purposes; it is just for Informational purposes only. The chart data used is 3 Months old, as Showing Live Chart Data is not allowed according to the New SEBI Mandate.
Disclaimer: "I am not a SEBI REGISTERED RESEARCH ANALYST AND INVESTMENT ADVISER."
This analysis is intended solely for informational purposes and should not be interpreted as financial advice. It is advisable to consult a qualified financial advisor or conduct thorough research before making investment decisions.
Price Action Overview:
- Current Price: ₹2,689.70 (+13.38%)
- 52-Week High: ₹2,920.35
- 52-Week Low: ₹1,155.60
- The stock has broken out from a multi-month symmetrical triangle pattern with strong volumes
- Price is currently trading 8% below its all-time high, showing recovery momentum
- A recent breakout occurred with significant volume expansion (6.66M vs the average of 2.38M)
Volume Spread Analysis:
- Current Volume: 6.66M (significantly above average)
- Average Volume: 2.38M
- Volume Spike: Nearly 3x the average, confirming strong institutional interest
- Breakout accompanied by highest volume in recent months
- Volume expansion during up-moves and contraction during corrections is a bullish sign
- Green volume bars dominating in recent sessions indicating buying pressure
Symmetrical Triangle Breakout:
- Formation Period: Mid-2024 to Early 2026
- Apex Point: Around ₹1,600-1,700 zone
- Breakout Level: ₹2,400-2,450
- Pattern indicates consolidation followed by directional move
- Breakout suggests potential continuation of the prior uptrend from 2022 to 2023
Descending Trendline Break:
- A major descending trendline resistance from the 2023 peak has been decisively broken
- This trendline acted as resistance throughout 2024-2025
- Break confirms shift in market sentiment from bearish to bullish
Key Support and Resistance Levels:
Major Support Zones:
- Immediate Support: ₹2,400-2,450 (breakout zone and recent consolidation)
- Secondary Support: ₹2,200-2,250 (previous resistance turned support)
- Strong Support: ₹1,900-2,000 (triangle mid-point and psychological level)
- Critical Support: ₹1,600-1,700 (triangle apex and long-term support)
Major Resistance Zones:
- Immediate Resistance: ₹2,750-2,800 (short-term supply zone)
- Major Resistance: ₹2,900-2,920 (all-time high zone)
- Psychological Resistance: ₹3,000 (round number psychological barrier)
Base Formation:
- Primary Base: The symmetrical triangle from mid-2024 to early 2026 represents a consolidation base
- This base formed after a significant decline from the 2023 highs
- Base width suggests potential for sustained upward movement
- The longer consolidation typically leads to stronger breakouts
Trend Analysis:
- Short-term Trend (Daily): Bullish with strong momentum
- Medium-term Trend (Weekly): Transitioning from consolidation to bullish
- Long-term Trend (Monthly): In recovery phase after 2023-2024 correction
- Price trading above key moving average levels post-breakout
Sectoral Backdrop:
Clean Energy and Nuclear Power Sector:
- India's nuclear power capacity expansion plans gaining momentum
- Government targeting 100 GW nuclear capacity by 2047
- Small Modular Reactors (SMRs) emerging as key focus area
- Global shift toward carbon-neutral energy boosting nuclear power demand
- MTAR is positioned as a key supplier to India's nuclear program
Defense Manufacturing Sector:
- India's defense budget increased to ₹6.21 lakh crore for FY25
- The government's 'Aatmanirbhar Bharat' initiative driving domestic defense manufacturing
- Capital outlay for defense modernization supporting equipment manufacturers
- Private sector participation in defense production expanding
- MTAR supplies critical components to defence applications, including missile systems
Space Technology Sector:
- ISRO's increasing launch frequency and ambitious missions
- Private space sector opening up with policy reforms
- Growing demand for satellite components and launch vehicle parts
- India positioning itself as a low-cost space launch provider globally
- MTAR manufactures precision components for space applications
Industrial and Clean Energy Equipment:
- India's renewable energy target of 500 GW by 2030
- Growing demand for precision-engineered components in various industries
- Export opportunities expanding in specialized manufacturing
- The government's PLI schemes supporting manufacturing competitiveness
Fundamental Backdrop:
Company Overview:
- MTAR Technologies is a precision engineering solutions company
- Specializes in manufacturing critical and precision components
- Serves diversified sectors: Nuclear, Defense, Space, and Clean Energy
- Established reputation with marquee clients including ISRO, BARC, DRDO
- Listed on NSE and BSE in March 2021
Recent Key Developments:
- BofA Securities (Bank of America) has reportedly acquired a stake in the company
- This institutional interest signals confidence in the company's growth prospects
- The timing of the stake acquisition coinciding with technical breakout is noteworthy
- Institutional buying often precedes sustained upward moves
Business Strengths:
- Strong order book visibility across multiple sectors
- High entry barriers due to specialized manufacturing capabilities
- Long-term relationships with government and PSU clients
- Diversified revenue streams reducing concentration risk
- Focus on high-margin precision engineering products
Growth Drivers:
- Expanding nuclear power program in India
- Increasing defense indigenization requirements
- Growing space sector opportunities with ISRO and private players
- Clean energy transition driving demand for specialized components
- Potential for export growth in precision engineering
Key Metrics to Watch:
- Order book growth and execution
- Revenue mix across different sectors
- Operating margins and profitability trends
- Capacity utilization and expansion plans
- Working capital management
Risk Factors:
- Failure to hold ₹2,400 support could trigger profit booking
- Market-wide correction could impact momentum
- Any negative news on key sectors (defence/nuclear) could affect sentiment
- Overbought conditions in the near term may lead to consolidation
Key Levels to Watch:
- Breakout Confirmation: Sustained trade above ₹2,700
- Momentum Acceleration: Break above ₹2,920 (all-time high)
- Support Test: How price behaves if it retests ₹2,400-2,450 zone
- Volume Sustenance: Whether high volumes continue or fade
My 2 Cents:
MTAR Technologies is showing a strong technical setup following a prior symmetrical triangle breakout and current trendline breakout with exceptional volumes. The combination of technical breakout, institutional interest from BofA Securities, and favorable sectoral tailwinds in nuclear, defense, and space sectors creates a compelling case. However, traders should watch for confirmation above the ₹2,700-2,750 levels and manage risk appropriately. The stock's positioning in high-growth strategic sectors provides a supportive fundamental backdrop for the technical rally.
Full Coverage on my Mid-Week Newsletter coming Wednesday.
Keep in the Watchlist and DOYR.
NO RECO. For Buy/Sell.
📌Thank you for exploring my idea! I hope you found it valuable.
🙏FOLLOW for more
👍BOOST if you found it useful.
✍️COMMENT below with your views.
Meanwhile, check out my other stock ideas on the right side until this trade is activated. I would love your feedback.
As per the Latest SEBI Mandate, this isn't a Trading/Investment RECOMMENDATION nor for Educational Purposes; it is just for Informational purposes only. The chart data used is 3 Months old, as Showing Live Chart Data is not allowed according to the New SEBI Mandate.
Disclaimer: "I am not a SEBI REGISTERED RESEARCH ANALYST AND INVESTMENT ADVISER."
This analysis is intended solely for informational purposes and should not be interpreted as financial advice. It is advisable to consult a qualified financial advisor or conduct thorough research before making investment decisions.

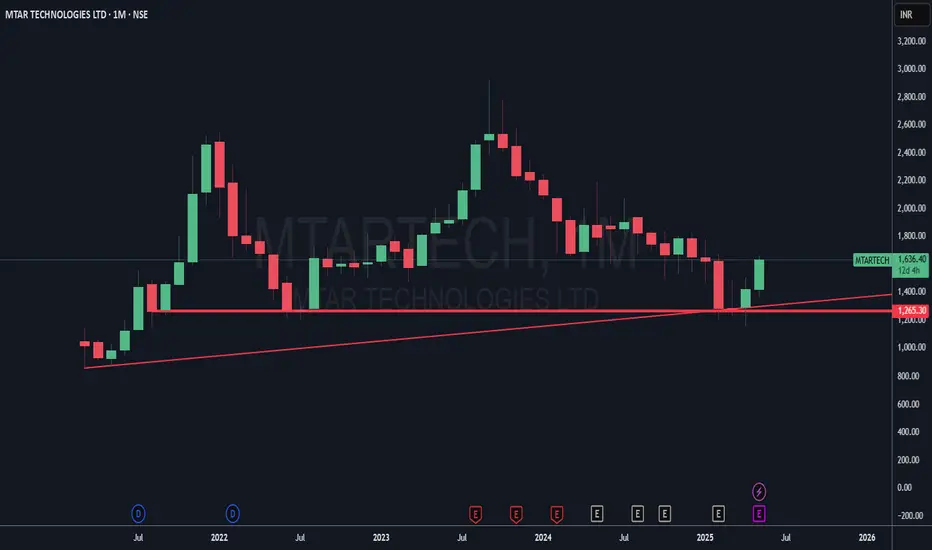
BUY TODAY SELL TOMORROW for 5%DON’T HAVE TIME TO MANAGE YOUR TRADES?
- Take BTST trades at 3:25 pm every day
- Try to exit by taking 4-7% profit of each trade
- SL can also be maintained as closing below the low of the breakout candle
Now, why do I prefer BTST over swing trades? The primary reason is that I have observed that 90% of the stocks give most of the movement in just 1-2 days and the rest of the time they either consolidate or fall
Trendline Breakout in MTARTECH
BUY TODAY SELL TOMORROW for 5%

MTARTECHMTARTECH giving trend-line breakout. VCP breakout also observed. Volume too has spiked. As long as it is above support line, the stock seems attractive. Many defense stocks are showing strength and trying to give a run! Keep in your watchlist
BUY TODAY SELL TOMORROW for 5%DON’T HAVE TIME TO MANAGE YOUR TRADES?
- Take BTST trades at 3:25 pm every day
- Try to exit by taking 4-7% profit of each trade
- SL can also be maintained as closing below the low of the breakout candle
Now, why do I prefer BTST over swing trades? The primary reason is that I have observed that 90% of the stocks give most of the movement in just 1-2 days and the rest of the time they either consolidate or fall
Resistance Breakout in MTARTECH
BUY TODAY SELL TOMORROW for 5%

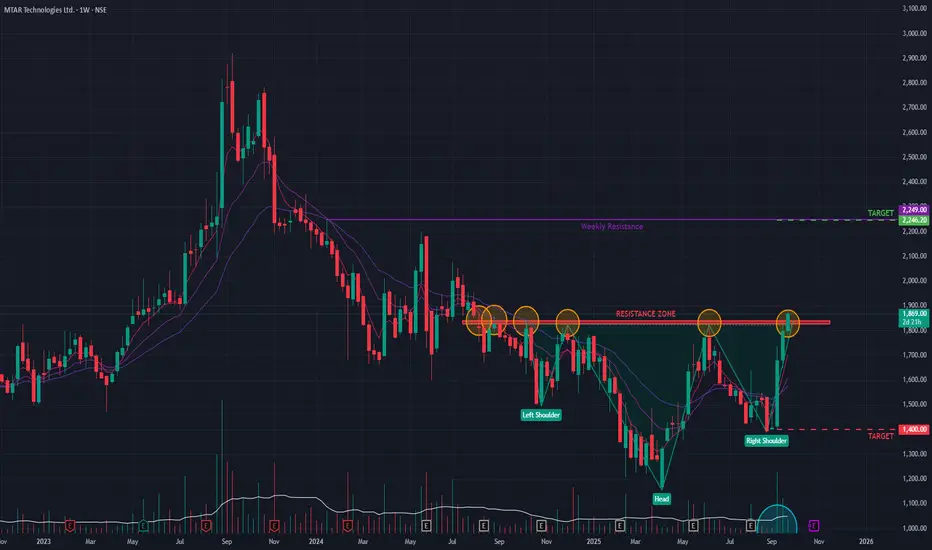
MTAR Tech (W) - Signals Bullish Reversal with Pattern BreakoutMTAR Tech has shown a significant sign of a potential long-term trend reversal. The stock, which has been in a prolonged downtrend since its All-Time High in September 2023, has decisively broken out of an Inverse Head & Shoulders pattern on the weekly chart today.
This classic bullish reversal pattern was confirmed by a strong upward move that breached the neckline, supported by decent trading volume .
Multi-Timeframe Confirmation 👍
The bullish thesis is strongly supported by momentum indicators across all major timeframes:
- Broad Momentum: The Relative Strength Index (RSI) is in a bullish crossover state on the monthly, weekly, and daily charts , indicating synchronized positive momentum.
- Volume Trend: The general trend of building volume suggests increasing buyer participation and conviction in the upward move.
Future Outlook and Key Levels
The breakout from this major reversal pattern suggests the downtrend that began in mid-2023 may be over. The price action in the coming days will be crucial for confirmation.
- Bullish Case 📈: If the breakout momentum is sustained, the stock could be on a path toward the next major resistance level near ₹2,245 .
- Bearish Case 📉: However, if the breakout fails to hold and momentum wanes, the stock could pull back to test support around the ₹1,400 level.
MTAR Technologies: The hidden giant behind space & clean Energy NSE:MTARTECH
🏢 Company Overview:
MTAR Technologies Ltd is a precision engineering company catering to high-value, mission-critical sectors such as:
Clean Energy (Hydrogen, Nuclear, etc.)
Space & Defence
Aerospace
They manufacture critical components like fuel cells, nuclear reactor parts, aerospace engines, and satellite launch system parts.
📈 Fundamental Analysis:
✅ Key Financials (FY24-25 Estimates):
Market Cap : ₹6,500+ Cr
Revenue (FY24) : ₹650 Cr+
EBITDA Margin : ~28-30%
PAT Margin : ~15%
ROE / ROCE : 15-18% / 20%+
Debt to Equity : 0.1 (Very low)
P/E Ratio : ~45x (Premium)
🧩 Strengths:
Strong order book from ISRO, DRDO, BHEL, and international clean energy players like Bloom Energy.
Technological moat in nuclear & space-grade precision engineering.
Low debt, high return ratios—financials are robust.
Entering Hydrogen & Fuel Cell space—a big long-term catalyst.
⚠️ Risks:
Dependency on a few clients (Bloom Energy being a major one).
Volatility in clean energy adoption pace.
High valuation – priced for growth.
📊 Technical Analysis (As of July 2025):
🧾 Price Action Summary:
CMP: ₹2,050 (Example)
52-Week Range: ₹1,250 – ₹2,150
Trend: Bullish continuation from March 2025
Support Zone: ₹1,860 – ₹1,950
Resistance: ₹2,150 (all-time high breakout zone)
🔍 Indicators:
200 EMA: ₹1,620 (Stock trading well above 200 EMA)
MACD: Bullish crossover on daily chart
RSI: ~67—momentum strong but near overbought zone
Volume: Rising steadily with price—confirms strength
📉 Short-Term View:
Healthy consolidation expected around ₹2,000–₹2,150
A breakout above ₹2,150 could lead to ₹2,400–₹2,600 zone
🚀 Future Growth Prospects:
🔬 1. Clean Energy Boom:
Supplying parts to Bloom Energy (US-based Fuel Cell firm).
India’s green hydrogen policy and PLI schemes can benefit MTAR.
🛰️ 2. Space & Defense:
Increasing budgets in defense, ISRO’s new missions, and India’s entry into private space programs can drive long-term orders.
💹 3. Export Potential:
MTAR is entering global markets for nuclear and aerospace precision components.
USD-denominated revenues provide a hedge and higher margins.
🌱 4. Capex & Expansion:
New manufacturing facility in Adibatla, Telangana.
Capex being done to triple capacity in the coming 3–5 years.
📝 Conclusion:
Parameter Verdict
Fundamentals 🔵 Strong (Clean Balance Sheet, Healthy Margins)
Technicals 🟢 Bullish (But Near Resistance)
Valuation 🟡 Slightly Overvalued (but justified by growth)
Long-Term View ✅ Positive – Multiyear structural story
Short-Term View 🔄 Wait for consolidation or breakout above ₹2,150
⚠️ Disclaimer:
This analysis is for educational and informational purposes only.
We are not SEBI-registered analysts or advisors.
This is our personal view based on available data and market trends.
Please consult your SEBI-registered investment advisor before making any investment or trading decisions.
You are solely responsible for any financial decisions you make based on this content.
========================
Trade Secrets By Pratik
========================
Tools
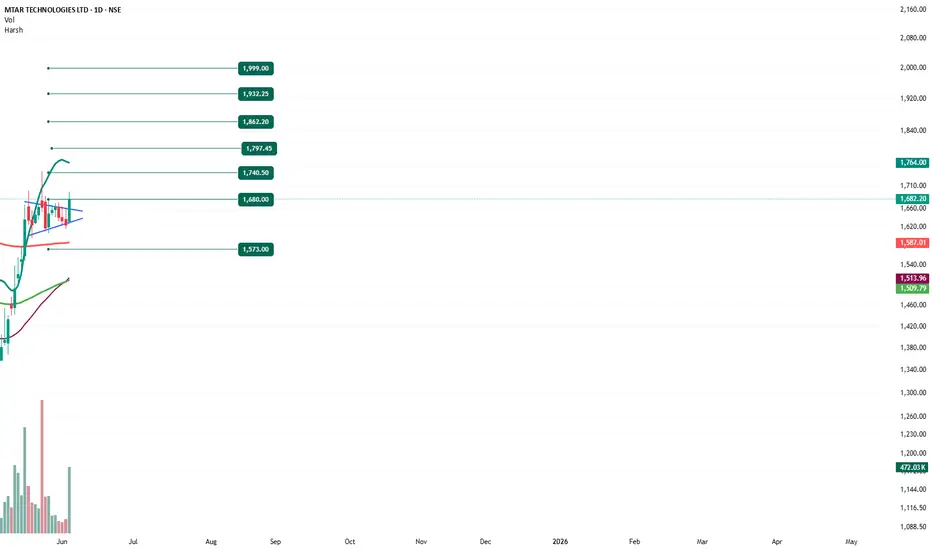
MTAR TECHNOLOGIES - Bullish Flag & Pole Breakout (Daily T/F)Trade Setup
📌 Stock: MTAR TECHNOLOGIES LTD ( NSE:MTARTECH )
📌 Trend: Strong Bullish Momentum
📌 Risk-Reward Ratio: 1:3 (Favorable)
🎯 Entry Zone: ₹1680.00 (Breakout Confirmation)
🛑 Stop Loss: ₹1573.00 (Daily Closing Basis) (-6.3% Risk)
🎯 Target Levels:
₹1740.50
₹1797.45
₹1862.20
₹1932.25
₹1999.00 (Final Target)
Technical Rationale
✅ Bullish Flag & Pole Breakout - Classic bullish pattern confirming uptrend continuation
✅ Strong Momentum - Daily, Weekly & RSI >60 (Bullish zone)
✅ Volume Confirmation - Breakout volume 472.5K vs previous day's 98.43K (Nearly 4.7x surge)
✅ Multi-Timeframe Alignment - Daily and weekly charts showing strength
Key Observations
• The breakout comes with significantly higher volume, validating strength
• Well-defined pattern with clear price & volume breakout
• Conservative stop loss at recent swing low
Trade Management Strategy
• Consider partial profit booking at each target level
• Move stop loss to breakeven after Target 1 is achieved
• Trail stop loss to protect profits as price progresses
Disclaimer ⚠️
This analysis is strictly for educational purposes and should not be construed as financial advice. Trading in equities involves substantial risk of capital loss. Past performance is not indicative of future results. Always conduct your own research, consider your risk appetite, and consult a financial advisor before making any investment decisions. The author assumes no responsibility for any trading outcomes based on this information.
What do you think? Are you watching NSE:MTARTECH for this breakout opportunity? Share your views in the comments!
Building Nation With Exceptional EngineeringMTAR Technologies - CMP 1636
MTAR develops and manufactures components and equipment for the defense, aerospace, nuclear and clean energy sectors. The company was incorporated in 1970 by the promoters, Mr PR Reddy, Mr KSN Reddy and Mr PJ Reddy, to cater to the technical and engineering needs of the Indian government in the post embargo regime. MTAR has manufacturing footprints in Hyderabad with seven units spread across a 4 km radius and a dedicated export facility as well.
In addition, the company also supplies specialised products such as Ball Screws, Water Lubricated Bearings, Roller Screws, Electro-Mechanical Actuation Systems, ASP assemblies etc. that find applications across diverse sectors.
This is just to boost my confidence. No Suggestions for buying.
Disclosure: I am not SEBI registered. The information provided here is for educational purposes only. I will not be responsible for any of your profit/loss with these suggestions. Consult your financial Adviser before making any decisions.
Volumes have dried on long term chart viewStock has in been downtrend with healthy correction.
Candles are big however the volumes are low.
Disclaimer: View for Education only, not to be taken as trading or investment advice.

MACD Crossover - MTARTECH📊 Script: MTARTECH
📊 Sector: Aerospace & Defense
📊 Industry: Engineering
Key highlights: 💡⚡
📈 Script is trading at middle band of BB.
📈 MACD is giving crossover.
📈 Script may fill the gap.
📈 Right now RSI is around 50.
📈 One can go for Swing Trade.
⏱️ C.M.P 📑💰- 1911
🟢 Target 🎯🏆 - 2071
⚠️ Stoploss ☠️🚫 - 1828
⚠️ Important: Always maintain your Risk & Reward Ratio.
✅Like and follow to never miss a new idea!✅
Disclaimer: I am not SEBI Registered Advisor. My posts are purely for training and educational purposes.
Eat🍜 Sleep😴 TradingView📈 Repeat 🔁
Happy learning with trading. Cheers!🥂

SHORT TERM SWING OPPORTUNITY IN MTAR TECHNOLOGIES LTD."MTAR TECHNOLOGIES LTD" is about to change it's weekly structure with a trendline support valid since 2021. Confirmation is above 2200 on closing basis. If the trade goes as planned, it is going to give a return of almost15% which is good. Stop loss will be planned once entry is activated. Target is calculated using the XABCD Pattern of Harmonics. Profit should be booked between 2500 and 2543 as it happens to be the PRZ area of the XABCD Pattern. Above 2600, it is going to test it's ATH again.

MTAR Technologies Ltd - Breakout OpportunityDate : 21-May-2024
Rating : Buy - Positional Trade
LTP : Rs. 2,110.35
Targets: (1) Rs. 2,320 --> (2) Rs. 2,475 --> (2) Rs. 2,563
SL : Rs. 1,910 on daily close basis
Technical View:
• NSE:MTARTECH was moving in its primary downtrend since Sep-2023.
• After touching the lifetime high of 2,920 on 11-Sep-2023, it has retraced 43% to 1,661 level.
• On 21-May-2024, NSE:MTARTECH has broke out from its primary down trend with higher than average volume.
• Since 17-May-2024, NSE:MTARTECH is trading above 20 DMA, 50 DMA and 21 DEMA.
• RSI is trading at 75.36 and MACD is trading at 38.04.
• Both RSI and MACD is showing positive divergence on daily timeframe indicating a trend reversal.
Disclaimer : I am not a SEBI registered analyst/consultant and not recommending anyone to take any BUY or SELL position in stock market. Investing in stock market is risky and one should do a self analysis and validation before investing in stock market. Ideas are published for learning purpose only.

Double Moving Averages Crossover Swing Trade📊 Script: RAILTEL
📊 Sector: Telecomm-Service
📊 Industry: Telecommunications - Service Provider
⏱️ C.M.P 📑💰- 433
🟢 Target 🎯🏆 - 475
⚠️ Stoploss ☠️🚫 - 415
📊 Script: TATASTEEL
📊 Sector: Steel
📊 Industry: Steel - Large
⏱️ C.M.P 📑💰- 174
🟢 Target 🎯🏆 - 183
⚠️ Stoploss ☠️🚫 - 170
📊 Script: SUZLON
📊 Sector: Capital Goods - Electrical Equipment
📊 Industry: Electric Equipment
⏱️ C.M.P 📑💰- 44
🟢 Target 🎯🏆 - 48
⚠️ Stoploss ☠️🚫 - 42
📊 Script: ADANIPORTS
📊 Sector: Marine Port & Services
📊 Industry: Miscellaneous
⏱️ C.M.P 📑💰- 1385
🟢 Target 🎯🏆 - 1454
⚠️ Stoploss ☠️🚫 - 1361
📊 Script: MTARTECH
📊 Sector: Aerospace & Defense
📊 Industry: Engineering
⏱️ C.M.P 📑💰- 2110
🟢 Target 🎯🏆 - 2231
⚠️ Stoploss ☠️🚫 - 2046
⚠️ Important: Always maintain your Risk & Reward Ratio.
✅Like and follow to never miss a new idea!✅
Disclaimer: I am not SEBI Registered Advisor. My posts are purely for training and educational purposes.
Eat🍜 Sleep😴 TradingView📈 Repeat 🔁
Happy learning with trading. Cheers!🥂

MTARTech-A beautiful channel consolidation!MTARTech is one of the leading stock from defence sector. However, stock is underperforming and is currently in a channel consolidation.
Recent news of arms exports to Russia has triggered a rally in defence stocks like Datapatterns, BEL, BDL, etc.
Mtar is bouncing from lower end of channel and we can expect big rally in this stock too. A good stock for investment purposes as well.
Disclaimer:This is not a recommendation and this is my personal analysis and opinion about stock.

MTARTECH Perfect Price Action SetThe MTARTECH is the perfect price action set-up in the current location, this is [erfect example of the Price action brackout and than Pull-back now your can this is Good risk rewad set-up.
I am bullish on this share at current price action

Trade-50/100-MTARTEC-R:R Experiment-BuyBuying MTAR TECHNOLOGIES in DAILY positional trade
Good structure making HH-HL.

MTAR Technologies Ltd - Long Setup, Move is ON...#MTARTECH trading above Resistance of 2563
Next Resistance is at 3615
Support is at 1912
Here are previous charts:
Chart is self explanatory. Entry, Resistances and Support are mentioned on the chart.
Disclaimer: This is for demonstration and educational purpose only. This is not buying or selling recommendations. I am not SEBI registered. Please consult your financial advisor before taking any trade.

MTAR Technologies Ltd - Long Setup, Move is ON...#MTARTECH trading above Resistance of 2198
Next Resistance is at 2563
Support is at 1711
Here is previous chart:
Chart is self explanatory. Entry, Resistances and Support are mentioned on the chart.
Disclaimer: This is for demonstration and educational purpose only. This is not buying or selling recommendations. I am not SEBI registered. Please consult your financial advisor before taking any trade.


MTAR TECH – Strong Bullish BreakoutKey Points:
- Breakout from very Long period consolidation zone
- RSI > 70 and Crossed RSI MA
- All EMA crossed and good potential of up-move
- Resistance Level breakout
- Portfolio component
In Gujarati “ Bhav is Bhagwan ”
Disclaimer :
I am not a SEBI registered Analyst.
Please do your own Analysis before taking any trade/investment.
The above view is just for educational purpose only.
