Swing/Positional Setup: Sector-wise Analysis – Cash/Options Segm✅ Swing and Positional Trade Setup
Sector-wise Analysis – Cash / Futures & Options Segment:-
Over the past 18+ years, I have developed a trading setup that revolves around sectoral analysis. My trades are taken in cash, futures, and options, based on which sector and which stock is showing strength.
Below, I’ve shared the complete sector-wise stock list. This will help you skip the most time-consuming part—stock selection—so you can focus purely on execution and discipline.
🔍 Stock Selection Criteria: List Provided Sector Wise Stocks -
• Market Capitalization
• Liquidity
• Volumes
📊 1. Positional/Swing Trade Setup
This setup begins by identifying:
• Which sector is currently showing strength (e.g., Nifty Auto).
• Which stocks in that sector are outperforming the benchmark.
⚠️ Note for Beginners:
If your capital is below ₹20 lakhs, avoid trading in futures. Stick to cash market or stock options only.
🕒 Timeframes for Analysis:
• Monthly
• Weekly
• Daily
🛠️ Technical Tools Used:
• 9 SMA (Simple Moving Average)
• Volumes
• RSI (Relative Strength Index)
• Market Structure
(HH–HL for bullish, LH–LL for bearish)
📈 Entry Criteria (Bullish / Long Trades):
For Options (Call), Cash or Futures Buy:
• Price must be above 9 SMA on Monthly, Weekly, and Daily charts.
• Monthly and Weekly RSI > 50
• Daily RSI > 60 → This confirms a 7-Star Setup (Big Momentum Trade)
✅ Execution Plan:
• Entry: Above the high of the previous daily candle.
• Stop Loss: Below Daily 9 SMA or the recent swing low.
• Trailing Strategy:
• After 3 daily candles, trail stop loss to cost.
• Continue trailing below each new daily candle's low.
Exit Criteria:
• Daily close below 9 SMA
• OR RSI drops below 60
• OR both conditions occur
📉 Entry Criteria (Bearish / Short Trades – Put Option or Short in Futures):
• Daily and Weekly RSI < 50
• Price must be below 9 SMA on Daily and Weekly charts.
• Entry, stop-loss, and exit follow the same process in reverse.
📂 Sector-wise Stock List to Focus On:
🚗 Auto:
ASHOKLEY | BAJAJ-AUTO | BALKRISIND | BHARATFORG | BOSCHLTD | EICHERMOT | EXIDEIND | HEROMOTOCO | MRF | M&M | MARUTI | MOTHERSON | TVSMOTOR | TATAMOTORS | TIINDIA
🏦 Banking & Financial Services:
AU Small Finance Bank Ltd. | Axis Bank Ltd. | Bank of Baroda | Canara Bank | Federal Bank Ltd. | HDFC Bank Ltd. | ICICI Bank Ltd. | IDFC First Bank Ltd. | IndusInd Bank Ltd. | Kotak Mahindra Bank Ltd. | Punjab National Bank | State Bank of India | Bajaj Finance Ltd. | Bajaj Finserv Ltd. | Cholamandalam Investment and Finance Company Ltd.
⚗️ Chemicals:
Aarti Industries Ltd. | Atul Ltd. | Bayer Cropscience Ltd. | Chambal Fertilizers & Chemicals Ltd. | Coromandel International Ltd. | Deepak Nitrite Ltd. | E.I.D. Parry (India) Ltd. | Gujarat Fluorochemicals Ltd. | Gujarat Narmada Valley Fertilizers and Chemicals Ltd. | Himadri Speciality Chemical Ltd. | Linde India Ltd. | Navin Fluorine International Ltd. | PCBL Chemical Ltd. | PI Industries Ltd. | Pidilite Industries Ltd. | SRF Ltd. | Solar Industries India Ltd. | Sumitomo Chemical India Ltd. | Tata Chemicals Ltd. | UPL Ltd.
🛍️ FMCG:
Britannia Industries Ltd. | Colgate Palmolive (India) Ltd. | Dabur India Ltd. | Emami Ltd. | Godrej Consumer Products Ltd. | Hindustan Unilever Ltd. | ITC Ltd. | Marico Ltd. | Nestle India Ltd. | Patanjali Foods Ltd. | Radico Khaitan Ltd. | Tata Consumer Products Ltd. | United Breweries Ltd. | United Spirits Ltd. | Varun Beverages Ltd. | Dmart
💊 Pharma & Healthcare:
Abbott India Ltd. | Alkem Laboratories Ltd. | Apollo Hospitals Enterprise Ltd. | Aurobindo Pharma Ltd. | Biocon Ltd. | Cipla Ltd. | Divi's Laboratories Ltd. | Dr. Reddy's Laboratories Ltd. | Fortis Healthcare Ltd. | Glenmark Pharmaceuticals Ltd. | Granules India Ltd. | Ipca Laboratories Ltd. | Laurus Labs Ltd. | Lupin Ltd. | Mankind Pharma Ltd. | Max Healthcare Institute Ltd. | Sun Pharmaceutical Industries Ltd. | Syngene International Ltd. | Torrent Pharmaceuticals Ltd. | Zydus Lifesciences Ltd.
💻 IT & Tech:
Coforge Ltd. | HCL Technologies Ltd. | Infosys Ltd. | LTIMindtree Ltd. | MphasiS Ltd. | Oracle Financial Services Software Ltd. | Persistent Systems Ltd. | Tata Consultancy Services Ltd. | Tech Mahindra Ltd. | Wipro Ltd.
⚒️ Metals:
APL Apollo Tubes Ltd. | Adani Enterprises Ltd. | Hindalco Industries Ltd. | Hindustan Copper Ltd. | Hindustan Zinc Ltd. | JSW Steel Ltd. | Jindal Stainless Ltd. | Jindal Steel & Power Ltd. | Lloyds Metals And Energy Ltd. | NMDC Ltd. | National Aluminium Co. Ltd. | Steel Authority of India Ltd. | Tata Steel Ltd. | Vedanta Ltd. | Welspun Corp Ltd.
🏙️ Realty:
Anant Raj Ltd. | Brigade Enterprises Ltd. | DLF Ltd. | Godrej Properties Ltd. | Macrotech Developers Ltd. | Oberoi Realty Ltd. | Phoenix Mills Ltd. | Prestige Estates Projects Ltd. | Raymond Ltd. | Raymond Realty Ltd. | Sobha Ltd.
🧱 Durables & Cement:
Amber Enterprises India Ltd. | Bata India Ltd. | Blue Star Ltd. | Century Plyboards (India) Ltd. | Cera Sanitaryware Ltd. | Crompton Greaves Consumer Electricals Ltd. | Dixon Technologies (India) Ltd. | Havells India Ltd. | Kajaria Ceramics Ltd. | Kalyan Jewellers India Ltd. | PG Electroplast Ltd. | Titan Company Ltd. | V-Guard Industries Ltd. | Voltas Ltd. | Whirlpool of India Ltd. | ACC | Ambuja Cements | Ultratech Cement | Shree Cements | JK Cement
🛢️ Oil & Gas:
Adani Total Gas Ltd. | Aegis Logistics Ltd. | Bharat Petroleum Corporation Ltd. | Castrol India Ltd. | GAIL (India) Ltd. | Gujarat Gas Ltd. | Gujarat State Petronet Ltd. | Hindustan Petroleum Corporation Ltd. | Indian Oil Corporation Ltd. | Indraprastha Gas Ltd. | Mahanagar Gas Ltd. | Oil & Natural Gas Corporation Ltd. | Oil India Ltd. | Petronet LNG Ltd. | Reliance Industries Ltd.
✨ Final Thoughts
If you have any doubts or need help, feel free to ask. Take some time to reflect on this system. It offers clarity, discipline, and a pathway to wealth and peace of mind.
Don’t overconsume content. Stick to one tested process. Treat trading like a business, not a quick-money scheme.
🎯 Proven Success Rate: 80%
Add these stocks to your watchlist and follow the system diligently.
Wishing you successful trades ahead. May we all grow together. Happy to help always. 🙏
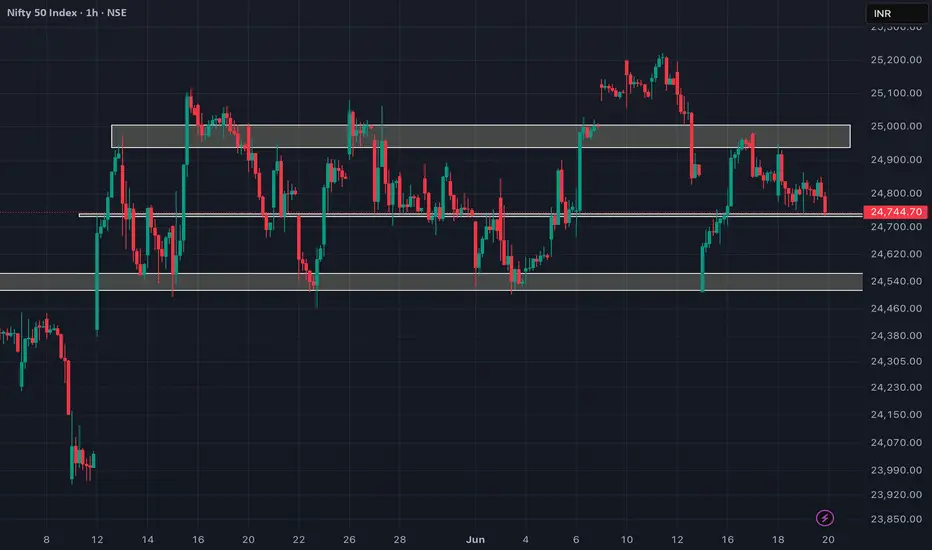
Multiple Time Frame Analysis
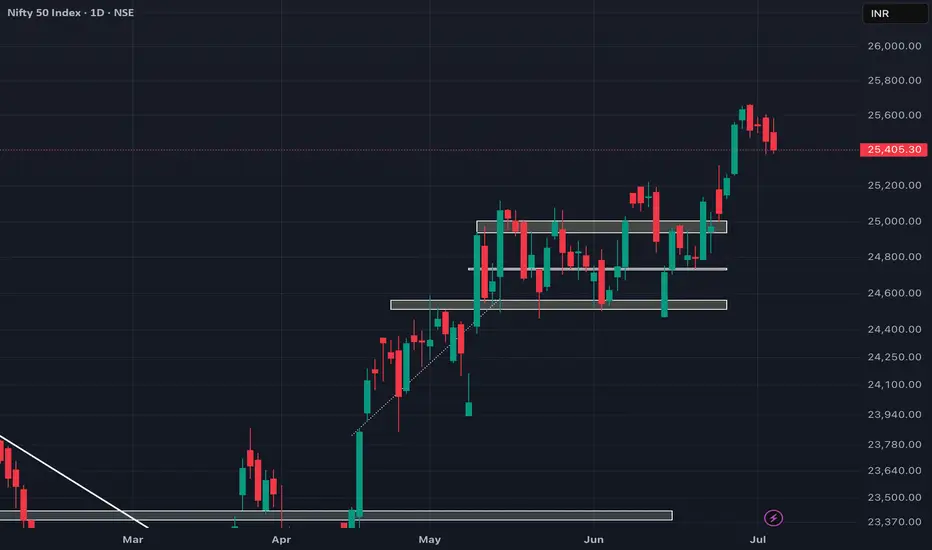
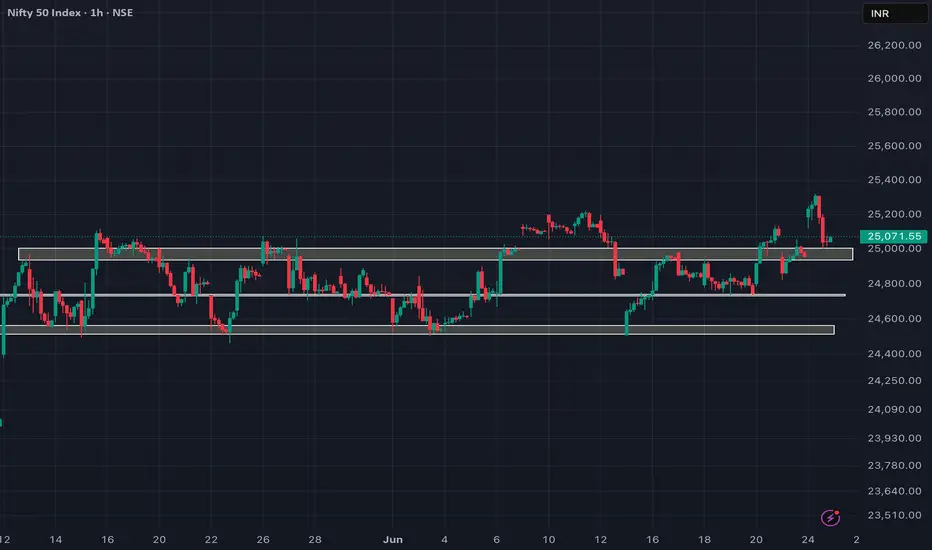
NIFTY still looks weak!After a series of weakness, NIFTY finally showed signs of REVERSAL without important demand zone but looking technically, NIFTY still looks weak and can fall upto 25200 before finally continuing its upmove so we can expect NIFTY to remain sideways to bearish in coming trading sessions till it reaches our demand zone so plan your trades accordingly and keep watching everyone.

Beauty of Fibonacci Resistance Speed Fan on Gold as a Golden
1. Look at the Beauty of Fibonacci Resistance Speed Fan on Gold as a Golden View
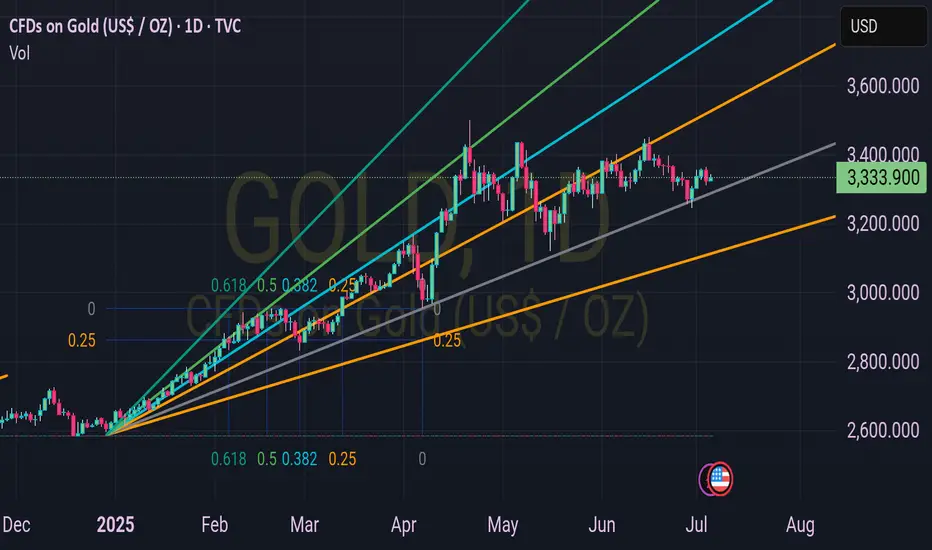
The weekly chart of CFDs on Gold (USD/oz) showcases a stunning Fibonacci resistance fan, guiding price action with precision.
2. Fibonacci Levels as Key Resistance Zones
The fan, drawn from the 2025 low, highlights critical resistance levels: 0.25 at $3,250,000, 0.382 at $3,333,900 (current price), 0.5, 0.618, and beyond, acting as potential ceilings.
3. Current Price Action at $3,333.90
As of July 06, 2025, 01:16 PM +04, gold trades at $3,333.90 (+$8.48 or +0.26%), aligning perfectly with the 0.382 Fibonacci level, indicating a strong resistance test.
4. Upward Momentum Meets Resistance
The price has risen steadily from $2,500 in December 2024, but the Fibonacci fan suggests a potential pause or reversal as it approaches the 0.382 and 0.5 levels.
5. 0.5 Level at $3,500 as a Major Hurdle
The 0.5 Fibonacci resistance at $3,500 looms large, where gold may face significant selling pressure if it breaks through the current $3,333.90 mark.
6. 0.618 Level Signals Next Target
Should gold surpass $3,500, the 0.618 level around $3,750 could be the next psychological and technical barrier, testing bullish strength.
7. Trendline Support Aligns with Fibonacci
The ascending trendline, intersecting near $3,250, complements the Fibonacci fan, offering dynamic support if a pullback occurs from these resistance zones.
8. Recent Price Action Reflects Fibonacci Precision
The recent $8.48 uptick to $3,333.90 demonstrates gold’s adherence to the 0.382 level, reinforcing the fan’s predictive power over the past months.
9. Potential Breakout or Reversal Ahead
Traders should watch for a breakout above $3,333.90 towards $3,500 or a reversal back to $3,250, with the Fibonacci fan providing clear levels to monitor.
10. Strategic Trading with Fibonacci Insights
Use the Fibonacci resistance fan to plan entries and exits, leveraging its alignment with gold’s current $3,333.90 price to anticipate the next move in this golden market.
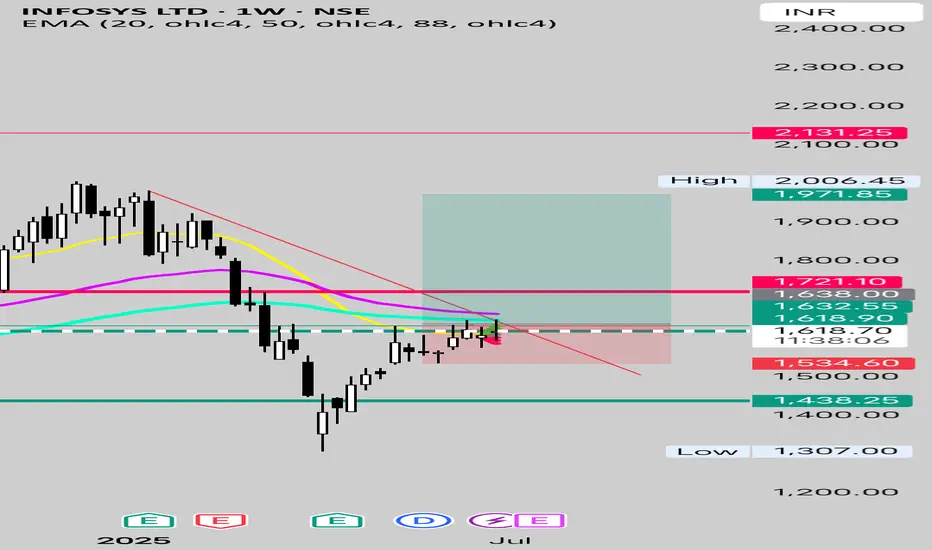
Infosys Ready For 30% Potential UpsideFrom 2000 to 2020
Over period of 20 Years ( Observe The Marked Circles)
Infosys on Monthly TF has Bounced And Rallied Sharply Everytime it has Touched 88 ~ 100 MEMA after Crossing the 20-50 MEMA and has traded in a Parallel Channel which provides a Stable And Solid Structure to Match the Fundamental Growth of the Stock.
Ever Since The Mega Breakout of 2020 after crossing 1.618 Fib Extension of the Rally that began in 2000
We have Upgraded the Channel
We are Near the Trendline and have been consolidating for about 8 Weeks without any signs of Bearishness.
This Prolonged consolidation followed by Trendline break and Historical Higher Monthly TF Support makes good case for Potential Upside of about 30% from CMP 1618 which will gain momentum above 1720.
Targeting 2000~2100 which happens to coincide with Upper End of the Parallel Channel
Look for the Inv Head and Shoulder in Formation in Short term for Swing Trade
Hereby Sharing a Short term Potential Trade with Longer Term Perspective in The Description above.
Buy Above 1638
SL below 1530
TP 1950~ 2000
R:R = 3
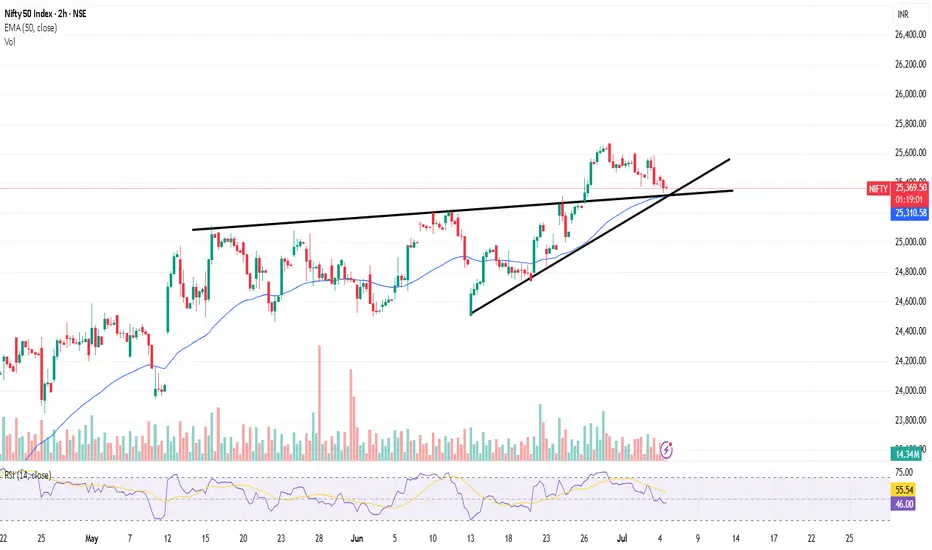
NIfty Bullish Breakout RetestHello Everyone,
Profit Booking in nifty from 25660 to now 25330__RSi also adjusted from overbought to now at 45-50 Volume shows sellers dont have enough strenth to push the market down ....Clearly Buy on dips set up with all the conflunence EMA support and Trendline support makes set up more stronger.
Get ready For new Lifetime High.
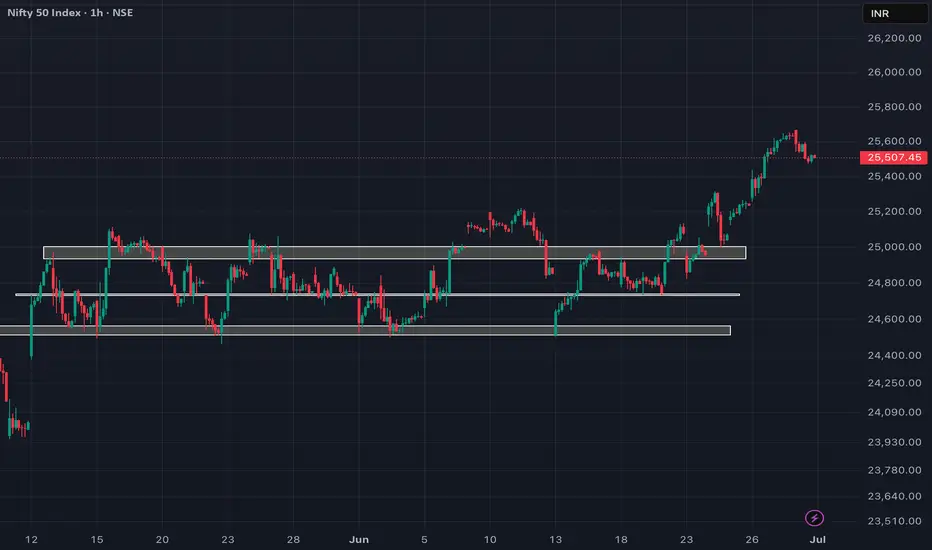
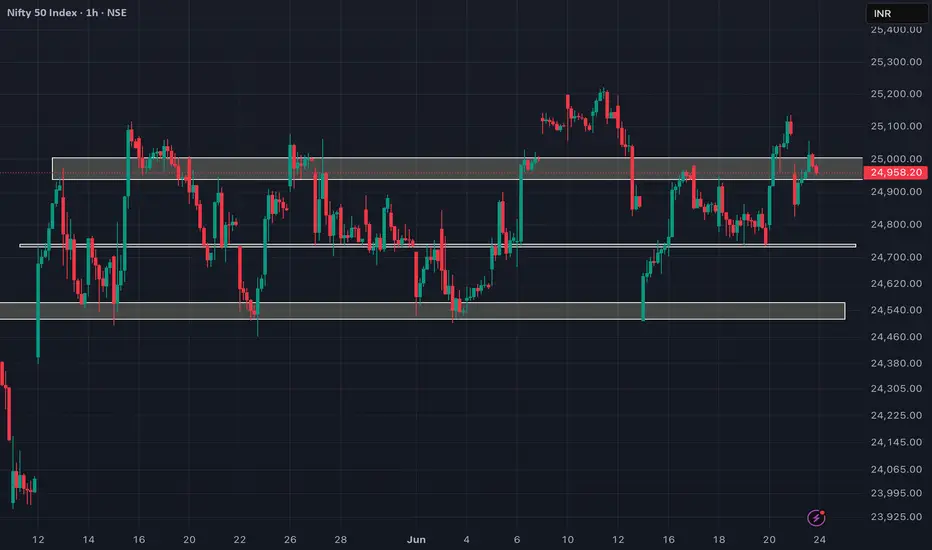
NIFTY might get weaker below 25400 levels!As we can see NIFTY had been sideways to negative till now as analysed but it seems it can get even more weaker below 25400 levels as this has acted as a suppor since past few days hence any quality break can show downside till 25200 level which has been analysed in our previous analysis so plan your trades accordingly and keep watching everyone.
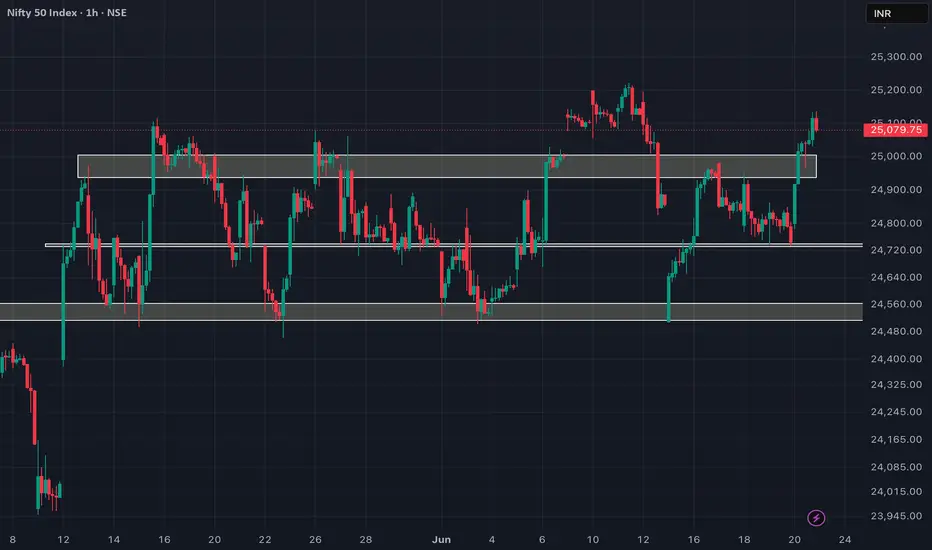
25200 is the level we are looking at right now as a DEMAND ZONE!As we can see NIFTY has fallen subsiquently from our supply zone exactly as analysed. Now that it has started to fall, we can expect NIFTY to fall till 25200 which is its next important demand zone hence we must wait for signs of reversal around this demand zone so plan your trades accordingly and keep watching everyone.

Buy Opportunity in GoldI am watching it since 1 month. The Gold had taken its retracement.
On lower (1h and 4H) timeframe, It traded in strong trends' zones which were broken yesterday. Now the crocodile traders should wait for its resistance zone and get a signal on 1 h or 4h timeframe to buy above resistance zone, above 3360.
An H4 healthy candle closing above this resitance zone will pave the way into another test of 3422 area, not putting any TP though as my target is 5000 (fundamentaly).

BEARISH! but a TRAP might come !As we can see NIFTY had been sideways to bearish from our supply zone as of now. Now looking at the structure, it can be seen it is forming more like a double bottom pattern wherein a breakout can be anticipated above 25600 levels which could be a possible trap so unless NIFTY sustains itself above 25750 levels, making fresh new longs should be avoided. So plan your trades accordingly and keep watching everyone.

NIFTY rejected exactly as analysed!!As we can see NIFTY can be seen rejected before reaching our level but it was the gap which was mentioned in our analysis and it did get rejected exactly from our given levels hence as long as a 25750 is broken and sustained above every rise can be sold so plan your trades accordingly and keep wathcing everyone.
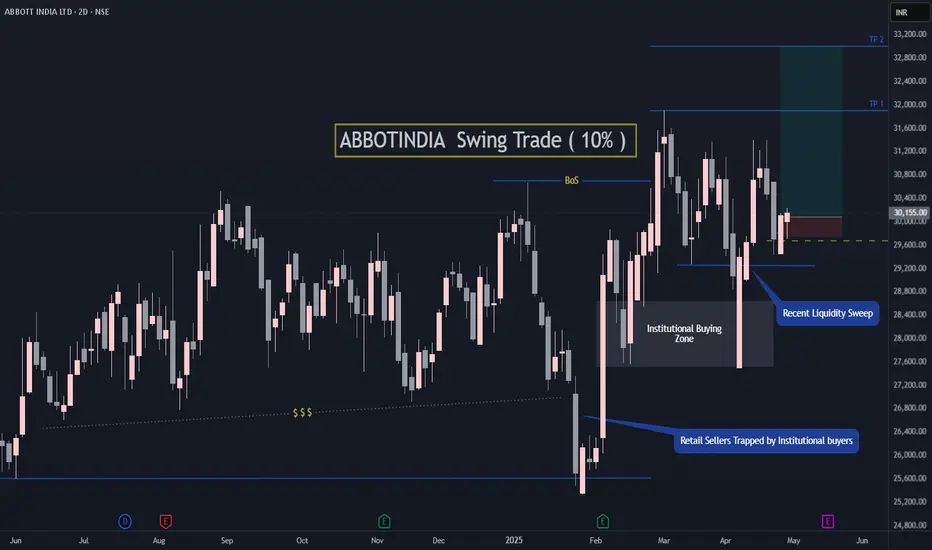
ABBOTINDIA Swing Trade ( 10% upside potential) Abbott India is near to the previous Institutional Buying zone and has upside potential of 10%.
Simple Demand Zone buying setup.
Don't keep hard stop loss. Manage positions as per situation.
Follow for more such setups.
I have been very busy lately because of renovation at home. Will be sharing more setups soon. Thanks.
SBI Ready for 10% Upside in Short termOn Monthly TF
Taken Support At Lower Parallel Channel 20MEMA
On Weekly TF
Inverted HNS Breakout and Retest Completed at 100 WEMA And trading above 20 and 50 WEMA
Above 810 Shorts may start Covering
Trade Activates above 810
SL below 775
Targeting 890
R:R = 2.5
Downside To Trade Idea: Trendline Breakout Pending

NIFTY heading towards strong supply zone!as we can see NIFTY is heading towards 25750 levels which is both a strong supply zone and also psychological level hence NIFTY can extend upto this level before finally getting rejected at following level hence any signs of REJECTION around this zone can make fresh entries for short so planj your trades accordingly and keep watching everyone.

Nifty ready to Test All Time High at 26100-200After weeks of consolidation Nifty has given a Strong Breakout with Comfortable Weekly Close above
0.78 Fib Retracement
In days to come Nifty could test 26000 Level again.
It will be interesting to see price action at 26000
Time being buy dips to 26000
Rest for the Next
Rationale
Taken Support at 0.23 Fib retracement and 20 MEMA

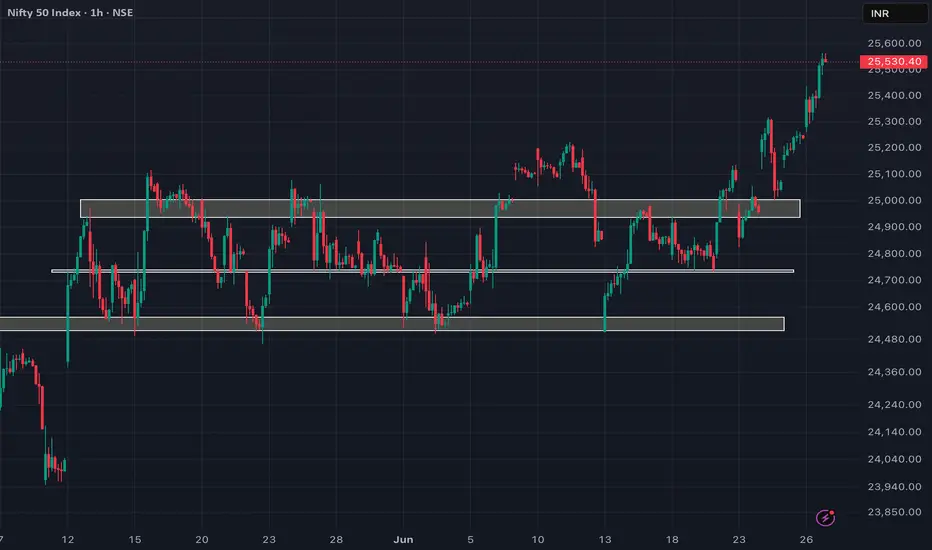
25500 is here!! Where are we heading next..?NIFTY is moving upwards as expected and analyzed, now reaching the 25,500 level. There’s potential for further upmove toward 25,700–25,800, where an existing gap may act as resistance. Enjoy the rally but watch for signs of rejection around these levels—modify your positions accordingly.
And the RALLY continues..As we can see NIFTY has shown substancial upmove after maintining itself anove the demand zone as analysed in our previous post. Now that we are maintaining ourselves above the demand zone, more of nupmove is expected if NIFTY sustains itself above 22400 levels so plan your trades accordingly and keep watching everyone.

NIFTY TAKING SUPPORT at new DEMAND zone!!?As we can NIFTY Seems to finally break by opening gap up but failed to sustain at higher level and closed around the supply zone turned demand zone hence now as long as this supply zone turned demand zone is not breached and sustained below every dip can be bought and carry forward so plan your trades accordingly and keep watching everyone.
9 SMS + Market Structure + HTF 🔥 A Simple Strategy That Works: 9 SMA + Market Structure:
Over the last 18 years in the markets, I’ve noticed one common pattern among struggling traders—they jump from strategy to strategy, get caught up in countless indicators, and lose sight of the basics. The truth is, simplicity wins. And the most powerful tool you can master?
👉 Market Structure.
✅ Market Structure 101:
Uptrend: Higher Highs (HH) + Higher Lows (HL)
Downtrend: Lower Highs (LH) + Lower Lows (LL)
Sideways: Ranging or consolidating zones
Once you understand this, trading becomes more visual and logical. And to complement this understanding, I recommend one tool that works across all timeframes:
🔄 The 9 SMA Strategy (Simple Moving Average)
This is not a magic trick—it’s a clean, effective way to stay in sync with the trend. When used with multiple timeframes (Monthly, Weekly, Daily), it becomes a strong confirmation tool.
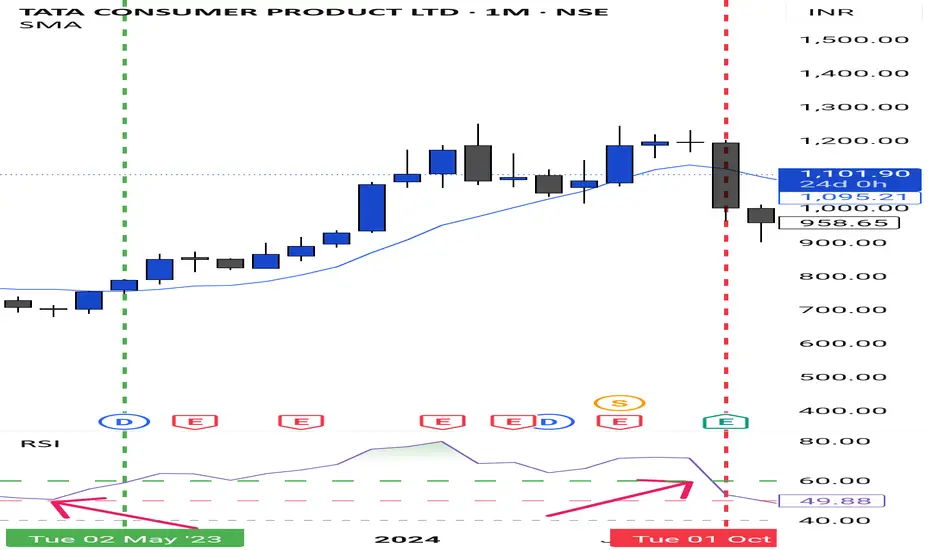
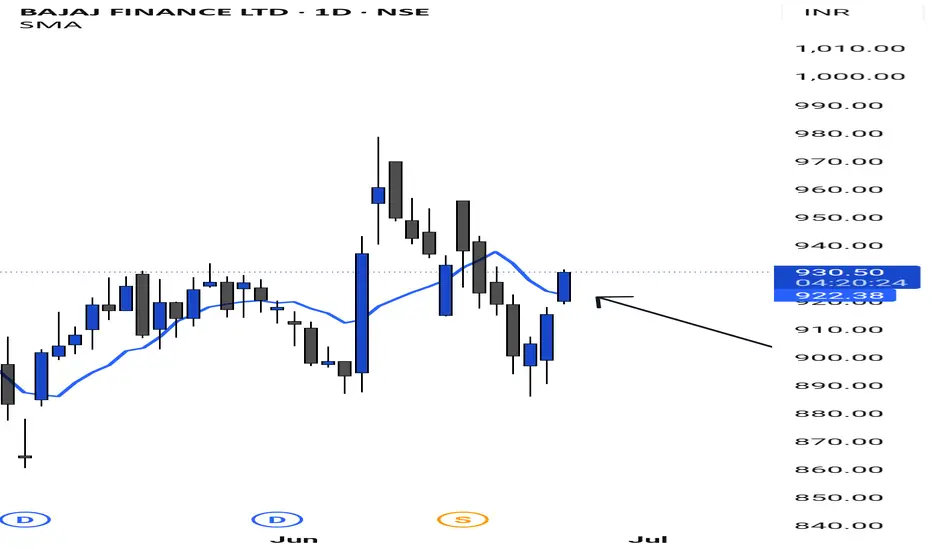
Let’s take Tata Motors as an example:
📈 Monthly Chart:
Trading above the 9 SMA
Near psychological level ₹1000
Had a rally 3–4 months ago, now consolidating
Not a confirmed breakdown yet – monthly is still holding structure
📊 Weekly Chart:
Just crossing above 9 SMA
Indicates strength building back up
📉 Daily Chart:
Also crossing 9 SMA
Shows possible trend continuation
✅ Double confirmation from Daily + Weekly
➡️ This signals potential swing or positional trade setup
🎯 Key Takeaways:
Follow the Market Structure
Understand HH-HL or LH-LL formations before jumping into trades.
Use the 9 SMA on multiple timeframes
Let smaller timeframes guide the early signs of trend shifts
Avoid complexity
Stick to one simple method and master it.
Risk Management
Never invest all at once.
If you have ₹1,00,000, break it into 4 or 5 parts.
This reduces emotional pressure and helps you stay objective.
📌 Final Thoughts:
Swing and positional trading doesn’t have to be overwhelming. Keep your tools simple, your analysis structured, and your emotions in check.
I have also curated a list of 50 highly liquid F&O stocks based on beta, volatility, volume, and liquidity. If you'd like access to that list, just drop a comment or message, and I’ll be happy to share it with you.
Keep it simple. Stay consistent.
The market rewards discipline, not complexity.
REJECTION STARTED?As we can see NIFTY has started showing signs of rejection exactly from our given supply zone. Now that it has closed around the supply zone, we can expect it to reject for more upcoming days before finally breaking out and move directionally so plan your trades accordingly and keeep watching
Sonata Software - Bullish OpportunityWe have a bullish opportunity for Sonata Software - positional long:
- Trend seems to be upwards on Monthly and Weekly TFs
- On 1 Day TF, we have price reacting upwards from nearest 1-D Demand Zone
- As per Elliott Wave model, price is forming bullish impulse wave upwards as shown in the chart. Currently, it seems to be forming a good solid 3rd Wave upwards on 1-D TF
- Entry can be done at 620-625ish and Targets can be 650, 688, 700 for immediate swings. If the momentum carries forward, we will revisit for exact target of when 3rd wave completes later.

EXACT REVERSAL from our DEMAND ZONE!As we can see despite the doubt we were having of market being uncertain and possibility of not following our demand zone, it followed despite the weak closing and showed strong REVERSAL of over 1 percent upmove. Hence as long as we are above our demand zone, every deip can be a buying opportunity, Further we can see it has also broken the bove supply zone but we cn expect some rejection from here despite the break. It is better for NIFTY to sustain at current levels making the supply zone weaker which can lead to a bigger unidirectional upmove. So, plan your trades accordingly and keep watching everyone.
THINGS doesnt looks RIGHT!Despite rejecting from strong demand zone, it couldnt continue its upmove, further it closed around the weak demand zone. it seems like the war is going to worsen with involvement of US which would further bring in RUSSIA and CHINA forming an ALLIANCE. Hence any fresh positions from here should be abstained as any flat opening can lead to strong unidirectional so plan your trades cautiously with strict SL and keep watching everyone.
IN our RANGE!! AS EXPECTEDAs we can see NIFTY has been respecting our levels for quite some time now. today despite its strong opening, it got rejected from our supply zone and managed to close around our demand zone and hence any flat opening with signs of rejection can show substancial upmove in NIFTY. Further multiple touches is making NIFTY's demand and supply zones weaker which can result in stronger breakout and unidirectional move so plan your trades accordingly and keep watching these important levels.
