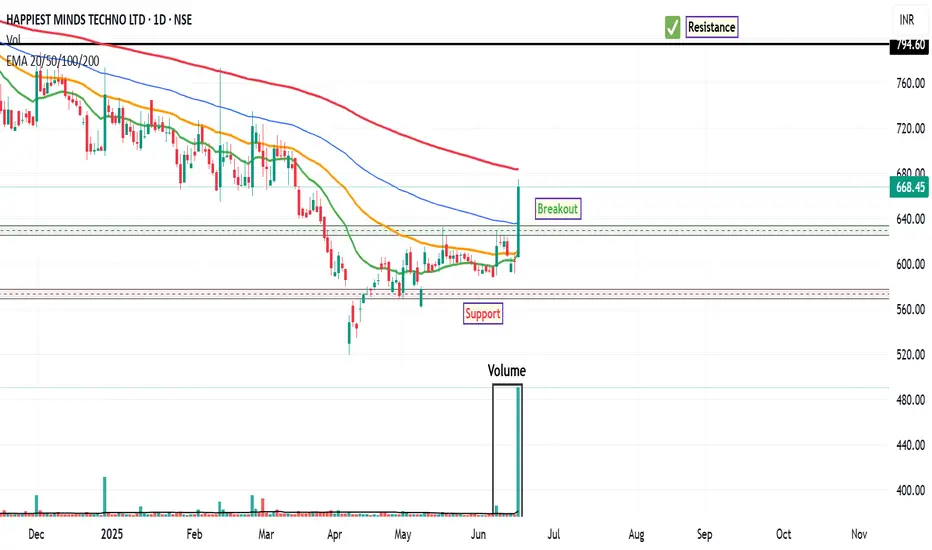
HAPPSTMND: Analysing the Bullish BreakoutHappiest Minds Technologies ( HAPPSTMND ) has recently exhibited a significant shift in market dynamics, marking a potential end to its prolonged downtrend that commenced in July 2024 . In a recent trading session, the stock registered an impressive 11% gain in single trading session signaling a resurgence of buyer interest.
This notable price appreciation was accompanied by a substantial surge in trading volume, with approximately 25M shares changing hands. This volume figure represents nearly 15 times the 20 MA volume, indicating a robust influx of buying conviction and significant market participation behind the upward move. Such a volumetric anomaly often provides strong confirmation for price breakouts or reversals.
From a momentum perspective, the technical indicators are also aligning to support a more constructive outlook. The MACD indicator on the weekly timeframe executed a bullish crossover several weeks ago, a development that typically precedes or accompanies long-term upward trends. Furthermore, the RSI has now advanced to the 54 level . While not yet in overbought territory, this move above the 50-mark suggests increasing bullish momentum and a healthy strengthening of the trend. This confluence of weekly MACD signals and improving daily RSI readings points towards a potentially strong long-term bullish movement.
Considering these technical observations, the stock may face a significant long-term resistance level around ₹794 . This level could present a crucial test for the prevailing bullish momentum, where a sustained breakout might pave the way for further upside. Conversely, for risk management purposes, traders may identify a suggested stop-loss zone and a breakout zone as illustrated on the accompanying chart, which would serve as key areas to monitor for potential shifts in price action or to define risk parameters.
Disclaimer: The information provided in this technical analysis is for informational and educational purposes only and should not be construed as financial advice. It is based on observations from historical price and volume data, and commonly used technical indicators. Market conditions can change rapidly, and past performance is not indicative of future results. All trading and investment decisions involve inherent risks, and losses can exceed initial investments. Always conduct your own comprehensive due diligence and consult with a qualified financial advisor before making any investment decisions.
Multiple Time Frame Analysis
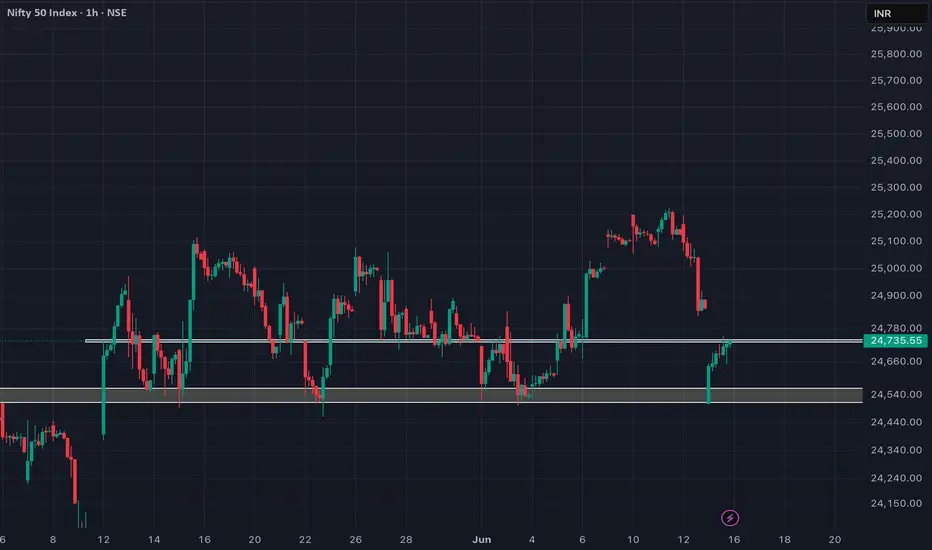
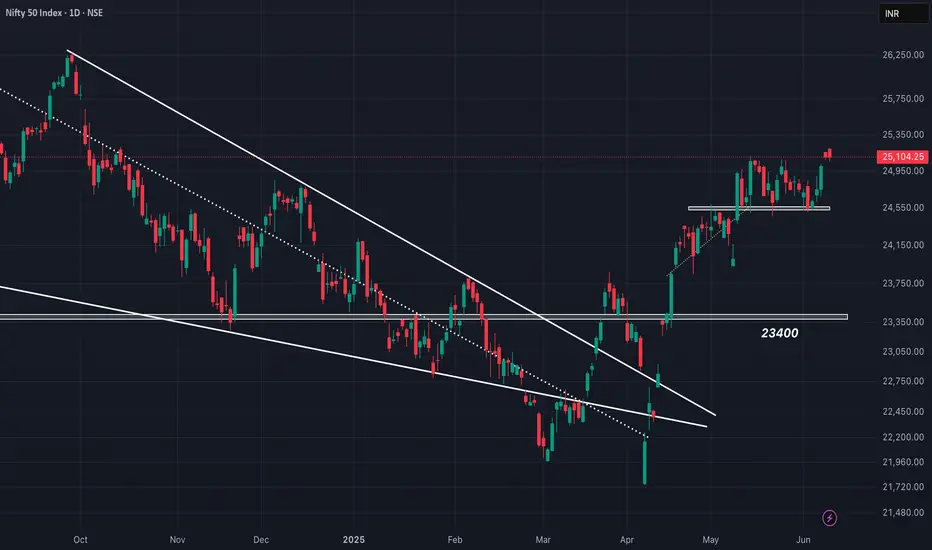
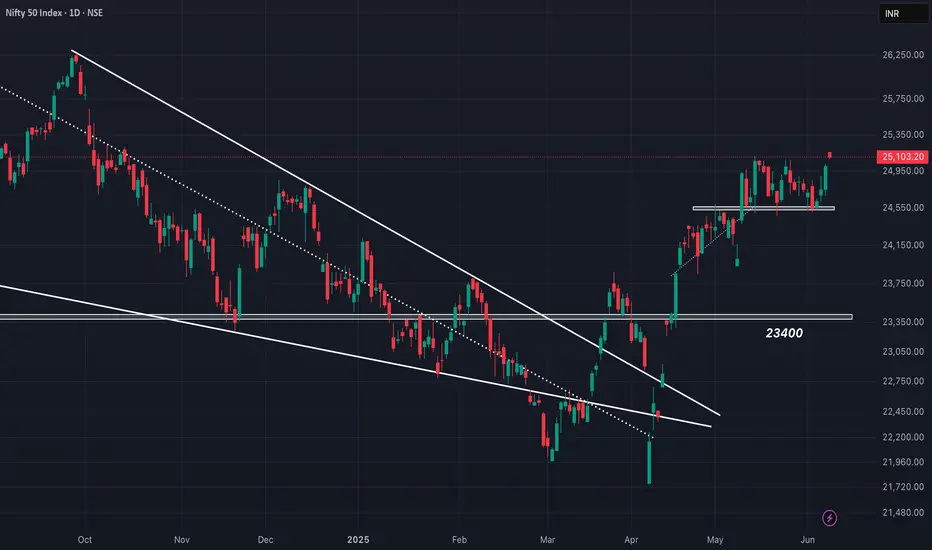
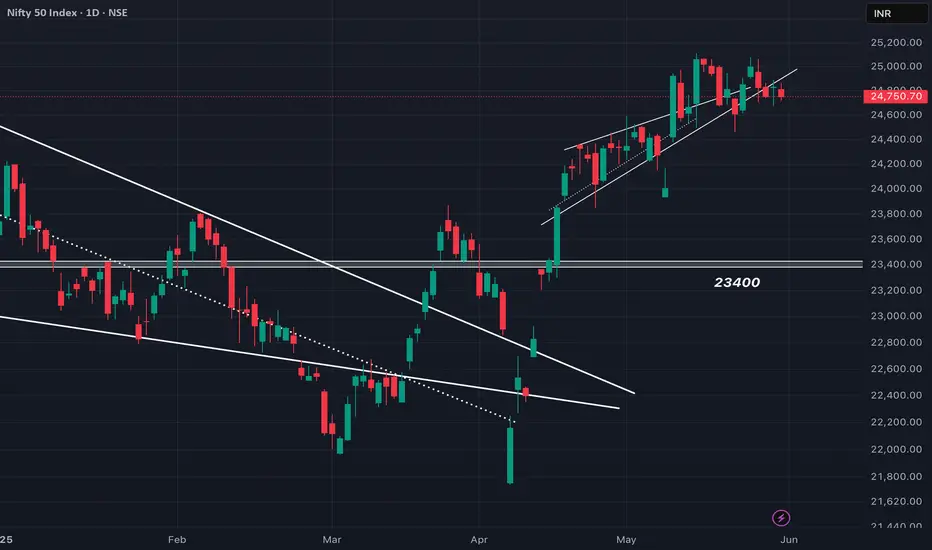
Exact REJECTION from our SUPPLY ZONE!!As we can see NIFTY rejected from our supply zone and is expected to remain sluggish between these zones so unless NIFTY breaks either side and sustains, it shouldnt be traded as it can be immensely volatile so plan your trades accordingly and keep watching.

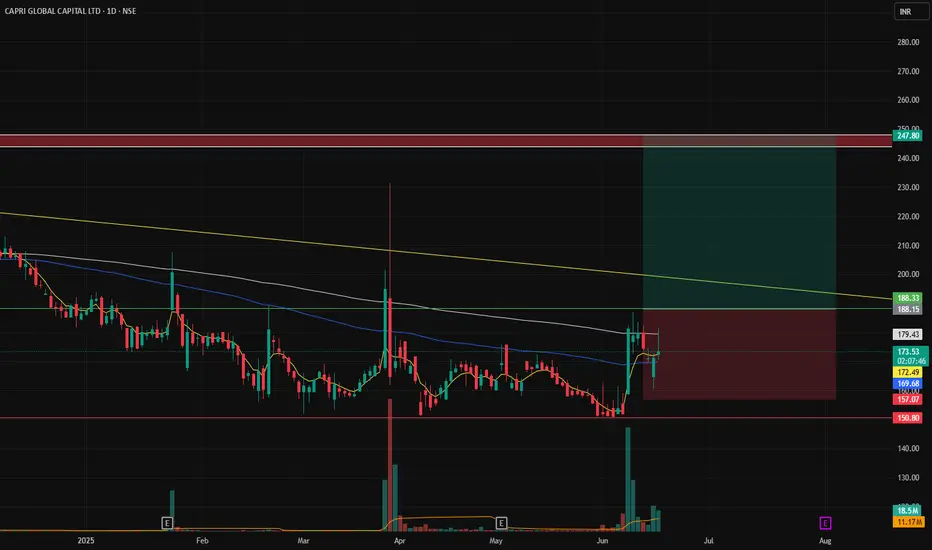
CAPRI GLOBAL Please consult your financial advisor before investing.This is only for learning purpose of chart.
We are NISM certified EQ and MCX trader but not SEBI register investment advisor...
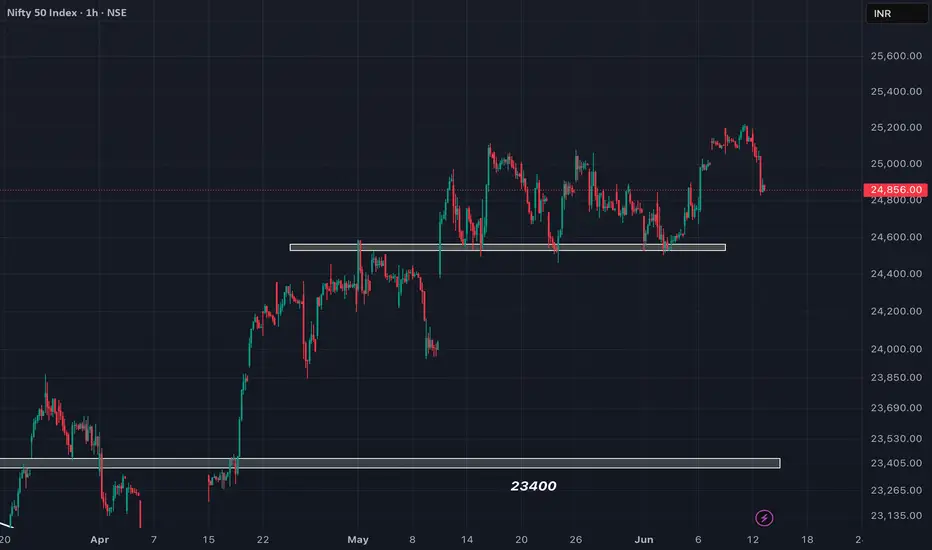
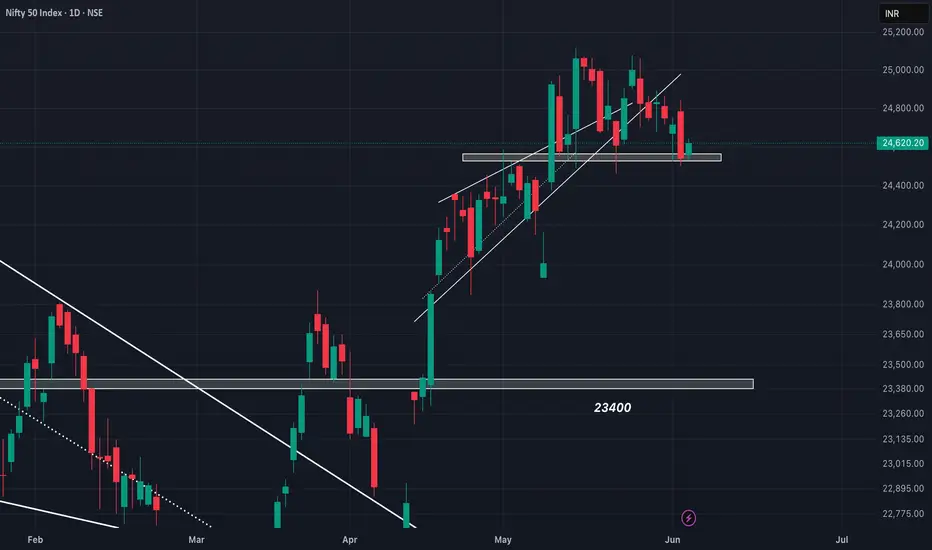
25000 !! is here! expecting retracement from here!!?as we can see NIFTY is approaching 25000 level which both a psychological level and important supply zone hence we can expect some retracement from here till it finally breaks out towards its new all time high so plan your trades accordingly and keep watching.

NIFTY REVERSED exactly from our given demand zone!As we can see NIFTY has recovered strongly exactly from our demand zone and has closed at very crucial zone which previously acted as a demand zone, can now act as a supply zone hence unless NIFTY breaks either side of the consolidation, it can remain sluggish to negative so plan your trades accordingly and keep watching.
DIRECTIONAL MOVE!! but not as PLANNED!!Though we expected a directional move on break of either side of the indecision candle, but couldnt yet make use of the move as we were waiting for NIFTY to break above. The move is more of a influence fall caused by a havoc due to sudden crash of boeing plane that led to loss of multiple lives, may their soul rest. OM SHANTI. Please GOD give their family strength to face and bear the pain and hope they are in better place now, a place without suffering!
25200!! is yett to be broken!As we can see NIFTY remained sideways another day showing indecision but we got a level to look out for , for confirmation of breakout. Since it has formed doji kinda candle, its high and low is marked important and since we are on bullish side, we would focus on its newly made high of that doji candle which is 25200 hence any closing above 25200 can be unidirectional move so keep watching everyone.

NIFTY still in structure! READY to BREAK!As we can see NIFTY remained sideways another day after showing strong upmove but still looks strong and in pattern. Now that it has managed to sustain itself above 25000 levels, we can expect a directional upmove above 25200 levels so plan your trades accordingly and keep wathching these important levels.
KOTAK BANK - targets 2200 plusKOTAK MAHINDRA BANK - price is 1865
Kotak mahindra bank ,the biggest and unique in its way of working now may act as a proxy to Bank Nifty for playing for upside gains.
1850 levels are very strong supports on monthly and weekly time frames.
these would act as pivots for buying for 2050 and 2200 levels since Bank Nifty is trading at all time highs, also HDFC, ICICI, AXIS all big pvt banks are trading at all time highs.
so buying should be initiated at 1850 for the targets of 2200.
also this stock may safeguard the capital invested in times of declines in the NIFTY - BANK NIFTY and the markets in general.
thanks

NIFTY preparing itself for a bigger move!As we can see after a trending move, NIFTY remained sideways throughout the day hitting SL both sides but since it is sustaining itself above 25000 levels hence a strong upmove can be expected anytime sooner followed by the bullish structure and pattern which can add fuel to the fire, so keep watching everyone
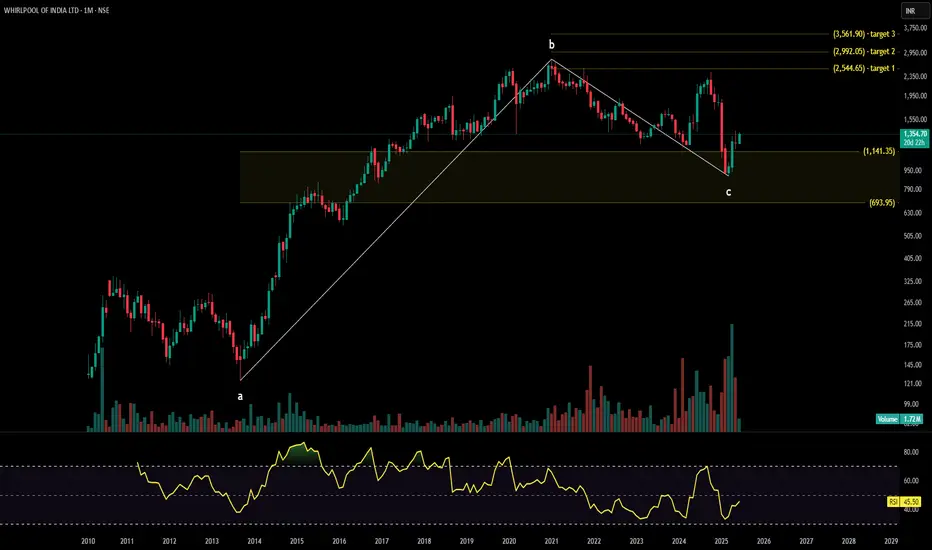
WHIRLPOOL technical analysisWhirlpool of India Ltd. (NSE: WHIRLPOOL) is currently trading at INR 1,354.70, reflecting a 9.61% increase. The company is a major player in the home appliances sector, specializing in refrigerators, washing machines, microwaves, and air conditioners, with a strong market presence across India.
Key Levels
Support Levels: INR 693.95, INR 1,141.35, INR 1,344.55
Swing Level: INR 1,620.20
Possible Upside Levels: INR 2,544.65, INR 2,992.05, INR 3,561.90
Technical Indicators
RSI: The Relative Strength Index (RSI) is at 45.50, indicating neutral momentum. The stock is neither overbought nor oversold, suggesting potential consolidation or a gradual price move.
Volume: Trading volume is 1.72M, showing steady investor interest. Higher volume near key resistance levels could confirm price movement strength.
Sector and Market Context
Whirlpool of India operates in the consumer electronics and home appliances sector, which has witnessed moderate demand growth, driven by urbanization, rising disposable incomes, and expanding e-commerce sales. However, inflationary pressures, competition from domestic and global brands, and raw material price fluctuations can affect profitability. Investors are watching market trends in premium appliances and sustainable technologies, which could shape long-term growth.
Latest News and Developments
Market Trends: Increased demand for energy-efficient home appliances, supporting long-term product innovation.
Analyst Ratings: Some analysts maintain a neutral stance, citing stable earnings but cautioning on competitive challenges.
Quarterly Results: Whirlpool India posted stable revenue growth, although input costs affected margins slightly.
Dividend Update: Whirlpool of India Ltd. has announced a dividend payout of ₹7 per share, reinforcing its commitment to shareholder returns.
Analysis Summary
Whirlpool of India Ltd. presents a neutral technical setup, with RSI indicating steady positioning and volume trends reflecting investor engagement. The stock benefits from sector tailwinds, driven by rising demand for home appliances and premium product innovations, though macroeconomic factors and competitive pricing strategies should be monitored. Investors should track price action near swing levels, industry-wide shifts, and upcoming earnings disclosures before making strategic decisions.
Another DIRECTIONAL upmove incoming!!!?As we can see, despite forming negative bias NIFTY regained its original shape and got back to its original direction i.e UPTREND. Needless to say, we always had been on the right direction since the beginning and bought every dip with logic. NOw it can be seen forming flag-pole pattern which is also a bullish continuation pattern hence as long as NIFTY maintains itself above 25000, a sharp upmove can be expected so plan your trades accordingly and keep watching.

Well anticipated move!As we can see despite the bearishness, NIFTY showed immense strength as expected and analysed in our previous posts. We had been adamant to our levels and hence every dip was our buying opportunity and also told u guys to make fresh entries for better risk to reward. Now we will stick to our analysis and will keep on buying the dip unless 24400 is broken and sustained below for ATH target.

YET to BREAK! wait for confirmation!As we can NIFTY couldnt break below the strcuture and remained sideways hence unless the zone is broken below every dip can be bought so plan your trades accordingly and keep watching everyone
24400 is still protected!!As we can see despite the breakdown and weak opening, we saw huge recovery as our demand zone is still protected and hence we can stand by our analysis of buying the dip, this could be another great entry for great risk to reward so plan your trades accordingly.

XAUUSD | Technical Analysis 3rd June 2025Hi,
I am sharing my view on gold further movement.
Disclaimer: This is only for educational purpose.
Thanks

XAUUSD | Intraday Technical Analysis 2nd June 2025Hi,
Gold can go upto 3351 and 3400 on traday basis.
Disclaimer: This is only for educational purpose.
Thanks

GDP and GST collection above estimates! adding fuel to the fire!As we can see despite a weak closing, massive gst collection and GDP which has surpassed its estimates can give thrust to the market for new highs. Also, our demand zone is still protected which can act as a catalyst to fuel the fire so plan your trades accordingly and keep watching everyone.
XAUUSD Technical Analysis | Week 2nd - 7th JuneHi,
I am sharing my view on gold for week 2nd to 7th June.
Disclaimer: This is only for education purpose.
Thanks

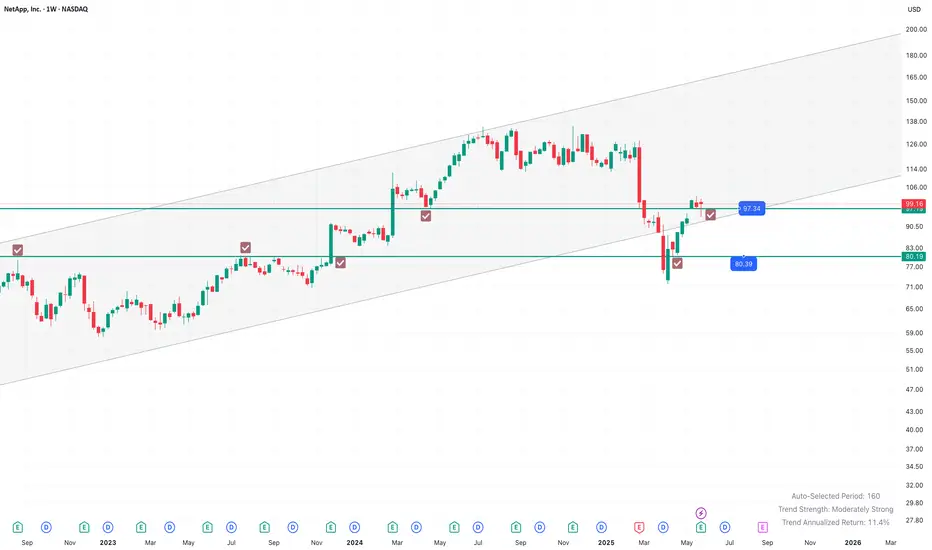
NetApp Inc shows bullish candlestick in larger timeframeNASDAQ:NTAP price action shows bullish candlestick pattern in the Monthly Chart. As well as in Weekly chart, it shows steady rejection and showing a sideways consolidating trend.
Lets analyze first weekly timeframe:
We can see during April'25 (Tariff Trauma weeks) the price made a low of $74, breaching down the $80 mark.
But within one week it again regains back the strong, historical demand zone of $80 and continue it's upsurge towards $100. It made a recent weekly high of $102.
Last 3 weeks was a consolidating around $97 to $100 level, keep on honouring the support of $97.
Last week, during timid FY24-25 Q4 earnings, we can see it falls back to $94. And seen a rejection there during last trading session of Friday, 05/30 and close the week with a Dragronfly dozi candlestick pattern (albeit the body color is red). Still the bottom rejection wick and holding back $97 is a sign of 'don't give up so easily'.
Whereas in monthly timeframe, it shows absolute bullishness:
The April month candle was a book-perfect Dragronfly doji.
This May month candle is a super bullish (sort of) Marubozu candle, even the low is above the last monthly close.
It's indicates a confirmative bullishness in monthly
Verdict:
This NASDAQ:NTAP counter is expected to be sideways-to-bullish in coming weeks.
Immediate Support levels are: $97, $89 (200 WSMA), $80.
There is no reason of it getting close below $80. That's becomes the new normal Low of the counter.
It's going through a typical consolidation and distribution phase for gathering new energy to resume it's upmoving in coming medium terms.
Stay Invested or Keep on accumulating , specially on every dips.
Strong REVERSAL in closing hours!! more to come!As we can see despite the bearishness, NIFTY managed to recover strongly based on our analysis. we can stand by our analysis and keep buying the dip till our demand zone is well taken care of. so, plan your trades accordingly and keep watching everyone.

NIFTY forming Head and Shoulders pattern..?As we can see NIFTY remained sideways throughout the day but our demand zone is still protected hence as long as we are above 24400, every dip can be bought. on the other hand, it can be seen forming head and shoulders patttern in bigger time frame which is a reversal structure but its neckline can be assumed around our given demand zone hence we should stay by our analysis until and unless 24400 is broken below and sustained so plan your trades accordingly and keep watching.

Another chance for ENTRY..?As we can see NIFTY fell unidirectionally with immense volatility which was completely unexpected but this could be an another great entry for those who has yet not entered as it is still in structure showing signs of bullishness. Hence keeping SL below 24400 closing basis for new ATH can be the desired risk to reward in thr following trade so plan your trades accordingly and keep watching.
