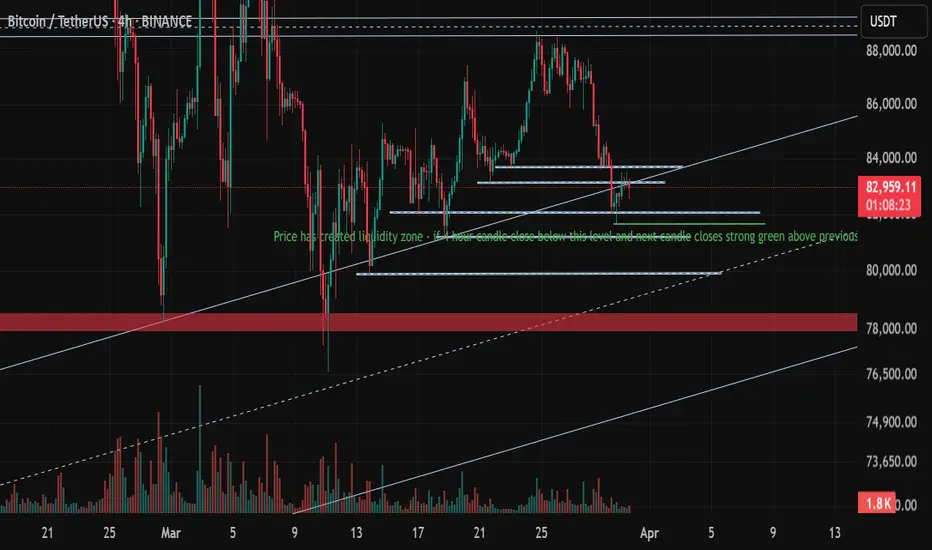
BTC for long on 4 hour - if condition metHere's the analysis of chart:
Bitcoin (BTC/USDT) 4-Hour Chart Analysis
1. Price Action & Trend
o The price is currently at $82,823.27, showing a minor decline of -0.35%.
2. Liquidity Zone & Key Support Levels
o A liquidity zone has been identified, as mentioned in the chart text.
Buying Condition - If a 4-hour candle closes below this level and the next candle forms a strong bullish reversal, it may signal a buying opportunity.
o The near support $81,000 is a significant support area, aligning with the major trendline support.
3. Volume & Market Strength
o Volume is relatively low, which suggests that current price movements might lack strong momentum.
o A volume increase near support or resistance levels could indicate a decisive move.
Trading Outlook
• Bullish Scenario: If BTC holds above the liquidity zone and prints a strong green candle, it could move higher towards $84,000 - $86,000 - $90,000
• Bearish Scenario: A breakdown below liquidity support could lead BTC to test the $78,000 region before finding strong demand.
Follow me for more such ideas.
This analysis is for educational purposes only and should not be considered financial advice. Trading involves significant risk, and past performance does not guarantee future results.
Disclaimer - Before entering any trade, ensure that all criteria and conditions outlined in the analysis are met. Always use a stop-loss to protect your capital and apply proper risk management strategies. Trade responsibly and at your own discretion.
Multiple Time Frame Analysis
Waiting for bullish moveHere is the detailed analysis for a bullish trade setup on USD/JPY (4H timeframe):
Key Observations:
1. Resistance Zone (151.000-152.000)
- The price has rejected this level three times (as marked in red).
- This suggests strong resistance, and a breakout would indicate a strong bullish move.
2. Ascending Trendline Support
- The price has bounced off the trendline five times (marked in blue).
- However, a breakdown of this trendline could signal bearish movement.
3. Fibonacci Retracement (0.5 - 0.618 Level)
- The retracement zone aligns with a previous resistance level, now acting as support .
- This increases the probability of a bullish reversal.
4. Entry Confirmation Criteria:
- Wait for a strong green 4-hour candle with high volume near the 149.000 - 149.500 support area.
- If price respects the Fibonacci level and forms a bullish engulfing or strong pin bar, it confirms bullish momentum.
Trade Plan for Bullish Entry:
- Entry: Around 149.000 - 149.500 , once a bullish confirmation candle forms.
- Stop Loss (SL): Below 148.500 (below Fibonacci 0.618 level & previous structure).
- Take Profit (TP):
- TP1: 150.500 (near the trendline break level).
- TP2: 151.500 - 152.000 (major resistance zone).
Risk Management:
- Risk-reward ratio should be at least 1:2 .
- If price breaks below 148.500 , reconsider the bullish bias.
Conclusion:
- The setup favors a bullish trade only if a strong reversal candle appears at the Fibonacci & support zone.
- A breakout above 151.500 - 152.000 could trigger a bigger bullish rally.
Follow me for more ideas :)

PIRAMAL PHARMAStock Overview: Piramal Pharma, NSE, current price: ₹226.72. Piramal Pharma is a pharmaceutical company involved in the development, manufacturing, and distribution of pharmaceutical products.
Key Levels:
Support (yellow zone): ₹155.77
Swing zone (green zone): ₹188.29 to ₹229.93
Technical Indicators:
RSI (Relative Strength Index): The RSI is currently at 52.54, indicating a neutral momentum as it is near the midpoint of the scale (50).
Volume: The volume is 55.27M, showing significant trading activity which can indicate investor interest and potential volatility.
MA (Moving Average): The SMA (Simple Moving Average) is at ₹203.91, suggesting that the stock is trading above its long-term average, which can be a bullish signal.
Sector and Market Context: Piramal Pharma's performance should be analyzed in the context of the pharmaceutical sector, which has been experiencing growth due to increased demand for healthcare products. The overall market trends show a mixed sentiment with some sectors performing better than others.
Risk Considerations: Potential risks include regulatory changes, market competition, and global economic conditions that could impact the pharmaceutical industry. Additionally, any adverse events related to drug approvals or recalls could influence the stock's movement.
Analysis Summary: Piramal Pharma shows potential for growth with key target levels identified. The stock is currently trading above its moving average, and the RSI indicates neutral momentum. Investors should consider sector performance and market conditions, along with potential risks, before making any investment decisions.

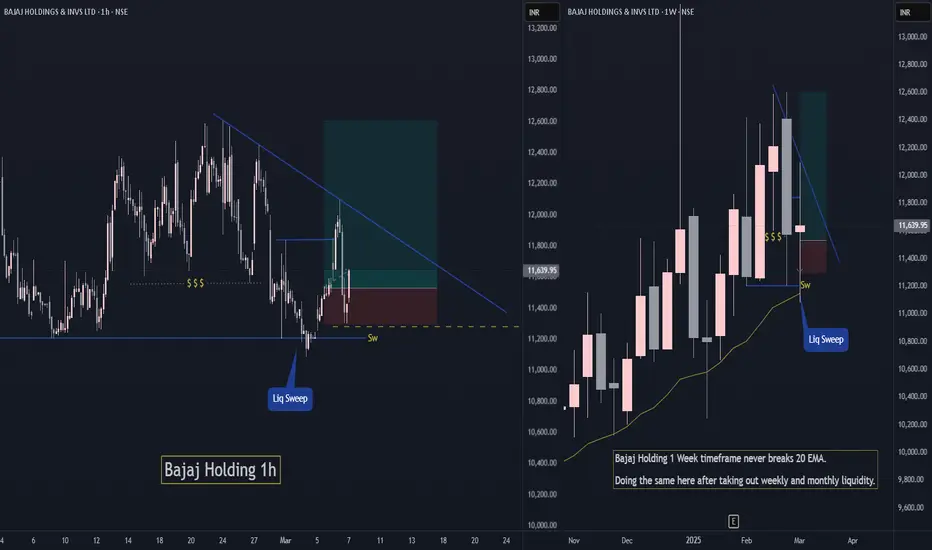
Bajaj Holding Short Term Swing TradeBajaj holding has grabbed monthly and weekly liquidity while maintaining is uptrend.
If Nifty holds current levels ie. above 22400 then Bajaj Holding has high chances to move up and continue its trend.
Do like or follow for more Trading ideas like these. You can comment your views on this analysis.
GUJARAT FLUOROCHEM Swing TradeOn weekly time frame, a liquidity pool was formed and sellers got trapped two times in GUJARAT FLUOROCHEM forming a double bottom, which can fuel a good potential up move.
Also it has recently grabbed liquidity from previous day low so if Nifty holds above 23400 then there are good chances of GUJARAT FLUOROCHEM to reach T1 which will be a 1:4 RR trade.

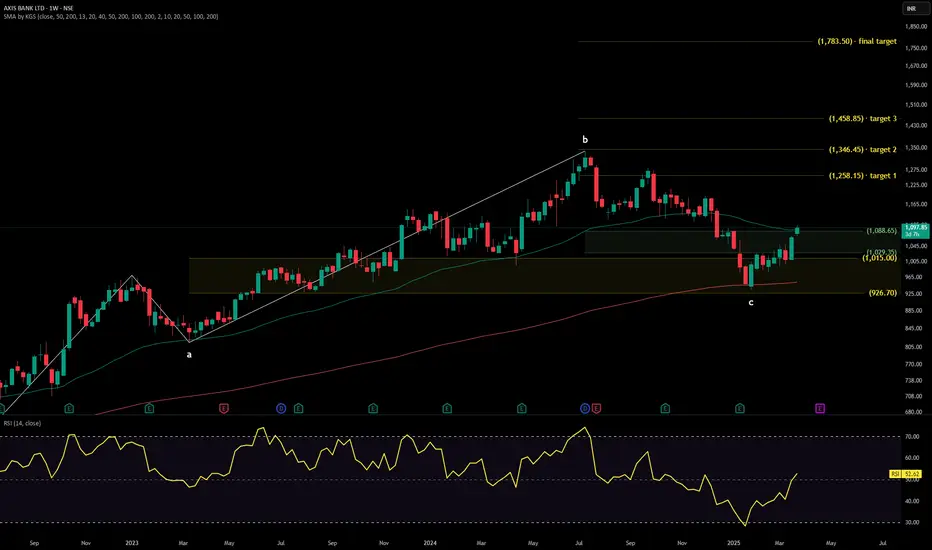
AXIS BANKTechnical Analysis Report
Stock Overview: Axis Bank Ltd - NSE - Current Price: ₹1,097.85. Axis Bank Ltd is a prominent private sector bank in India, offering a wide range of financial services, including retail banking, corporate banking, and treasury operations.
Key Levels:
Support (Yellow Zone): ₹926.70 - ₹952.52
Swing Zone (Green Zone): ₹1,015.00 - ₹1,091.53
Technical Indicators:
RSI (Relative Strength Index): The RSI value is 52.62, indicating neutral momentum as it is close to the midpoint of 50.
Volume: The trading volume is 8.28M, reflecting moderate investor interest. Higher volume often signals stronger price movements.
MA (Moving Average): The stock is trading above its 50-day moving average (₹1,091.53) but below its 200-day moving average (₹952.52), suggesting a mixed trend.
Sector and Market Context: Axis Bank operates in the financial sector, which has been experiencing fluctuations due to economic conditions, interest rate changes, and regulatory policies. While the overall market shows signs of recovery, uncertainties persist, impacting the banking sector's performance.
Risk Considerations: Potential risks include changes in interest rates, regulatory shifts, economic downturns, and geopolitical events. These factors could influence the stock's movement and overall market sentiment.
Analysis Summary: Axis Bank Ltd presents a mixed technical outlook with identified support and resistance levels. The RSI indicates neutral momentum, and the volume suggests moderate investor interest. Moving averages provide a mixed trend signal. Investors should carefully consider sector and market conditions, along with potential risks, before making investment decisions.
23400 broken but 24000 is yet to be broken for confirmation !!As we can see NIFTY broke out of 23400 breaking all our expectation as we expected it to start retracement from this zone itself but showed unidirectional rally. now that it has rallied so much, we can see it heading towards another psychological level of 24000 which can act as a resistance so plan your trades accordingly and keep watching.

Abbott India Swing TradeOn weekly time frame, sellers are trapped badly in Abbott India which can fuel a good potential up move. Also it has recently grabbed liquidity from previous week low so if Nifty holds above 23000 then there are high chances of Abbott to reach T1 and T2 which will be a 1:5 RR trade.

Bajaj Finance to 14K?Bajaj Finance (NSE: BAJFINANCE) has been trading at ATH levels; after multiple rejections at 8000 levels, it closed above these levels for the first time. On the weekly timeframe, it has formed a flag and pole pattern, which suggests it can reach 14000 levels.

TIME to get CAUTIOUS!! Save your MONEY !!As we can see despite the trendline break and strong reversal, we can see it trading around important SUPPLY zone which is around 23400-23500 levels which is also a psychological level hence any signs of reversal round these zones could show massive unidirectional fall the very same way it recovered so, unless NIFTY sustains itself above 23400-23500 levels no new long position should be made strictly and existing longs and can booked partially so nullify your losses in case if goes against your plan so plan your trades accordingly and keep watching everyone cautiously.

Kalyani Steels trendline breakout - D timeframeKalyani Steels after achieving the target of 1179.50 exited parallel channel and held support at 700 range. Bullish reversal happened at 704.20 (mar 3) and bullish reversal confirmation at 721 (mar 17). Dec 17 '24 ATH to Mar 3 '25 precisely 44.86% fall as anticipated. Now price chart in daily timeframe showing double bottom with inverted hammer (Mar 19) along with RSI double bottom breakout. Weekly chart piercing line (i think) candlestick pattern along with RSI +ve divergence.

XAG/USD View For Weekend Analysis .Simmply we see the price in 4 H is bullish . If 1H candle close above High of Market as seen in chart after that you can plan long .
or If price reach in red box and after given candlestick confirmation on LFT then You can plan sell up to green box . then from green box plan buys

Suven Pharma Swing Trade (Long)Suven Pharma is in Uptrend in Daily TF.
On 2h timeframe, it is in uptrend and has grabbed liquidity from Weekly low and daily low.
If Nifty holds current levels ie 22400, then there are high chances Suven Pharma will touch ATH soon.
The Risk Reward is more than 1:8
Do like and follow for more Trading ideas like this regularly. Comment your views on this analysis.

#SDBLFundamentals:
* ROCE - 19.4%, ROE - 18.4%. Debt to Equity - 0.21
* EPS / Revenue - has been steadily increasing
* FII/FPI have increased holdings from 0.56% to 0.90% in Dec 2024 qtr.
* Institutional Investors have increased holdings from 0.57% to 0.92% in Dec 2024 qtr.
* Promoters have increased holdings from 35.33% to 36.32% in Dec 2024 qtr.
Technicals:
* Bullish Candlestick Patterns - Closing Marubozu Uptrend / Long Line Uptrend
* Weekly Chart shows that 10 WEMA is crossing above the 20 WEMA
* On daily chart, there is a low risk entry available
* Two days of green candles Price is forming a tight action and emerging from a cup formation
* Volumes had declined while consolidating and with up move are now showing signs of increase
* RVOL and ADR is great and spiking
* Relative strength is strong / Momentum indicates steady maintenance / ADR is 5.8% and indicating up move
Good for positional trade. SIP type entry considering that market is pretty crazy as of now.
Note - Entry / SL / Target / Position size - Please figure out on your own based on risk appetite
Disclaimer - Your money requires your due diligence! I merely analyze and bring out probabilities. All the best.

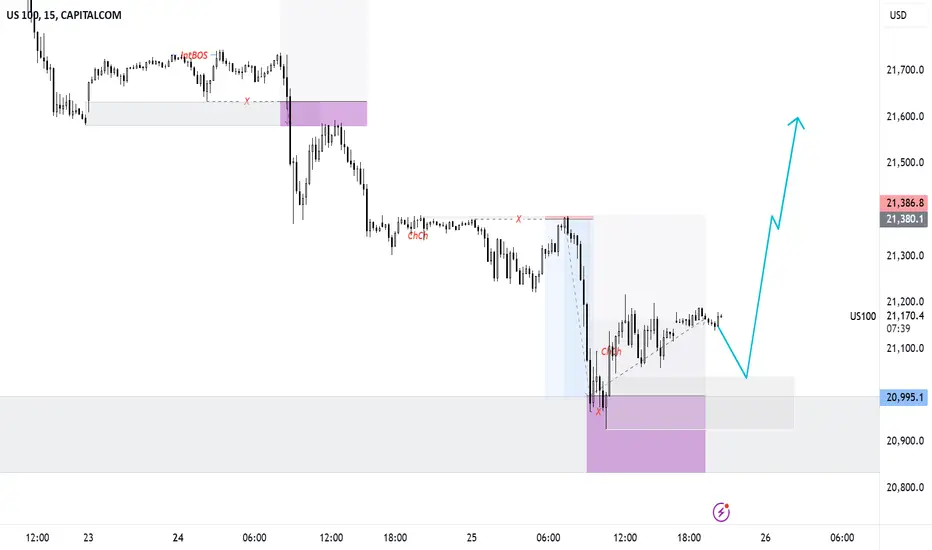
US100 View for feb last weekUS100 is reversing from the demand zone and waiting for the confirmation to enter buy side.
Here is the view for educational purposes
Buy zone is marked between 20926.5 - 21040.8. It will be the high probability area. So, wait for the confirmation before entry.
Trade with 1:3 RR and it might touch all time high again. Trade accordingly.
It might be weak below the marked zone.
Trade after the confirmation.
Hero MotoCorp I Bullish Signals – Time to Invest or Trade?Trade Plan
Enter after strong Breakout of 3,896 levels, Stop loss below entry candle 15m time frame(Not more than (0.5%)
Pro Tip
As we are on a weekly support of the stock and it is taking support from it we could be seeing a trend day where the price consistently moves in one direction throughout the trading session, with minimal price reversals. So to capture the big move You can trail stoploss on previous swing or an EMA of your preference. Eg:10,20
Buy above 3,896.70 ( after close on 15m TF)
Target 1 - 3,950.95
Target 2 - 3,976.15
Target 3 - 4,015.55
Not an Investment Advise

#Nifty 50 Lalagi In Rang Bound? Weekly Wrap #Nifty 50 17/02/25First Step of a successful trader is to build a Trade plan & review what he has done. (education purpose for all )
*Trend is rangbound, Short term Bullish.
*Trade plan: Buy on dip.
*for Critical levels see the video
Jai Hind.
Disclaimer :
This video is only for educational purposes. Please consult your financial advisor before you take any trade.

ONGC : Is oil Going to burn?
Technical View
Box trading strategy in which you identify a stock consolidating for couple of days and trade in the direction of the breakout. In case of ONGC the stock was consolidating for about three days before breaking out earlier today.
PRO TIP
Use the High of the candle as your stop loss and trail it to either protect profits or hold your trade for longer duration.
Target 227 Intra-day Target
Fundamentals
Weak Q3FY25 Results:
ONGC's consolidated net profit attributable to owners declined by 19.4% to ₹8,621.69 crore in Q3 FY25, compared to ₹10,703.13 crore in the same period last year. This drop was attributed to lower global crude prices.
The company reported a 6.9% decrease in net profit for the quarter, standing at ₹9,784 crore, down from ₹10,511 crore in the same period last year.
ONGC's gross revenue also showed a slight decline of 0.7%, falling to ₹1.66 trillion in Q3 FY25, compared to ₹1.67 trillion in Q3 FY241. The company's revenue from operations also saw a decline, reaching ₹166,096.68 crore.
Bearish Trend: The stock is trading below its 5-day, 20-day, 50-day, 100-day, and 200-day moving averages, which indicates a bearish trend in its short to long-term performance.
Brokerage Views:
CLSA has cut its FY25 EPS estimate by 5% due to cautious outlooks on the company's production and profitability
Not an investment advice

EURUSD LONGEurusd coming toward buying zone in 4hr time frame. wait for to enter zone use 15mins confimation for entry

Long in silver from this level. long in silvermic from this level. according to multi time frame anylysis

VBL - Value BUY?The monthly chart shows that the prices are touching the moving average (middle band) if the Bollinger bands for the first time after a 26 bars (monthly) rally. It also touching the RSI level of 60 for the first time from above.
On the WEEKLY chart it can be seen that it has crossed below 50 EMA with average volumes and there is no strong bearish follow up, forming bullish wick candles as it approaches the support level of 520.
On daily chart it is indicating a breakdown reclaim pattern of the low from 08/10/24
With a strict stoploss of 510/480 , we can expect an upwards rally with hurdles being at the levels of - 580 / 620 / 650
CMP - 540


Balrampurchini LONG Balrampurchini is approaching a strong weekly demand zone. There is a daily DZ nested within the weekly level. The confluence is adding an odd enhancer as we are expecting the price to bounce out of the Demand Zone
