Chapter 15 — Confirmation AddictionHow waiting for “more confirmation” creates late entries (and worse trades)
(AVAXUSDT.P — 1H chart reference attached)
Most traders don’t lose because they’re “wrong.”
They lose because they enter after the move has already paid the early participants.
That behavior has a name: Confirmation Addiction.
It sounds responsible (“I’m waiting to be sure”).
In reality, it’s often fear disguised as discipline — and it produces the same outcome again and again:
✅ you feel safe
❌ you enter late
❌ your stop gets wider
❌ your R:R collapses
❌ you get chopped or stopped on the first pullback
What “Confirmation Addiction” looks like on this chart
On your panel, the market is MTF ALIGNED bullish, but not trending cleanly:
H1/H4 Context: Bullish
Daily Context: Neutral
Market Phase: RANGE
ADX ~14.7 (weak trend)
Participation: Weak
Risk Mod: Negative (divergence / internal weakness)
This combination is the perfect trap for late entries:
In a range, price repeatedly does this:
forms a base
pushes up a bit
pulls back and tests
pushes again
then fakes / retests / compresses
A confirmation-addicted trader keeps stacking requirements:
“Let it break the high”
“Wait for candle close”
“Wait for retest”
“Wait for another close”
“Wait for one more push”
By the time all of that happens, you are buying after the best location is gone — usually near the top of the internal range, right before a pullback.
Why “more confirmation” is mathematically worse
Each extra confirmation usually means one of two things:
1) You pay with distance
Your entry moves farther from the invalidation point → your stop must widen → position size shrinks → your upside becomes limited.
2) You pay with timing
The market has already done the displacement. Now you’re entering when mean reversion and pullback probability is highest.
So “more confirmation” often improves emotional comfort but damages:
location
R:R
trade longevity
drawdown tolerance
The real truth
Confirmation is not the edge. Location is the edge.
Confirmation should only answer:
“Is entry permitted here?”
Not: “Can I remove all uncertainty?”
Because uncertainty never disappears — it just gets more expensive.
MARAL Solution: Replace “More Confirmation” with “Entry Permission”
On this chart, you already have the correct framework showing you the truth:
MTF aligned bullish = direction permission exists
Range phase + weak ADX = breakout-chasing is dangerous
Risk mod negative = don’t over-trust pushes; demand clean reaction
Supportive LTF exec = allow precise entries only at good location
So the fix is simple and brutal:
Rule 1 — Define the Earliest Valid Entry (EVE)
Your entry is valid when you have:
HTF permission (aligned bias)
location (discount / range low / protected structure)
reaction (rejection or displacement + micro shift)
Anything beyond that is not “smart.”
It’s often late.
Rule 2 — Use a Two-Step Entry, not a “Perfect Entry”
In range + weak trend environments:
Step A: Probe entry at best location with tight invalidation
Step B: Add only if the move proves itself (structure + continuation)
This keeps you early without being reckless.
Rule 3 — Confirmation should control size, not timing
If you want “extra confirmation,” fine — but don’t delay the entry.
Instead:
Enter with smaller size at EVE
Scale only when the market pays you (acceptance + continuation)
That’s how professionals stay early and controlled.
How to spot Confirmation Addiction in real time (self-audit)
If you catch yourself saying any of these, you’re in it:
“Let me wait for one more candle…”
“I’ll enter after the breakout is confirmed…”
“I missed the first move, I’ll take the next one…” (next one = worst location)
“I need the market to prove it” (translation: I want certainty)
Execution takeaway for this AVAX setup
With MTF bullish but range + weak ADX, your best money is usually made by:
entering at the range base / discount with tight invalidation
not chasing the last confirmation candle near the highs
Trend permission ≠ trend conditions.
That’s why “aligned” can still chop you if you enter late.
A late entry is not a safer entry — it’s a more expensive entry.
Trade uncertainty with rules, not with delay.
(Educational only — not financial advice.)
#Execution #TradingMindset #DayTrading #SwingTrading #CryptoTrading #FuturesTrading #BreakoutTraps #RangeTrading #RRMindset #PositionSizing #TradeManagement #Edge
Multiple Time Frame Analysis

NIFTY might show REVERSAL from here!As we can see NIFTY finally has arrived at the trend line support which was very well anticipated and has been talking about it since its ATH. From its ATH NIFTY fell over 700++ points with proper conviction. Now, we may expect NIFTY to do short covering as this level is both an important support as well as important demand zone. So, one can book their short positions partially and trail their SL. plan your trades accordingly and keep watching everyone.

DMART is now ready to big move After a good result and in chart there is good confirmation to buy in this point and the target are 4000, 4200 with the sl 3700

Chapter 14 — Range Is Not a Trend (Why most losses happen) Why most losses happen when traders trade chop like a trend.
(Chart: BNBUSDT 1H — HTF bullish + score A++… but Liquidity HIGH, Participation NEUTRAL, Risk State OVEREXTENDED, Risk Mode NEGATIVE, DIV NEG, Obstacle Ahead YES, Exit Pressure RISING → “trend-context / range-behavior” mismatch.)
1) The real problem: traders confuse bias with permission
Bias answers: “Where can price go?”
Permission answers: “Should I participate right now?”
In your snapshot, MARAL is basically saying:
Context: bullish (macro push still valid)
Micro-environment: late-stage / liquidity-heavy / rotation-capable
Management: protect, not add size
This is the exact zone where retail enters because “trend is up,” while price is actually transferring inventory.
2) What a range really is (technical definition)
A range is two-sided auction where:
price is mean-reverting around a value area
volatility exists, but directional follow-through is unreliable
the market is building positions, not delivering trend
Range engine = Stop runs + absorption + reversion
Stop run (liquidity sweep) creates fuel
Absorption prevents continuation
Price returns to value (reversion)
So a range is not “flat candles.”
It’s rotation structure.
3) The chop signature you must respect (microstructure)
A) Overlap & Compression (market “breathing”)
Multiple candles share the same body area
Progress stalls (HH forms but doesn’t expand)
Impulses die quickly and get retraced
Translation: aggressive buyers are getting filled by passive sell liquidity (absorption).
B) Wick expansion (two-sided trap)
Upper wicks spike near highs
Lower wicks spike near lows
Both sides get “proof” and then get reversed
That’s not trend. That’s liquidity harvesting.
C) “Continuation” becomes fake continuation
Pullback entries get punished (no displacement)
Breakouts occur into nearby liquidity pools, then revert
MSS triggers without follow-through (classic chop)
4) Why your MARAL states scream “Range Risk”
Liquidity Context = HIGH
High liquidity means price is near where orders exist:
EQH / prior highs (buy stops)
premium zones / supply pools
large resting liquidity (institutions love filling there)
Implication: probability of sweep → stall → revert increases.
Participation = NEUTRAL
Neutral participation = no clean sponsorship.
real trend needs sustained aggressive participation (market orders)
neutral means rotation dominates
Implication: signals become “valid-looking but low-conviction.”
Risk State = OVEREXTENDED
Overextended is the late phase of a leg:
distance from mean increases
marginal buyers are late
reward-to-risk compresses
pullback likelihood rises
Implication: even if trend continues, entries are structurally inferior.
Risk Mode = NEGATIVE + CAP = DIV NEG
This is a high-value filter.
Negative divergence means:
price can push highs,
but underlying momentum/flow is weakening
Implication: more likely to see:
failed continuation
distribution
sharp mean reversion
Obstacle Ahead = YES + Exit Pressure = RISING
Obstacle = next liquidity wall / supply / HTF resistance cluster.
Exit pressure rising means:
the market is encouraging profit-taking behavior,
not adding fresh exposure.
Implication: “add positions” becomes statistically bad.
5) “Trend execution” vs “Range execution” (the technical difference)
Trend execution requires Expansion → Pullback → Expansion
A trend is not the direction arrow. A trend is a delivery mechanism:
Displacement (impulse with strong close)
Pullback to a valid POI (OB/FVG/value area)
Continuation displacement (follow-through)
If step (3) fails repeatedly → range behavior.
Range execution requires Sweep → Rebalance → Reject
Range is a different engine:
Sweep liquidity at an edge (EQH/EQL)
Rebalance to value (FVG fill / mean)
Reject from the opposite edge or value
If you keep trading pullbacks like trend, you’re fighting the engine.
6) The MARAL fix: the Permission Sequence (hard gating)
When context is bullish but environment is range-capable, MARAL requires:
Permission Gate 1 — Liquidity event must occur first
No entry unless price does one of these:
sweeps a local high/low (stop raid)
breaks a micro-structure level with intent
Because without a liquidity event, you’re entering inside the dealer’s inventory.
Permission Gate 2 — Displacement must be measurable
Not “green candle.”
Measurable displacement:
strong body close beyond structure
reduced wick on impulse candle
breaks a micro swing level with momentum
No displacement = it’s rotation.
Permission Gate 3 — Structure shift must be clean
Require:
MSS/BOS after displacement
then retest (not chasing)
If MSS triggers and immediately gets negated → chop.
Permission Gate 4 — POI validation is required
POI is not “order block touched.”
POI is valid only when:
it produces displacement
it aligns with HTF context
it is not inside mid-range value
Permission Gate 5 — Risk desk overrides context
If:
Risk State = OVEREXTENDED
Exit pressure = RISING
Obstacle Ahead = YES
Then default action becomes:
reduce size
tighten SL
wait for reset
This is why your Management Desk says SCALE OUT / TIGHT SL.
7) “Range Trap Zones” (where most trend traders die)
Trap Zone 1 — Mid-range value
best place to get chopped
worst R:R
both sides can be right and still lose
Rule: MARAL blocks mid-range entries unless displacement proves trend.
Trap Zone 2 — Late-stage premium (overextended highs)
liquidity is harvested
divergence appears
breakout buyers become exit liquidity
Rule: when OVEREXTENDED + DIV NEG → treat new highs as risk, not opportunity.
Trap Zone 3 — Breakout into obstacle
A breakout that runs into HTF obstacle is often:
a stop run
a fill event
a reversal trigger
Rule: obstacle ahead blocks chase entries.
8) Practical execution rules
MARAL Chapter 14 Rules — “Range Mode”
No mid-range entries. Only trade edges or after proven displacement.
Entry requires liquidity sweep (raid) first.
Displacement is mandatory. No displacement = no permission.
MSS + retest only. No chase.
If Liquidity HIGH + Participation NEUTRAL, treat as rotation until expansion proves otherwise.
If OVEREXTENDED + DIV NEG, default to protect / scale-out / wait for reset.
New trend entries are allowed only after:
pullback to POI
sweep
displacement
BOS
retest acceptance
A trend is a delivery. A range is a distribution.
When you buy distribution thinking it’s delivery, you donate to the chop.
#PriceAction #MarketStructure #Liquidity #SMC #ICT #OrderFlow #TradingPsychology #RiskManagement #Execution #CryptoTrading #BNB #TradingView

25900 is here! What’s next!?As we can see NIFTY did fell over 500++ points from our supply zone as analysed hitting or targets and now it can be seen trading at very important zone from where NIFTY reversed previously so we may expect NIFTY to show some minor short covering before finally heading towards our trendline support so plan your trades accordingly and keep watching everyone.

Chapter 13 — The First Entry IllusionWhy the “first entry” is rarely the safest entry (NZDUSD • 1H case study)
Retail logic says: “First touch = best price.”
Institutional logic says: “First touch = highest uncertainty.”
On the 1H, the first interaction with a zone is usually where liquidity is collected, not where clean continuation is guaranteed.
1) What “First Entry Illusion” really is
The illusion is thinking that a level is an entry.
But the market doesn’t pay you for finding levels.
It pays you for entering after the market proves intent.
First touch is often used to:
trigger impatient entries
run tight stops (because everyone places SL at the obvious edge)
create the real fill for the move (after liquidity is harvested)
So the first entry becomes the best price… for the other side.
2) Read this chart like an institution (using the boards)
A) Context Board (where the bias is, but also the conflict)
From your panel:
Direction: Bearish
H1: Bearish
Daily: Bearish
H4: Neutral
Structure: Bull Struct
Momentum: BEAR
Short Score: 78 (A)
Liquidity Context: HIGH
MTF Status: MIXED
15m bias: Bearish | 5m bias: Bearish
Translation:
Bias is leaning short, but structure is not perfectly aligned (bull-structure tag + mixed MTF).
That’s exactly where the first-entry trap becomes likely.
B) Qualification Gate (this is the key proof)
From your gate:
SETUP: SHORT
HTF CONTEXT: WARN
STRUCTURE: BAD
MOMENTUM: OK
VOL/REGIME: OK
LIQUIDITY: HIGH
ALIGNMENT: 78 / 65
ENTRY PERMISSION: ENTER
This is the “First Entry Illusion” signature:
You can get “ENTER”…
while HTF is WARN and Structure is BAD
and Liquidity is HIGH (meaning: stop pools likely still active)
So the system is basically saying:
“Yes, the short idea is valid — but the environment is still capable of a shakeout.”
That’s institutional thinking: permission is not a promise.
C) Management Desk (why first entry needs management discipline)
From your desk:
Trade Status: VALID
Market Phase: CONTINUATION
Exit Pressure: LOW
Momentum Health: STRONG
Risk State: OVEREXTENDED
Trade Age: FRESH
Action State: HOLD
Translation:
The move is alive (strong momentum / low exit pressure), but risk is overextended → chasing first entry or late entry is expensive.
Institutions don’t “feel” that — they measure it.
3) The institutional sequence (what retail skips)
Retail tries to win by being early.
Institutions try to win by being right after proof.
The safer sequence:
1) Liquidity job happens (HIGH liquidity = expect raids / stop runs)
2) Displacement confirms intent (real push, not just a wick)
3) Retest gives controllable invalidation (this is where risk becomes clean)
4) Then execution (not before)
✅ Rule:
First touch = information.
Second interaction + proof = execution.
4) Practical “No-Trap” rule for Chapter 13 (viral simple, institutional true)
If LIQUIDITY = HIGH and STRUCTURE = BAD/WARN, treat the first entry as a probe, not a full position.
Your discipline upgrade:
First touch: small size / or no trade
Wait: displacement + retest (or structure repair)
Then: full entry with clean SL logic
That is the mindset shift:
From “I want the best price” → to “I want the safest permission.”
5) The real goal (mindset change)
My objective is not to excite retail traders with “early entries.”
My objective is to re-engineer retail behavior into an institutional execution mindset:
Permission > Prediction
Proof > Hope
Risk governance > emotional timing
The core mistake:
Retail thinks: “First touch = best price.”
Institutions think: “First touch = liquidity extraction zone.”
If liquidity is high, the first touch is often designed to punish impatience.
Mistake #1 — Treating a level as an entry
Retail behavior:
“Price reached my zone → I must enter.”
Why it fails (market mechanics):
A zone is only a location. Institutions still need inventory + liquidity.
So they often use the first touch to:
trigger breakout entries
trap reversal entries
sweep obvious stop placements
✅ MARAL solution: Qualification Gate separates “location” from “permission”
Even when SETUP = SHORT, MARAL exposes the danger when:
HTF CONTEXT = WARN
STRUCTURE = BAD
LIQUIDITY = HIGH
Translation: “You are early in a hostile environment. First touch is not a green light.”
Mistake #2 — Ignoring the Liquidity Job
Retail behavior:
Entering before the market raids nearby liquidity pools.
Why it fails:
When Liquidity = HIGH, the market is telling you:
“There are stop pools nearby. Price will likely interact with them before continuing.”
Most first entries get stopped because they sit exactly where liquidity is being harvested.
✅ MARAL solution: Liquidity Context becomes an execution filter
When LIQUIDITY = HIGH, MARAL forces a mindset shift:
First touch = observation / probe
Second interaction after proof = execution
This is institutional sequencing.
Mistake #3 — Thinking “ENTER” means “SAFE”
Retail behavior:
If a tool says “enter”, they go full size emotionally.
Why it fails:
A valid setup can still be a low-quality entry timing.
Market can be right — but the entry can be wrong.
✅ MARAL solution: Permission ≠ Promise (soul of execution)
MARAL gives permission, but the boards reveal risk context.
That’s why ENTRY PERMISSION can show ENTER while
HTF = WARN + STRUCTURE = BAD still exists.
Meaning: Trade idea may be valid, but first entry risk is elevated.
Mistake #4 — Using “tight SL at the obvious place”
Retail behavior:
Stops placed at the clean edge of the zone.
Why it fails:
The clean edge is exactly where the market expects stops to sit.
First touch often manufactures a wick to take those stops, then continues.
✅ MARAL solution: Management Desk converts entries into risk-governed positions
Use the desk like a professional:
If Risk State = OVEREXTENDED → don’t chase / don’t full size
If Trade Age = FRESH + Momentum Health = STRONG → hold winners logically, not emotionally
If Exit Pressure = LOW → avoid panic exits on noise
It’s not about “being right”. It’s about “staying right.”
Mistake #5 — No “Proof Step” (they skip confirmation)
Retail behavior:
They enter at touch. They don’t require displacement or structure repair.
Why it fails:
Without proof, first entry is just a guess.
✅ MARAL solution: Proof-based execution gating
MARAL’s institutional workflow is:
Context → Qualification → Management
So the correct approach is:
When Structure is BAD/WARN: demand proof (displacement / repair)
When MTF Status = MIXED: reduce aggression (no hero entries)
When Liquidity = HIGH: expect traps first
The MARAL “First Entry Protocol” (simple + viral)
When you see this combination:
✅ Setup: SHORT
⚠️ HTF: WARN
❌ Structure: BAD
🔥 Liquidity: HIGH
Your action is not “enter fast”.
Your action is:
1) No full size on first touch
First entry = probe or wait.
2) Require proof
Displacement + cleaner retest.
3) Let the market pay you for patience
Second interaction is usually safer than the first.
Closing line (institutional mindset)
Retail asks: “How early can I enter?”
Institutions ask: “Has the market earned my participation?”
Your goal is not to catch the first move.
Your goal is to catch the safest move.
#Trading #Forex #SMC #SmartMoneyConcept #OrderBlocks #Liquidity #MarketStructure #PriceAction #RiskManagement #TradingPsychology #TradingDiscipline #DayTrading

We are getting closer towards our target As we can see despite the recovery NIFTY managed to close negative after hitting our strong supply zone. We can expect NIFTY to show short covering slightly before finally heading towards our target.

Chapter -12 The Waiting Skill (Why Waiting Is a Weapon)Chapter -12 The Waiting Skill (Why Waiting Is a Weapon)
Why inactivity is often more profitable than constant trading
Chapter 10 (Exit Intelligence & Trade Aging) proved something important: traders don’t actually need more signals — they need more control. The response i got (≈2.3K views + 131 Like) is the evidence: people are emotionally hungry for execution discipline and loss prevention, not “another buy/sell arrow.”
This chapter is the missing half of that story:
Exit Intelligence protects you once you’re in.
Waiting Skill protects you before you enter.
And the market rewards the second one even more.
1) The uncomfortable truth
Most accounts don’t blow up because the trader “can’t find entries.”
They blow up because the trader cannot sit still.
Overtrading is not a technical issue.
It’s a behavioral leak disguised as “analysis.”
You don’t lose because you didn’t trade enough.
You lose because you traded when the market did not give permission.
2) Why inactivity is profitable
Waiting is profitable for three reasons:
A) It deletes your worst trades
Your worst trades almost always come from:
low liquidity
mixed timeframes
range/chop
late entries after expansion
“forced setups”
Waiting removes those by default.
B) It upgrades your entry price
When you wait, you don’t chase.
You let the market come to your area.
That means:
tighter stop
better R:R
less stress
fewer “save trades” and revenge trades
C) It preserves mental equity
Capital is not only money.
It is also clarity.
Every unnecessary trade reduces clarity.
And clarity is the asset that produces the next clean trade.
3) The Waiting Skill is not “doing nothing”
Professional waiting is active. It has rules.
Waiting means:
scanning
grading conditions
refusing weak liquidity
refusing low-quality regime
refusing entries when permission is locked
Waiting is a decision. Not an absence of decision.
4) The chart lesson (your attached BTCUSD reference)
On your BTCUSD 4H chart, the story is perfect for this chapter.
What the Context Board is telling you
Direction: Bullish
H1 Context: Bullish
H4 Context: Bullish
Daily Context: Neutral
Liquidity Context: LOW
LTF Exec: WEAK
Market Phase: RANGE
Risk State: OVEREXTENDED
Active Window: OFF
ECI score shows 78 (A) but with CAP NOTES: LOW LIQ
This is the core lesson:
Even with a strong score, LOW LIQ + RANGE + OVEREXTENDED + LTF WEAK means:
your edge is not entry — your edge is waiting.
What the Qualification Gate / EDC is saying
SETUP: WAIT
ENTRY PERMISSION: WAIT
LIQUIDITY: LOW
So MARAL is doing exactly what a real execution system must do:
✅ it separates “market bullish” from “trade allowed”
✅ it blocks forced participation
✅ it prevents the most common type of loss: the impatience loss
What this means in real trading language
This is not a “no trend” environment.
It’s a “trend exists, but entry quality is currently unsafe” environment.
And that distinction saves accounts.
5) The retail illusion: “If it’s bullish, I must buy”
Retail logic:
Market bullish → buy now → hope
Professional logic:
Market bullish → wait for liquidity + timing + permission → then execute
Direction is not permission.
Trend is not timing.
Bias is not entry.
The Waiting Skill is the ability to hold that separation.
6) What MARAL is really teaching here
MARAL is not only a tool.
It is a behavior correction system.
It forces three professional behaviors:
(1) Permission-based execution
If Entry Permission is not granted, you do not trade — no matter how “good” the chart looks.
(2) Liquidity-aware patience
Liquidity LOW means:
spreads/inefficiency in execution
chop fake-outs
poor follow-through
stops get hunted easier
So MARAL uses liquidity as a safety switch.
(3) Regime recognition
Market Phase = RANGE means:
more noise than edge
you need perfect timing or you bleed slowly
So MARAL pushes you into WAIT mode until structure becomes tradeable.
7) The Waiting Checklist
Use this as a strict gate:
WAIT if ANY of these is true
Liquidity Context = LOW
Market Phase = RANGE
Risk State = OVEREXTENDED
LTF Exec = WEAK
Entry Permission = WAIT
Setup = WAIT
Daily Context = Neutral while lower TFs are pushing late
Only consider entry when
Liquidity improves (LOW → Neutral/High)
Market Phase shifts (Range → Trend / Expansion)
Risk State cools down (Overextended → Normal)
Entry Permission unlocks
LTF Exec strengthens
This is how you convert “I want more signals” into “I want better trades.”
8) The hidden advantage: waiting gives you cleaner exits too
Chapter 10 was about Exit Intelligence.
Here’s the connection:
Bad entries create bad exits.
If you enter during:
low liquidity
range regime
overextended conditions
…your exits become emotional:
early exit
late exit
panic close
revenge re-entry
So waiting is not just “entry discipline.”
It is exit quality protection.
Engineering Analogy (This Is Exactly Engineering)
A pump system never runs at full speed all the time.
It operates only when the system demands it — and only when safe operating conditions are confirmed.
It waits for:
Demand signal (real requirement, not noise)
Pressure setpoint deviation (a valid reason to engage)
Safe operating window (operating inside design limits)
Stable suction condition (NPSH safety — no cavitation risk)
Now bring the same logic to trading:
A professional trading system doesn’t “run” because it can.
It runs only when conditions permit safe operation.
Think of this like a BMS (Building Management System) Engineering point of view — to show how an execution framework should behave every second, not only at entry.
Just like a BMS continuously monitors:
Temperature
Pressure
Flow
Alarms
Safety thresholds
This framework continuously monitors:
Market state
Execution permission
Risk conditions
Liquidity pressure
Trade validity
Every second. No guessing. No prediction.
Key point:
This is not about generating buy/sell signals.
This is about real-time decision governance.
Just like a BMS doesn’t open a valve because temperature moved 0.1°,
this system doesn’t allow a trade just because price ticks.
Markets don’t need faster traders.
They need better decision control.
Watch the seconds — not the candles.
And one more point — because this is engineering:
I don’t ignore small variables in complex systems.
In engineering, micro-deviations create macro failures (vibration → fatigue → breakdown).
Markets are no different: small condition shifts become big losses when execution is uncontrolled.
That’s why this is an engineering-driven execution tool —
built to monitor micro-changes and enforce discipline before damage happens.
In buildings, a BMS (Building Management System) does not “guess.”
It enforces interlocks:
If a safety condition fails → the system blocks operation
If the environment is unstable → it stays in WAIT / HOLD
If alarms trigger → it shifts into protective mode
If multiple parameters don’t align → it refuses to start, even if one signal looks good
Trading should be the same.
MARAL is built exactly like that.
It is not a “signal generator.”
It is an engineering-grade execution control system — a safety interlock + decision logic that prevents forced participation.
Because in real engineering:
Running at the wrong time destroys equipment.
And in markets:
Trading at the wrong time destroys accounts.
chapter closing
The trader who wins long-term is not the one with the most trades.
It is the one with the most refused trades.
Waiting is not passive.
Waiting is selecting only the market moments that pay.
Note : This is an educational execution framework demonstration — not a signal service, not investment advice, and not a recommendation to buy or sell any asset.
#Trading #TradingPsychology #Discipline #RiskManagement #Execution #PriceAction #SmartMoney #ICT #Liquidity #Bitcoin #BTC #Forex #Futures #SystemTrading #TradingRules #NoTradeIsATrade #EngineeringMindset #BMS #AutomationLogic #ProcessControl #MARAL

Will remain short unless NIFTY breaks above previous high! As we can see NIFTY did show some rejection as analysed in our previous post and fell. We will stand by our analysis as Nifty is still trading in his supply zone and unless NIFTY sustains itself above previous swing every rise can be sold so plan your trades accordingly and keep watching everyone

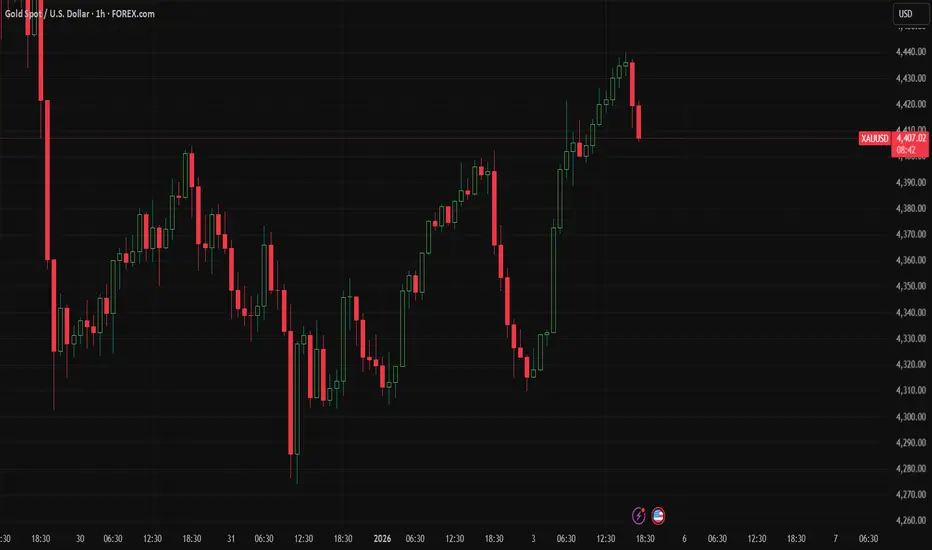
Chapter 11 — Late Entry Trap (What traders keep repeating)Deep Dive on “Late Entry Trap” Mistakes (What traders keep repeating)
(Reference: the attached XAUUSD 1H chart)
This chart is a perfect example of a common trading failure pattern:
1) The real trader problem here (human behavior)
After a strong impulsive move, the brain does something dangerous:
A) “I missed it” becomes urgency
• When price runs without you, it creates pain.
• That pain turns into a decision like: “I must enter now to fix the regret.”
• This is not analysis. It’s emotional compensation.
B) Candle strength becomes “proof”
• Big green candles feel like confirmation.
• But strong candles are often the end of the easy part, not the beginning.
• Late buyers enter when smart money is already reducing risk, not increasing it.
C) Traders confuse movement with opportunity
• Movement looks like opportunity.
• But the best opportunities often come during reset, not during acceleration.
________________________________________
2) Deep explanation of each mistake (common + costly)
✅ Mistake 1 — Chasing after expansion (the “late momentum buy”)
What they do:
They buy after a long push because it “looks strong.”
Why it fails:
After expansion, the market naturally wants to:
• rebalance,
• cool down,
• or trap late participants.
Truth:
When you enter after expansion, you’re not early.
You’re the liquidity for someone else’s exit.
________________________________________
✅ Mistake 2 — Buying near the top (entering at worst risk zone)
What they do:
They enter where price already traveled a lot.
Why it fails:
• Your stop has to be bigger (because structure is far below).
• Your target becomes smaller (because price is already high).
• So the trade becomes bad math instantly.
Truth:
Late entry turns a good trend into a bad risk-reward trade.
________________________________________
✅ Mistake 3 — Entering during low participation (thin liquidity trap)
What they do:
They enter when the market “moves” but participation is weak.
Why it fails:
Thin participation = price can jump both ways easily:
• small orders move price too much,
• sudden wicks hit stops fast,
• reversals become sharp.
Truth:
In low participation, your stop becomes a magnet.
________________________________________
✅ Mistake 4 — Ignoring range behavior (trend fantasy inside a pause)
What they do:
They trade as if continuation is guaranteed.
What’s really happening:
After a run, price often enters a “rotation” phase:
• back-and-forth candles,
• fake breakouts,
• stop sweeps.
Truth:
A range after a push is not “rest before continuation.”
It’s often a trap-building zone.
________________________________________
✅ Mistake 5 — Confusing candle strength with trade quality
What they do:
They believe: “Strong candle = safe entry.”
Why it fails:
Strong candles often appear:
• right before pullback,
• right before profit-taking,
• right before consolidation.
Truth:
Strong candles can be the last invite before reversal.
________________________________________
✅ Mistake 6 — Overtrading after missing the first entry
What they do:
They attempt multiple entries:
• first entry fails → re-enter,
• second fails → re-enter again.
Why it fails:
Because they’re no longer trading the chart — they’re trading their ego.
Truth:
Multiple entries inside the same zone is often revenge trading in disguise.
________________________________________
✅ Mistake 7 — Widening stop-loss (the silent account killer)
What they do:
They widen SL because they “believe” the direction is right.
Why it fails:
Direction might be right — but timing is wrong.
Widening SL doesn’t fix timing; it just increases damage.
Truth:
A widened SL is not risk management.
It’s denial.
________________________________________
✅ Mistake 8 — No rebuild entry (entering without reset structure)
What they do:
They enter with no:
• pullback base,
• retest,
• clean trigger zone.
Why it fails:
Without rebuild, the market has no “support floor” to protect your entry.
So even a normal pullback looks like a stop hunt.
Truth:
No rebuild = no protection.
________________________________________
✅ Mistake 9 — Entering while conditions deteriorate (the “looks good but weak” trap)
What they do:
They ignore that momentum quality is weakening.
Why it fails:
Markets can still go up while strength fades — and then collapse quickly.
This is why late entries get punished:
• upside slows,
• downside snaps.
Truth:
When quality deteriorates, your entry becomes a coin flip.
________________________________________
✅ Mistake 10 — No re-entry rule (entering emotionally, not logically)
What they do:
They treat every re-entry like the first entry.
Why it fails:
Re-entry is a different trade type.
It requires confirmation that:
• the move reset,
• conditions stabilized,
• risk reduced.
Truth:
Without a re-entry rule, every missed move becomes a future loss.
________________________________________
3) Simple market reality (why this “danger window” exists)
After a strong bullish leg, the market is usually deciding between:
• Pullback (healthy reset)
• Range (trap + liquidity sweep)
• Final push (exhaustion move) → then sharp reversal
So late entries get punished because:
✅ risk is high (stretched price)
✅ reward is limited (less space left)
✅ noise is higher (range + sweeps)
________________________________________
✅ Solution: What MARAL does in this exact situation
Now we bring MARAL in.
4) MARAL’s core message here
MARAL prevents the “late entry trap” by doing two things:
A) It blocks entries when trade quality is not stable
Even if direction looks bullish, MARAL checks:
• Is the market in a clean trend or in a range?
• Is liquidity supportive or thin?
• Is execution safe or “avoid” conditions?
• Is the score improving or deteriorating?
• Is the market overextended?
If those conditions are not healthy, MARAL pushes you into WAIT / NO-TRADE / AVOID mode.
B) It forces a “reset rule” before re-entry
MARAL doesn’t allow “I missed it so I’ll chase.”
It demands a reset first, like:
• price cools down,
• structure rebuilds,
• liquidity improves,
• alignment becomes clean,
• execution window turns active again.
Only after this reset does it give re-entry permission.
________________________________________
5) MARAL’s practical outcome for the trader (what changes)
• It stops you from buying after the move (where most traders get trapped).
• It protects you during low-liquidity / mixed conditions.
• It prevents “revenge re-entry” and overtrading.
• It trains you to wait for permission, not candle excitement.
• It turns “missing a move” into a non-event: skip → wait → re-enter only when conditions reset.
________________________________________
Final punchline (Chapter 11 close)
Most traders don’t lose because they read direction wrong.
They lose because they enter at the wrong moment — late, stretched, and emotional.
This chapter is about eliminating that exact mistake.
#TradingPsychology #TraderMistakes #LateEntry #FOMO #RiskManagement #Liquidity #MarketStructure #Execution #NoTradeIsATrade #Discipline
Educational Purpose Only
This content is shared strictly for market education and trader awareness.
It explains common behavioral mistakes, market conditions, and execution concepts observed in real charts. This is not financial advice, not a buy/sell signal, and not a trading recommendation. Trading involves risk, and all decisions remain the responsibility of the individual trader. Past market behavior does not guarantee future results.
NIFTY might get rejected from here!AS we can see NIFTY is heading towards new ATH for NIFTY but it seems like this a strong supply zone hence despite breaking new ATH, we may see NIFTY getting rejected from here so any signs of rejection from here can show good downside so plan your trades accordingly and keep watching everyone.

NIFTY can show strong upmove above 26200As we can see NIFTY remained sideways throughout the day but it can be seen forming more like an flag-pole pattern in smaller time frame hence any closing above previous high can show strong upmove so plan your trades accordingly and keep watching everyone.

Strong RECOVERY exactly as analysed! But will it sustain!?As we can see NIFTY recovered sharply exactly as analysed as it took support at our demand zones! But it is too quick now to judge the upcoming trend by single day move as it could be a sentiment based volume which doesn’t last long. Hence as long as NIFTY doesn’t crosses and closes itself above previous swing, shorting at signs of rejection around supply zones can be done so plan your trades accordingly and keep watching everyone.

SIGN of REVERSAL!?As we can see NIFTY did manage to form more like a doji called showing indecision around our demand zone. This shows we are trading at demand zone but yet to test the trendline support hence a great would be when we could see a sign of reversal around the trendline so plan your trades accordingly and keep watching everyone

BTC Weekly downtrend & Potential Reversal zoneson 27th Oct, BTC had its buyside sweep on Daily chart and later confirmed to be the Lower High for its weekly bearish trend reversal.
(Marked with grey arrow)
Earlier we had the bullish fib marking 2nd swing target of 124.4k & that marked the end of bullish trend in October this year.
With current weekly downtrend, we have 1st , 2nd & 4th swing targets.
(refer to the red downward fib)
1st swing target zone - 90.9k till 82.1k
2nd swing target zone - 73.2k till 64.4k
( this is also confluencing with 3M FVg gap as marked on the chart)
this maybe highly probable area for weekly trend to reverse or atleast a strong bounce up.
4th swing target zone - 37.9k till 29.1k

Short setup on BTC 4HBTC has been in Weekly downtrend.
with today's LTF pump it has reached it premium zone in the weekly swing leg.
will wait in 15min-1H for entry confirmation.

BUY THE STRONGEST ONE_PFOCUS_LONGTERM TRADEHi traders,
Posting the interesting Topic on PFOCUS with Technical Analysis long-term view.
Currently PFOCUS is trading at INR 241.86 with longer term bullish Veiw.
Entry at current level with stoploss of 12 Months low. Ride the trend until it closes previous yearly low price or Market Structure.
Note:_ Only for Educational purpose Since investments in Securities and market are subjected to market risk

Target achieved !! Will NIFTY show respite from here!?As we can see NIFTY had been falling unidirectionally and is about to reach the trendline support which previously acted as a resistance. Hence we might see a recover arise 25850-900 levels but will only trade is signs of reversal is witnessed so will plan trade according to the market sentiment. Our targets achieved.

More weakness coming in!?As we can see NIFTY had been falling unidirectionally from our supply zone as analysed. now we can expect NIFTY to fall even more covering the gaps and testing the trendline and act as a retest to trendline before finally taking support at the trendline and continuing its upmove so plan your trades accordingly and keep watching everyone.

CDSL short ideaLogic: As the stock is in downtrend, the supply zone identified is also a supply on weekly.
Going short on within the marked levels would be better probability.
The supply has earlier broken a prior pivot too followed by a flip zone.

KEI LONG SETUPLogic : KEI is on Uptrend and is trying to break the consolidation on the weekly, entering long on the 125 mind marked demand zone would be a good opportunity. The stock has tried to break the previous high and is retracing too.
The zone also co incides with 50% length of the weekly candle.
Keep strict SL below the zone

NBCC LONG setupLogic: Nbcc has been in Uptrend on Daily and weekly. The demand zone formed is evident on most time frames.
2 scenario can be seen
Scenario 1: if price tries to retrace to the level then entering long is definitely an opportunity
Scenario 2: if price does not retrace and a small inside candle is formed on the daily time frame, then entering long on break of the high of the candle as marked can be a equivalent opportunity, the reason behind, as price may not retrace on strong uptrending stock easily.

WAAREE ENERGIESWAAREE Energies | Daily TF | SMC Setup
Price has entered a strong bullish Order Block (Demand zone) after a corrective move.
Clear bearish BOS earlier, but current candles show order flow shift and buying reaction from the OB.
📌 Trade Plan (Pullback Buy):
Buy Zone: 3000–3050
SL: 2880 (Daily close below OB = invalidation)
🎯 Targets:
T1: 3300–3350
T2: 3600–3650
T3: 3850–3900
📊 Logic:
OB respected with strong rejection
Minor structure shift inside demand
Expect pullback → continuation towards supply zones (T1–T3)
⚠️ Note: This is a counter-trend bounce trade. Manage risk strictly. Book partial at T1 and trail SL.
