Nifty 50 Price Structure Analysis [11/12/2025: Thursday]Top-Down Nifty 50 Price Structure Analysis for 11th December 2025. The day is Thursday.
(1) Monthly Time Frame:
Red marubozu. Red piercing candle. The green body of the previous month is almost engulfed. It is an inside month so far with a bearish bias. Clear signs of trend reversal. No sign of bullishness. Major resistance is at level 25900. Minor support is at level 25700. The view is indecision to bearish.
(2) Weekly Time Frame:
Perfect red marubozu after a red hanging man candle. It's a start of a lower lows and lower highs price structure. A clear breakdown of level 25900 confirms a breakdown from 3 weeks of consolidation. Super strong resistance is at level 25900. A minor support is at level 25700. There is no sign of bullishness. There is a high probability of dropping down to the level 25600 and further below. The view is bearish.
(3) Daily Time Frame:
A clear price structure of lower lows and lower highs is visible. Back-2-back 3 days red candle. Today's candle is an improvisation of red marubozu with a long upper wick. A clear sign of heavy selling pressure. Thus, the market is weak. Super strong resistance is in the zone (25950 - 25900). A minor support is in the zone (25750 - 25700). There is a high probability of the price breaking through the level 25700 to reach the level 25600. There is no sign of bullishness. The view is bearish.
(4) 30-Minute Time Frame:
A perfect breakdown from a head and shoulder (H&S) pattern. Price structure has also completed a minor pullback structure after breaking the H&S neck by touching the level 25900. Super strong resistance is in the zone (25950 - 25900). Minor support is in the zone (25750 - 25700). There is no sign of bullishness. Thus, there is a high probability of the price breaking down level 25700 to reach level 25600. The view is bearish.
Bullish Scenario Set-Up:
(i) Price sustains above the opening price.
(ii) Price constructs a higher highs and lower lows structure above the zone (25950 - 25900).
(iii) There is a very low probability of a bullish scenario.
Bearish Scenario Set-Up:
(i) Price sustains below the opening price.
(ii) Price decisively breaks down level 25700 with a motive of approaching the 25600 level.
(iii) There is a very high probability of a bearish scenario.
No Trading Zone (NTZ): (25900 - 25800)
Event:
SENSEX weekly expiry plus a high-impact event - FED interest rate decision is on 11/12/2025 (Thursday). Price structure uncertainty is expected.
Summary of the Trading Plan (Hypothesis and Insight):
(i) The market is clearly bearish. There is no sign of bullishness. Thus, every up move should be doubted. Execute only bearish trades.
(ii) SENSEX weekly expiry and the FED interest rate decision might create high price structure uncertainty. The best time to trade is in the second half or the last hour of the day.
(iii) A very strong resistance zone is (25950 - 25900). Think of bullish trades only when the price forms a higher highs and lower lows structure above the resistance zone. However, the probability is very low.
(iv) Minor support zone is (25750 - 25700). Once price breaks down the level 25700, take bearish trades with the first target to 25600. If the price falls deepens, then the next probable target is 25500.
(v) No trading zone (NTZ): (25900 - 25800).
(vi) Trade only when either bullish or bearish conditions are fulfilled. Otherwise, don't trade. Protect your resources.
NOTE:
"Mark your points. Trade your points. Price is God. Anything can happen in the markets. Therefore, trade what you see, not what you believe."
Happy Trading!
Multiple Time Frame Analysis

Why Nifty’s Ending Diagonal Turns the Bias BearishAfter my previous bullish take on Nifty (see linked related publications), the view has now flipped.
And no — it’s not because the US indices are cracking.
And no — it’s not because Bitcoin is collapsing and draining liquidity.
Those may add pressure, sure.
But the core reason I’m turning bearish is right on the chart — in the structure itself.
Daily Chart – Why the Tone Has Changed
The key shift came from the overlap at 25,448.95 , which strongly hints that the rally from 24,404.70 unfolded as an ending diagonal , with all five legs subdividing into 3-wave structures (a-b-c).
This overlap is what invalidates the impulsive interpretation and turns the structure corrective.
That means the entire rise into wave (B) likely finishes a B-wave top , and Nifty may now be moving into wave (C) down.
At this point, Nifty could be forming either:
An ABC Expanded Flat , or
A Running Flat
Both are bearish in the short-term and typically resolve with a deeper C-wave.
And honestly, there is zero point chasing this market unless we get a decisive close above the ATH — whether on the daily , the weekly , or especially the monthly , which is about to complete and should give a clean directional clue.
Until that happens, the risk–reward on fresh longs is questionable.
This entire bearish view gets invalidated only if Nifty posts a strong , sustained close above the ATH on higher timeframes.
Weekly Chart – Resistance Stack Remains Heavy
The weekly structure adds more weight to the bearish bias:
Nifty is testing the ATH zone , a major psychological resistance.
Price is also hitting the rising trendline , which has already rejected earlier attempts.
Both these zones converge right at current levels — not the best place to be aggressive on longs.
This is a classic “let the market prove itself” zone.
Summary
The structure has shifted to corrective due to the ending diagonal overlap.
Daily chart suggests an Expanded or Running Flat scenario.
Weekly chart shows dual resistance — ATH + rising trendline.
No fresh longs unless there’s a clean breakout above ATH on higher timeframes.
Monthly candle close will be crucial.
Patience > prediction. Let the structure confirm before acting.
Disclaimer: This analysis is for educational purposes only and does not constitute investment advice. Please do your own research (DYOR) before making any trading decisions.

NIFTY heading towards 25500!As we can see NIFTY continued its bearish sentiment and had been bearish throughout the day. Now, following the structure , we can expect NIFTY to continue its bearishness until a strong demand zone comes up which can be seen around 25500 so we can target that level so one can plan their trades accordingly.

Nifty 50 Price Structure Analysis [10/12/2025: Wednesday]Top-Down Nifty 50 Price Structure Analysis for 10th of December 2025. The day is Wednesday.
(1) Monthly Time Frame:
Red piercing candle. Sign of indecision and trend exhaustion. Major resistance is at level 26000. Major support is at level 25700. The view is indecision to bearish.
(2) Weekly Time Frame:
Red marubozu with weak lower wick. The previous week's candle is also a red hanging man. Today's price gave a breakdown below 3 weeks of consolidation. Signs of trend reversal and previous trend exhaustion. The zone of 25950 - 25900 is a major resistance. The zone of 25750 - 25700 is a major support. The view is bearish.
(3) Daily Time Frame:
Today's candle is kind of a red spinning top or long-legged doji with a small body. The candle shows a breakdown below the level 25900. The day is highly indecisive with a bearish bias. The zone of 25950 - 25900 is a major resistance. The zone of 25750 - 25700 is a major support. The view is bearish.
(4) 30-Minute Time Frame:
Price showed the neck breakdown of the classical head & shoulder (H&S) pattern. The zone 25950 - 25900 is a major resistance. The zone of 25750 - 25700 is a major support. The gap in the zone of 25750 - 25700 still remains unfilled. Today's price broke level 25900 and again got rejected from the same level. Additionally, price strategically expired below the level 25900 but above the level 25800. The price structure of lower highs and lower lows is intact. Thus, the institutional bias is negative. Every up move should be doubted. The view is bearish.
Events:
No expiries on Wednesday. However, the FED interest rate decision is on 11 December (the day after). Expecting high volatility.
Bullish Scenario Set-Up:
(i) Price sustains above the opening price.
(ii) Price starts to build a higher highs and lower lows price structure above the level 26000 (which is a distant level).
(iii) Every up move till the upper breach of level 26000 should be doubted.
Bearish Scenario Set-Up:
(i) Price sustains below the opening price.
(ii) Price starts to trade below the level 25800.
(iii) If the price sustains below the level 25800, there is a higher chance of the price breaking down the level 25700.
No Trading Zone (NTZ): 25900 - 25800.
Hypothesis and Insights from the Trading Plan:
(i) Take bearish trades only as institutional bias is bearish.
(ii) Any up move should be doubted. Bulls are weak.
(iii) The only indication of bullish trades will initiate when the price starts to trade above the level 26000 (which is a distant level). The chances are very low.
(iv) Strong resistance zone is (25950 - 25900).
(v) Minor support zone is (25750 - 25700).
(vi) The neckline of the H&S pattern is broken, confirming the initiation of the bearish phase of at least 400 points (considering the previous range of consolidation).
(vii) If level 25700 is broken, then a free fall is inevitable.
(viii) No Trading Zone (NTZ): (25900 - 25800).
(ix) Trade only when either bullish or bearish conditions are fulfilled. Otherwise, don't trade. Protect your resources.
NOTE:
"Mark your points. Trade your points. Price is God. Anything can happen. Therefore, trade what you see, not what you believe."
Happy Trading!

NIFTY just got very weak!As we can see NIFTY showed strong downfall and it can be seen forming more like a head and shoulders pattern which is strong bearish structure so any closing below 25900 can show 25500 in coming trading sessions so plan your trades acordingly and keep watching everyone.

Nifty 50 Price Structure Analysis [09/12/2025: Tuesday] Top-Down Nifty 50 price structure analysis for 09th December 2025. The day is Tuesday.
(1) Monthly Time Frame:
Red indecisive candle. Major resistance is at level 26100. Minor support is at level 25900. The view is indecisive to bearish.
(2) Weekly Time Frame:
First day of the week. Today's red candle confirms that last week's red paper umbrella was a hanging man. Clear sign of trend reversal. Major resistance is at level 26100. Minor support is at level 25900. The view is bearish.
(3) Daily Time Frame:
It's kind of a red morubozu with a minor 50 points lower wick. The candle engulfed the last 2 days of green candles. A major resistance zone is formed at the levels 26100 - 26000. Minor support is at level 25900. The view is bearish.
(4) 30-Minute Time Frame:
Two trend reversal patterns are observed. The first pattern is head & shoulder (H&S). The second pattern is a triple top. It's a clear sign of trend reversal. The neck of both the H&S and triple top is formed at the level 25900. A major resistance zone is formed at the zone 26100 - 26000. Minor support is at level 25900. Every up move should be doubted. The view is bearish.
Events:
Nifty 50 weekly expiry. No other high-impact event. However, a major event is on 12 December - the FED interest rate decision. Thus, volatility is expected.
Bullish Scenario Set-Up:
(i) Price sustains above the opening price.
(ii) Price sustains above the level 26100.
Bearish Scenario Set-Up:
(i) Price sustains below the opening price.
(ii) Price sustains below the level 25900 and shows promise of breaking below the level 25850.
(iii) Bearish target is in the zone (25750 - 25700)
Expectations (Hypothesis and Insights from the Trading Plan):
(i) Take a bearish position only. Price must break the level 25900 and show promise of trading below the level 25850.
(ii) Doubt every up move.
(iii) Take no bullish trade until the price starts to trade above the level 26000 - 26100.
(iv) There is a higher probability of breaking down (bearish trend continuation).
(v) After price breaks below the level 25850, there is a higher chance that the price will try to fill the gap in the zone 25750 - 25700.
(vi) Its expiry day. So, expect uncertain price movement in the second half.
(vii) It may happen that bulls might try to expire price above the level 26000 by the end of the day.
(viii) Trade only when bullish/ bearish conditions are fulfilled. Otherwise, don't trade. Protect your resources.
NOTE:
"Mark your points. Trade your points. Price is God. Anything can happen. Therefore, trade what you see, not what you believe."
Happy Trading!
NIFTY heading towards new ATH now!as we can see NIFTY finally broken above the indecision phase and also brok the high the doji. Based on our analysis after showing false breakdown, it can finally carry on its uptrend towards new ATH now. So, plan your trades accordingly and keep watching everyone.

Weekly Wrap : #Nifty50 Bulls are here to stay? First Step of a successful trader is to build a Trade plan & review what he has done. (education purpose for all )
*Trend is up.
*Trade plan: Buy on Dip
* Critical Levels:
* Resistance:26300/26470
* Support: 26060/25950
Jai Hind.
Disclaimer :
This video is only for educational purposes. Please consult your financial advisor before you take any trade.

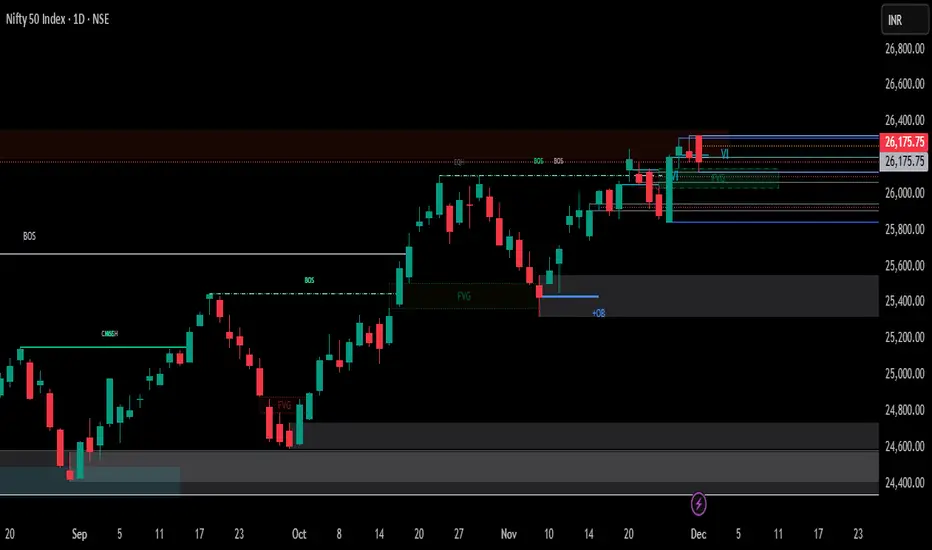
NIFTY – Multi-TF Breakdown | Structure, Levels & What Comes Next📌 Higher-Timeframe Bias (1D)
Nifty continues to respect bullish market structure on the daily timeframe, holding above the recent Break of Structure (BOS) and defending the previous demand zone.
Key notes from the chart:
Price rejected from the premium zone near 26,350–26,400 (EQH area + weak high).
Strong reaction from the discount OB + FVG around 25,350–25,450 zone.
As long as Nifty holds above 25,800, higher-timeframe bullish bias remains intact.
Daily Structure:
HH → HL sequence intact
The last BOS confirmed continuation
Daily OB remains unmitigated below
🔍 4H Structure (Important for Traders)
On the 4H chart, Nifty filled previous imbalances and retested FVGs cleanly.
Key observations:
PDH & PDL zones respected perfectly.
A bullish MSS → BOS has shifted short-term sentiment upward.
FVG at 26,000–26,060 acted as intraday support.
Price reclaimed the VI / PDH cluster, showing absorption of sellers.
This suggests buyers are defending short-term inefficiencies.
🎯 Key Levels to Watch
Upside Resistance:
26,300 – 26,350: Major supply zone
26,400: Weak High + Liquidity Pool
26,475: Next upside target if breakout sustains
Downside Support:
26,050 – 26,000: Intraday FVG + 4H demand
25,900: PDL cluster
25,750: HTF structure break level
25,350 – 25,450: Daily OB/FVG (Major swing support)
📈 Trading Plan (Not Financial Advice)
Bullish Scenario:
If price holds above 26,000 and sustains above PDH/VI cluster →
▶ Target 26,300 → 26,400
▶ Break & close above 26,400 = continuation higher
Bearish Scenario:
If 26,000 breaks decisively →
▶ First target 25,900
▶ Below that → revisit 25,450 (Daily OB)
🧩 Market Structure Summary
HTF bullish, LTF recently flipped bullish
Price currently inside a premium zone, so chasing longs is risky
Dips into discount levels (26,000 / 25,900) are ideal for long setups
Break above 26,350–26,400 can trigger liquidity sweep continuation
🏁 Conclusion
Nifty is compressing between liquidity levels.
The next expansion is likely once 26,400 or 26,000 breaks.
🔥 Bias: Moderately Bullish as long as 26,000 holds.

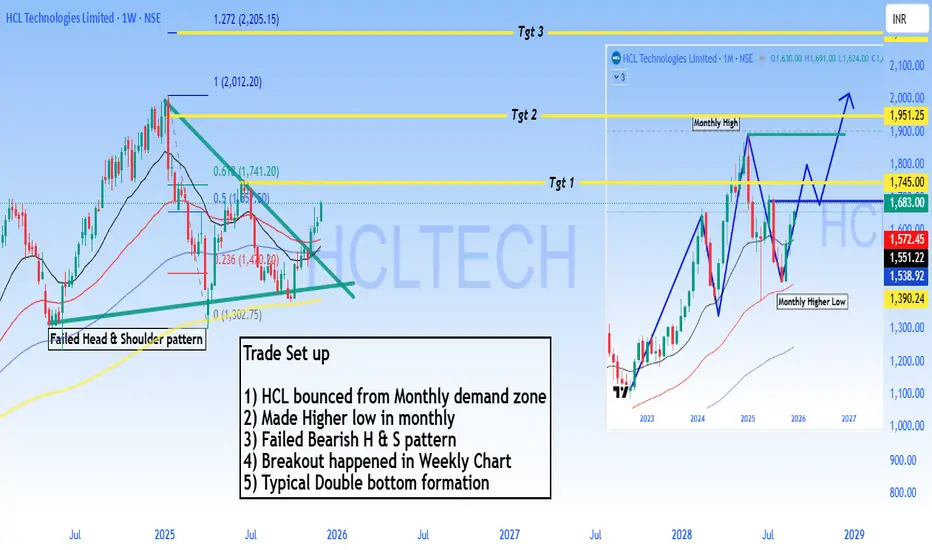
HCLT - Buy - Technical Analysis#HCL Technologies Limited - Technical Analysis
Price: 1,683.00 |
#Trade Setup - Bullish Reversal
#Outlook
Strong bullish setup with 4-35% upside potential. The failed bearish head & shoulder pattern combined with monthly demand zone bounce suggests institutional accumulation. Breakout above 1,745 opens path to 1,951 and beyond.
Pattern Analysis:
1. Bounced from monthly demand zone - Strong support established
2. Made higher low in monthly chart - Trend reversal signal
3. Failed Bearish Head & Shoulders pattern - Bears trapped, bullish continuation
4. Breakout confirmed on weekly chart - Momentum shift
5. Typical double bottom formation - Classic reversal pattern
Technical Structure:
- Monthly higher low at 1,390 confirms bullish structure
- Failed H&S pattern invalidation is highly bullish
- Price now targeting previous resistance zones
Target Levels:
- Target 1: 1,745.00
- Target 2: 1,951.25
- Target 3: 2,272.70
Support: 1,572 - 1,551 (critical zone)
⚠️ DISCLAIMER
**NOT investment advice.** Educational analysis only. Trading involves substantial risk of loss. Past patterns don't guarantee future results. Always do your own research and consult a SEBI-registered financial advisor. Author assumes no responsibility for losses.
#HCLTech #StockMarket #NSE #TechnicalAnalysis #ITStocks #IndianStockMarket #SwingTrading #Trading #FinTwit #TradingView #ChartAnalysis #StocksToWatch #Nifty50 #TechStocks
HINDALCO WEEKLY TRADE SHORT SETUPLogic : HINDALCO has made a strong more down . A supply zone formed with a broken prior pivot might be a good probability to short.
Take proper position size and Risk manegement.

BSE SHORT SETUPLogic : BSE has made double top on daily and weekly .
A supply zone at the marked levels with a broken pivot indicate a bearish move upcoming probability.

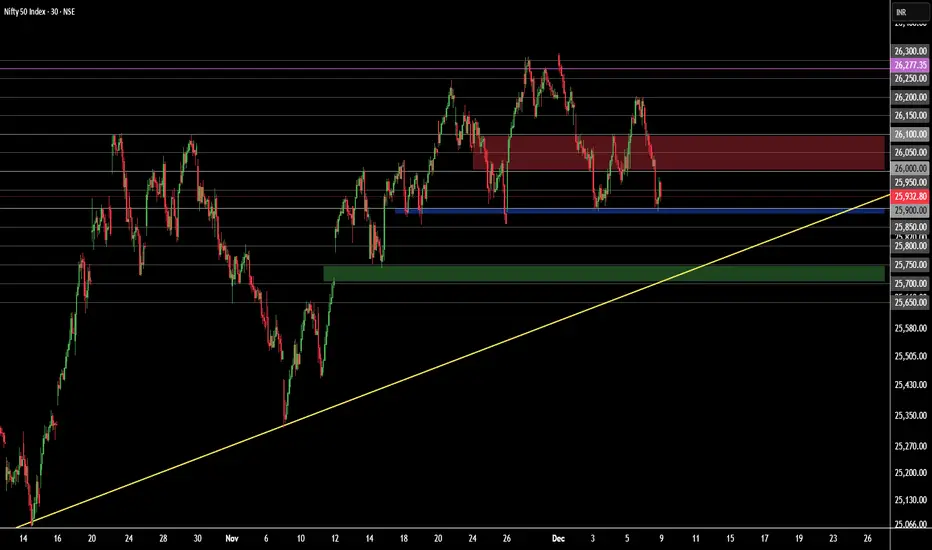
Nifty 50 Price Structure Analysis [08/12/2025: Monday]Top-Down Nifty 50 Price Structure Analysis for 08th December 2025. The day is Monday.
(1) Monthly Time Frame:
Red paper umbrella candle. The body is smaller compared to the lower wick. So far, it is an indecisive market. The main trend is bullish, but the present scenario is indecisive. The major support zone is at 26100 and 26000. Major resistance is at 26300. The view is bullish to indecision.
(2) Weekly Time Frame:
Red paper umbrella candle. The body is smaller compared to the lower wick. There is no upper wick. Thus, there is good buyer participation. Looking at the combination of 3 candles, buyers (or bulls) are getting stronger. The lower wicks are getting longer every week. For the past 3 weeks, the price has been taking very good support at the zone (25850 - 25900). In the present scenario, levels 26100 and 26000 are major support zones. Major resistance is at 26300. Considering, past 8 weeks, the price is in the structure of higher highs and lower lows. Thus, bullishness is intact. Take no bearish trade until the price starts to trade below the zone of 26100 - 26050. Presently, the view is bullish to indecision. If the price keeps sustaining above the level 26200, then probably, the previous all-time high (ATH) will be breached.
(3) Daily Time Frame:
The past 2 days are green days. On 05th December price gave a 200-point bullish rally. However, price is still in the range of the bullish marubozu formed on 26th November (Wednesday). Price needs a stable movement above the level 26200. Presently, 3 levels have emerged as a strong support zone - 26100, 26050, and 26000. So, take no short position unless the price starts to trade below 26000. Any downward move should be doubted. The view is bullish to indecision as the previous ATH and level 26300 are very close.
(4) 30-Minute Time Frame:
The complex correction since 17th October 2025 continues. Presently, price is trying to trade in the upper zone of the rising channel. The direction of the complex correction is bullish but with high volatility and indecisive moves. A strong support zone is formed at the levels 26100 - 26000. A minor resistance is at 26200. Major resistance is at 26300 and the previous ATH (26277.35). Every down move should be doubted. Institutional bias is bullish. The view is bullish.
Event:
No expiries on Monday. No high-impact event. However, the U.S. Fed Interest Rate Decision is on 11th December (Thursday) - a high-impact event in the next week.
Bullish Scenario Set-Up:
(i) Price sustains above the opening price.
(ii) Price sustains above the level 26200 and shows promise of reaching levels 26277.35 (ATH) and level 26300.
Bearish Scenario Set-Up:
(i) Price sustains below the opening price.
(ii) Price starts to sustain below the level 26050 and starts to form a lower lows, lower highs structure below 26000.
No Trading Zone (NTZ): 26200 - 26100.
Expectations (Hypothesis and Insights from Trading Plan):
(i) Take bullish trades only. Price must start to trade above the level 26200.
(ii) Every down move should be doubted. Levels 26100 - 26050 are very strong support.
(iii) Be skeptical of executing trades in the first half of Monday, as level 26277.35 (previous ATH) and level 26300 are close. Also, in case of a gap up or a gap down, be very cautious. A clear price structure is needed for trend clarity.
(iv) Trade only when bullish/ bearish conditions are fulfilled. Otherwise, don't trade. Protect your resources.
NOTE:
"Mark your points. Trade your points. Price is God. Anything can happen. Therefore, trade what you see, not what you believe."
Happy Trading!

Havells at multi TF support 1. Price is at monthly 50 EMA, could prove to be a good supply point.
2. In weekly, Price at 200 SMA. Also, the RSI is at support level of 40.
3. Daily RSI showing bullish divergence & Price is at support trendline.
All these supports from multiple timeframes could constitute a reversal for long-tern in Havells. Trade is risk-reward favorable. SL to planned as per own analysis.
P. S. - Not a SEBI registered analyst & definitely not a buy recommendation. Please do your due diligence before planning to buy.

No clear direction yet!As we can see NIFTY couldn't break either side of the dojo candle despite its strength showing signs of indecision hence as long as we are between that range, we should remain unbiased and trade according to market sentiments so plan your trades accordingly and cautiously.

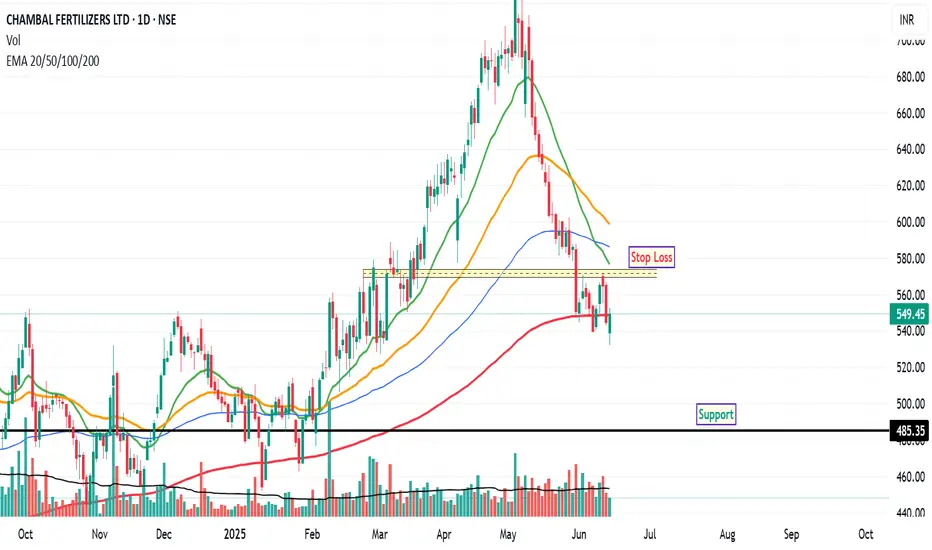
Chambal Fertilizers: Exhibits Short-Term WeaknessChambal Fertilizers has recently displayed signs of short-term weakness on its daily chart. The price action indicates a struggle to maintain a position above the 200-day EMA, a widely recognized long-term trend indicator. Despite multiple attempts to close above this crucial level, the stock has been unable to sustain any significant upward momentum, suggesting a prevailing bearish sentiment among market participants.
From a momentum perspective, both the RSI and MACD indicators are currently positioned in what is typically considered the oversold territory. This could imply that the stock has experienced a period of significant selling pressure.
Should the current trend persist, the stock may potentially retest the ₹485 level, which could act as a significant support zone. Conversely, a potential shift in market dynamics could occur if the stock manages to close and sustain above its 200-day EMA for a minimum of two consecutive trading sessions. In such a scenario, traders might consider a revised risk management strategy, with potential stop-loss levels in the range of ₹569 to ₹573 , based on recent price action and potential resistance.
Disclaimer: The information provided in this stock analysis is for informational and educational purposes only and should not be construed as financial advice. Always seek the advice of a qualified financial advisor or conduct your own thorough research before making any investment decisions.
Coforge (D): Strongly Bullish, Triple Top BreakoutTimeframe: Daily | Scale: Linear
The stock has confirmed a major breakout from a 6-month consolidation structure. By closing above the triple-test resistance zone, the "bearish" triple top pattern has been invalidated and converted into a bullish breakout .
📈 1. The Long-Term Structure (The Reversal)
> The Cycle:
- Peak: ATH of ~2,005 in Dec 2024.
- Correction: A downward spiral until April 2025 .
- Turnaround: Since April, the stock has shifted structure to Higher Lows , indicating buyers are stepping in aggressively on dips.
> The "Lid" (Resistance Zone): The 1,951 – 1,959 zone acted as a stiff resistance, rejecting the price three times (ATH, July 2025, and recently). This made it a "Triple Top" barrier.
💥2. The Breakout (Today's Action)
> Pattern Shift: Today, the stock finally **closed above** this resistance zone (1,951–1,959).
- Technical Significance: A close above a Triple Top resistance negates the bearish reversal and triggers a powerful continuation breakout .
> Volume Confirmation: The surge of 2.81% was backed by 3.12 Million in volume. This expansion (after a period of decreasing volume) confirms that "smart money" pushed the price through the wall.
📊 3. Technical Indicators
> RSI: Rising in Monthly, Weekly, and Daily timeframes.
- Caution: Watch for Bearish Divergence (Price making a higher high while RSI makes a lower high) as the stock approaches its ATH.
> EMAs: The PCO (Positive Crossover) state across all timeframes confirms the trend is synchronized to the upside.
🎯 4. Future Scenarios & Key Levels
With the "lid" at 1,960 removed, the path is open to retest the highs.
> 🐂 Bullish Targets:
- Target 1: 2,005 (The ATH). This is the immediate magnet.
- Target 2: Blue Sky . A sustained close above 2,005 puts the stock in price discovery mode.
> 🛡️ Support & Re-test:
- The "Safe" Entry: Waiting for a re-test of the 1,951–1,959 level is the prudent strategy. If the stock pulls back and bounces from here, it confirms the breakout.
- Stop Loss: If the stock falls back below 1,920 , it would signal a "fakeout" and likely trap the new buyers.
Conclusion
The breakout is valid. The "Triple Top" is no longer a threat; it is now a launchpad. Watch for the stock to hold above 1,951 to confirm the move toward 2,005 .

Is this a sign of REVERSAL!?As we can see NIFTY has formed more like a doji candle which shows immense indecision despite the strong weakness. It can also be been that this candle has been formed around the trendline hence unless this candle's low is broken and sustained below, every dip can bought. So, plan your trades accordingly and keep watching everyone.

Will NIFTY take support at 26000 !?As we can see finally fell from our level as soon as it broke and fell unidrectionally as analysed. Moreover we can see it is trading around important psychological level of 26000 which is also a important demand zone, moreover it is also trading at important trend line support so any signs of rejection from this trend line could show strong reversal so plan your trades accordingly and keep watching everyone.

KOTAK Bank: Weekly Liquidity Sweep → H4 MMBM Signals Buy-Side ExI am sharing a trading idea on Kotak Bank based on Smart Money Concepts (SMC).
Price has already taken weekly ERL (External Range Liquidity) and then moved back into IRL (Internal Range Liquidity), indicating a higher-timeframe liquidity grab and potential rebalancing phase.
On the H4 timeframe, price is forming a Market Maker Buy Model (MMBM).
The sell-side curve has been completed, suggesting downside liquidity has been fully taken. After this, price has started transitioning into the buy-side curve, which points toward a possible bullish expansion.
This structure suggests that smart money may now seek buy-side liquidity, provided price continues to respect higher-timeframe structure and holds above key demand areas.
This idea is for educational purposes, and confirmation should be taken using proper entry models, risk management, and market conditions.

Still INDECISION despite the unidirectional fall!As analysed NIFTY did fell and had been unidirectional despite its strong opening as it couldn't sustain itself above its ATH which was well anticipated and has been analysed in our previous post. Now, despite the fall, it couldn't close itself below 26150-26100 level which could have confirmed to weakness. so, one must trade once these levels are breached and sustained.

Nifty 50 Analysis (Based on Your 4H+1D Chart ) Key Observations from Your Markups (ICT Style):
1. Price is sitting inside a 4H FVG (26,110–26,170 zone)
This is acting as intraday demand / discount region.
Price bounced here previously and is testing it again.
2. Multiple PDH levels above + Weak High at ~26,320–26,350
This cluster suggests **liquidity resting above.
If price reclaims PDH → expect a sweep toward the weak high.
3. PDL is protected (~26,070–26,090)
Clean liquidity pool below.
A sweep into PDL + FVG confluence gives high-probability long setup.
4. Daily chart shows rejection from the supply zone (26,300–26,380)
But the structure is still **bullish BOS → continuation** unless 25,950 breaks.
---
📌Tomorrow’s Probable Scenarios
🟢 Bullish Setup (Higher Probability)
Entry Zone:
➡️ 26,080–26,120 (PDL + 4H FVG + discount)
Entry Trigger:
W-pattern
BOS on 5m/15m
Stop-run below today’s low
Targets:
1. 26,240
2. 26,310 (PDH)
3. 26,350–26,380 (Weak High / liquidity sweep)
Stoploss:
➡️ Below 25,980 (structure invalidation + 4H FVG break)
---
🔴 Bearish Setup (If 26,300 is rejected again)
Entry Zone:
➡️ 26,300–26,350 (weak high + PDH cluster)
Targets:
1. 26,180
2. 26,110 (FVG midpoint)
3. 25,980 (PDL & liquidity)
Stoploss:
➡️ Above 26,380 (clean invalidation)
NIFTY can show unidirectional move from here!As we can see NIFTY is showing signs of indecisiveness from its ALL TIME HIGH and as per previous post, we also discussed previous swing can act as a resistance. We can expect NIFTY to show strong upmove above 25300 based on strong GDP quarterly posting hence we must keep these levels under observation and plan our trades accordingly.
