Karnataka Bank (W): Bullish, Vol-Backed Breakout at ResistanceTimeframe: Weekly | Scale: Logarithmic
The stock has confirmed a breakout from a 10-month angular downtrend. This move is backed by the highest weekly volume in years, driven by smart money entry. However, the stock is currently pausing at a critical horizontal supply zone.
🚀 1. The Fundamental Catalyst (The "Why")
The massive 149 Million volume is a direct reaction to a major news event:
- The Catalyst: Reports indicate that high-profile investors have picked up a significant stake (approx. ₹71 Crore worth) in the bank.
- Implication: When "smart money" enters with such heavy volume, it often signals a structural floor is being created. This gives high conviction to the technical breakout.
📈 2. The "Dual" Breakout Structure
- Angular Resistance (CLEARED): The stock has decisively broken and closed above the angular trendline from the Jan 2024 ATH. This signals the end of the lower-highs (downtrend) structure.
- Horizontal Resistance (PENDING): The ₹211 – ₹213 zone is acting as a stiff "Polarity Zone" (Support turned Resistance).
- The Action: The stock pierced this level intraday (High ~₹220) but faced profit-taking to close near ₹212-213 .
- Interpretation: The inability to close decisively above ₹213 suggests some supply remains. The bulls have breached the gate but haven't fully conquered the castle yet.
📊 3. Technical Indicators
- Volume: The 149M volume is a "Game Changer." It confirms that the trendline break is valid. Even if the price dips, this volume suggests dips will be bought.
- EMAs: The PCO state on Weekly/Daily confirms the trend shift.
- RSI: Rising in Monthly & Weekly, indicating sustained momentum.
🎯 4. Future Scenarios & Key Levels
The strategy now hangs on the ₹213 level.
> 🐂 Bullish Case (Confirmation):
- Trigger: A decisive daily close above ₹213 .
- Target 1: ₹250 . Once ₹213 clears, the stock enters a thin resistance zone, making ₹250 achievable quickly.
- Target 2: ₹286 (ATH).
> 🛡️ Support (The Re-test):
- Immediate Support: ₹193 . If the rejection at ₹213 leads to a pullback, the stock must hold ₹193 to keep the bullish structure alive.
- Buy Strategy: Since the trendline is broken, any dip toward ₹200-205 (retesting the broken trendline) is a high-probability entry zone.
Conclusion
This is a Grade A setup due to the sheer volume participation. The trend has shifted. While the close above ₹213 was missed by a whisker, the volume suggests it is only a matter of time. Watch for a close above ₹213 to enter long positions.
Multiple Time Frame Analysis

ATH is here for NIFTY! What's next!?As we can see NIFTY has finally achieved new ATH which also a previous swing and as per technical POV, this swing can act as a RESISTANCE. Hence any signs of rejections from here can be considered an opportunity to short. moreover, no fresh positions should be made at current levels.

Strong PSU Bank - Indian Bank - Strong BuyIndian Bank - Swing to Short-Term Investment Report
Current Price: 653.10
TECHNICAL SETUP OVERVIEW
Analysis Type: Monthly Chart | Investment Horizon: Short to Medium Term (6-18 months)
Key Observation: After a historic breakout from multi-year resistance, Indian Bank has established itself as a solid structure for accumulation with exceptional return potential.
BREAKOUT TIMELINE & PATTERN
Historical Resistance Battle (2018): Successfully tested 5 consecutive months.
Major Breakout (January 2024) Clean breakout above 2018 resistance level, Significance 6-year base breakout - high probability setup - Follow-through Strong momentum confirmed.
Bull flag Pattern formation, Price Range: 632-736. Building energy for next leg up
Structural Advantages:
1. Clean Breakout Pattern
- No false breaks or whipsaws
- Volume confirms genuine buying
2. Multiple Timeframe Confluence
- Monthly, weekly, daily all aligned bullish
- No conflicting signals
- High probability continuation
3. Measured Move Projections
- Targets based on historical patterns
- Flag pole height projects to 1,050+
- Conservative targets: 813-973
4. Fundamental Support
- PSU bank re-rating theme intact
- Improving asset quality
- Growing dividends (35% YoY growth)
- Strong Q4 profit growth (+31.56%)
Disclaimer: For educational purposes only. Manage risk appropriately and do your own research.
🎯 Trade Smart. Trade Safe. Accumulate Quality.

Cholafin Long - Investment Ideas & AnalysisTechnical Analysis : Cholamandalam Investment and Finance Co. Ltd.
Current Price: 1,610.30
Multi-Timeframe Technical Analysis
Weekly Timeframe Pattern
The stock has formed a **Cup and Handle** pattern on the weekly chart, which is traditionally considered a bullish continuation pattern. This pattern suggests potential accumulation and a possible breakout scenario.
Daily Timeframe Analysis
On the daily chart, a * *Bullish Pennant* * formation has developed, indicating consolidation after a strong upward move. This pattern typically suggests continuation of the prior trend once a breakout occurs.
Key Technical Levels
Fibonacci Retracement Levels:
- 0 Level: ₹1,491.20
- 0.5 Level: ₹1,567.70 (approximate support zone)
- 0.618 Level: ₹1,595.45 (golden ratio support)
- 1 Level: ₹1,644.20
- 1.272 Level: ₹1,685.80
- 1.414 Level: ₹1,707.55
Current Price Action:
The stock is trading near ₹1,610.30, positioned between the 0.618 and 1.0 Fibonacci levels, suggesting a mid-range consolidation zone.
Upside Targets
If the bullish patterns play out and the stock breaks above recent resistance:
- **Primary Target:** Based on the Fibonacci extension, the measured move suggests potential toward ₹1,685-₹1,708 range
- **Pattern Target:** The Cup and Handle height projection aligns with Fibonacci extension levels
Support Analysis
- **Immediate Support:** ₹1,595-₹1,600 zone (0.618 Fibonacci level)
- **Strong Support:** ₹1,567 region (0.5 Fibonacci level)
- **Major Support:** ₹1,491 (pattern base/0 level)
With Nifty made a Bounce back and if the rally continues, adds advantage for the stock to break previous resistance." This highlights the **correlation with broader market sentiment** (Nifty index), suggesting the stock's performance may be influenced by overall market conditions.
Swing Trading Perspective
For short-term traders, the Cup and Handle height provides a **measured move target**. However, confirmation of breakout above resistance with volume would be essential before entry.
**Disclaimer:** This is a technical analysis based on chart patterns and historical price action. This is not financial advice. Traders should conduct their own research, consider risk management strategies, and consult with financial advisors before making trading decisions. Past performance does not guarantee future results.

Canarabank - Short Term BuySImple Technical Analysis.
Multiple PSU stocks are forming Flag&Pole pattern.
Canarabank - Hovering around Prev ATH.
Pattern BO will lead to 139.
Prev High Breakout will lead the Stock to 139/143/152/169.
Target Levels Based on Pattern target and Fibonocci Levels

Strong RECOVERY and CLOSING! What's next!?As we can see NIFTY showed strong upmove but we still need confirmation of weekly candle for bull run continuation hence following the structure, we may see a continuation of upmove but will only be confirmed if candle closing is seen in weekly time frame so plan your trades accordingly and keep watching everyone.
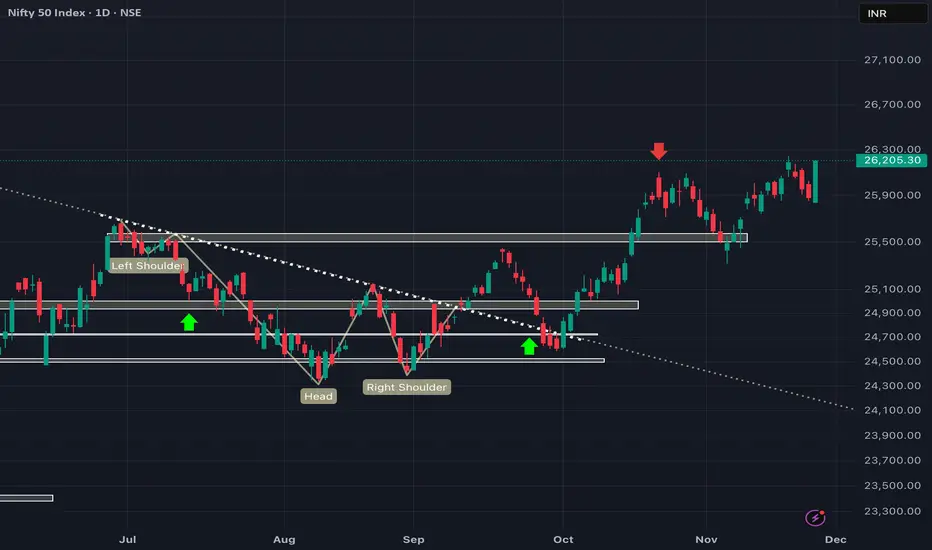
SHARP recovery coming up above 26000!?As we can NIFTY closed below 26000 which was against our expectations and was only valid if we were above 26000 levels. Now as long as we are below 26000, we are bearish until we sustain above 26000 for another strong upmove so plan your trades accordingly and keep watching everyone.

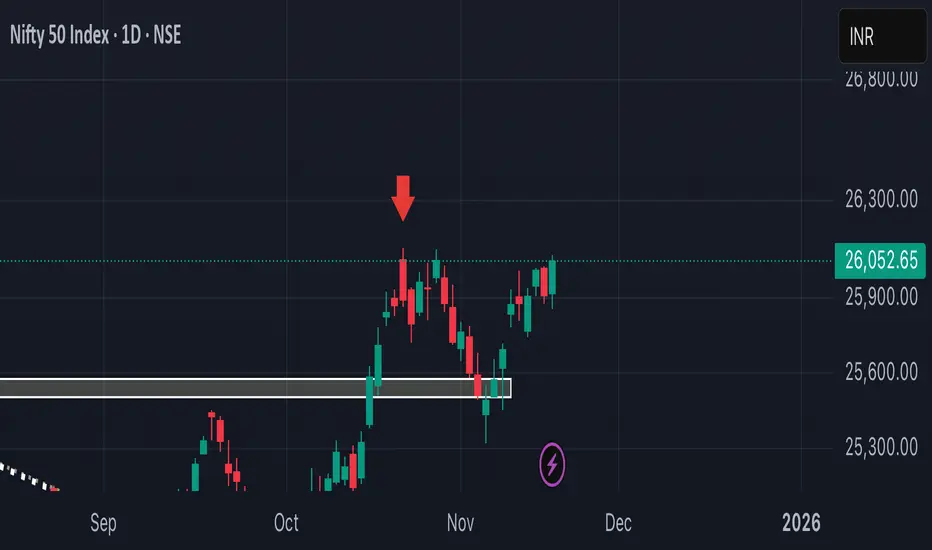
26000 will act as a SUPPORT now!As we can see NIFTY managed to close itself above 26000 level which was both a strong resistance and psychological level and closes both in daily as well as weekly time frame. Hence, following the structure we can confirm the NIFTY’s breakout and we can expect NIFTY to take support at 26000 levels which previously acted as a resistance. So, one can plan their trades accordingly keeping SL on closing basis below 25800 .

Strong upmove coming up above 26100!As analysed, following the structure, we can still see NIFTY in more like an inverted head and shoulders pattern which is a strong bullish pattern. Hence now that it has managed to close above 26000 which has already been tested multiple times before can now show a very strong upmove above 26100 which is a neckline of the structure so one can go long if breaks above given level so plan your trades accordingly and keep watching everyone.
NIFTY got rejected from 26000! Weekly closing needed.As we can see NIFTY got rejected exactly from psychological level and important supply zone. Moreover, we can see it has been forming more like inverted head and shoulder pattern in bigger time frame. Any strong closing above 26000, can show strong upmove but until that we may see sideways to weak market so plan your trades accordingly and keep watching everyone .
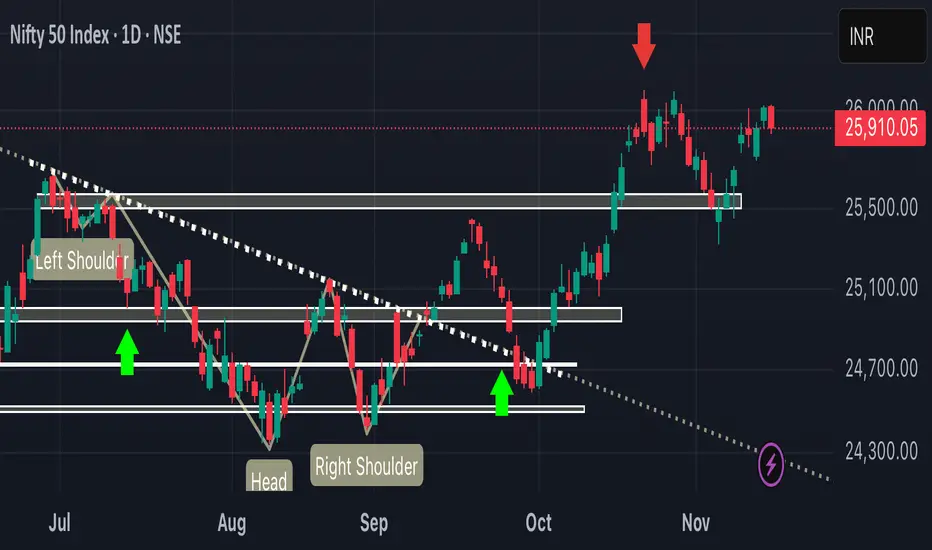

Did NIFTY just turned bullish!? As we can see NIFTY managed to close itself above 26000 showing a bullish bias. Moreover, we can see NIFTY forming more like an inverted head and shoulders pattern in bigger time frame which is a strong bullish signal as this level has been tested multiple time making it weaker hence any closing above previous swing can show strong upmove! So plan your trades accordingly and keep watching everyone.

NIFTY looks WEAK as long as it doesn't closes above 26000!Following our analysis, NIFTY couldn't close itself above 26000 mark despite showing strong upmove which was induced by NDA winning over BIHAR which shows political stability in INDIA. On the other hand, despite the recovery, NIFTY couldn't close itself above 26000 mark which shows the lurking weakness which might come in coming trading sessions so plan your trades accordingly and keep watching everyone.

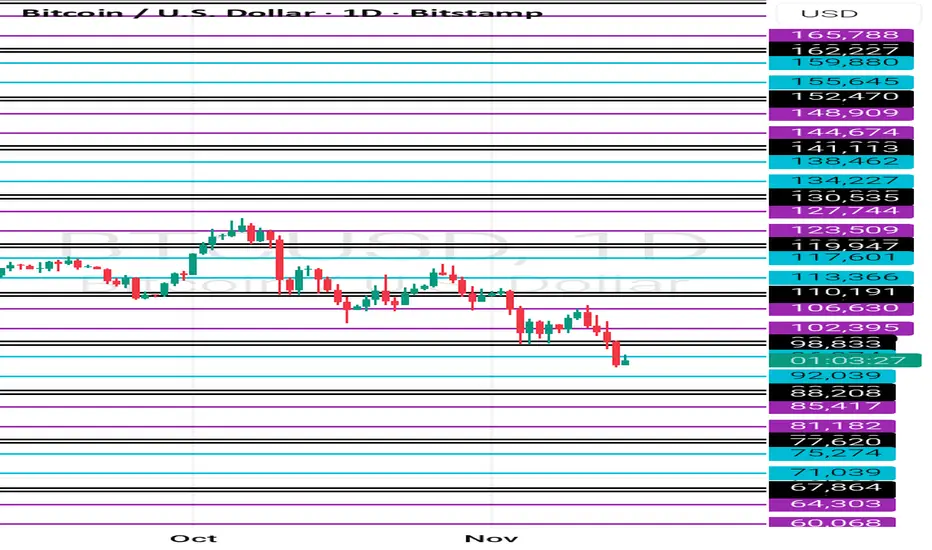
Btc weekly cycle study How to study this range find starting point range pink line to pinnk line starting point blue line to beetwin range
CERA – Demand Zone Confluence Supporting Bullish OutlookCERA has exhibited a notable price reaction from its Quarterly Demand Zone 📊, where price absorbed existing buy orders and initiated an upward movement 🚀. This reaction area coincides with the Yearly Demand Zone 🧭, thereby forming a strong confluence zone 🔗 that reinforces its structural significance.
On the Monthly timeframe 📅 , the active Demand Zone overlaps both the Monthly and Yearly Demand Zones . Such multi‑timeframe alignment ⚙️ typically represents a high‑probability support region 💪. Following the initial reaction from this area, price demonstrated a sustained upward move 📈 and established a new, untested Monthly Demand Zone 🟩.
Currently, the price is retracing toward this newly‑formed Monthly Demand Zone 🔄. The retracement is particularly significant because it occurs without any observable reaction from a higher‑timeframe supply zone 🚫🏗️. This suggests that the zone’s underlying demand remains intact 💼, and that the market is approaching an area of potential accumulation 🏦.
Additionally, the Weekly chart 📅 reveals that the current zone coincides with a Monthly Demand Zone 🧱, providing further confirmation of institutional-level support 🏛️. Overall, the technical setup indicates a favorable environment for a potential bullish reversal or continuation from this demand area 🔥📈.
📌 Conclusion
CERA is currently positioned within a multi‑layered structural support zone 🧱 that reflects strong institutional interest and demand alignment across timeframes. The fresh Monthly Demand Zone, combined with Yearly and Quarterly confluence, strengthens the bullish bias.
Unless price invalidates the zone through a sharp breakdown with high volume, the technical structure remains biased to the upside 🚀, favoring long accumulation setups and positioning this level as a potential launchpad for the next impulsive move 💫

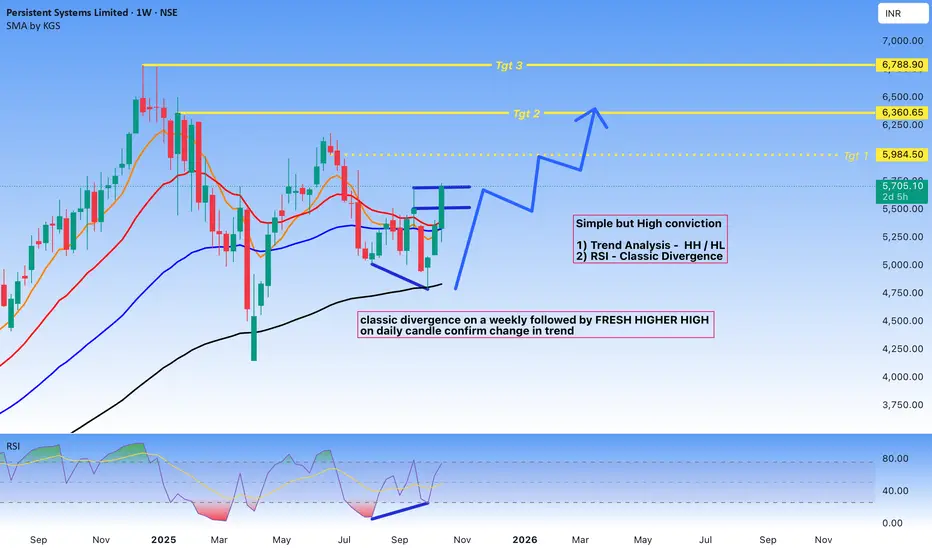
Persistent Technical Analysis#Persistent Systems Limited - Technical Analysis
Chart Overview
**Timeframe:** Weekly (1W)
**Current Price:** 5,708.20
Technical Setup
Trend Analysis
The chart displays a compelling technical setup based on higher highs and higher lows pattern analysis. After a significant correction from previous highs, the stock has formed a strong base and is showing signs of trend reversal.
Key Observations
RSI Classic Divergence
The Relative Strength Index is displaying a classic bullish divergence pattern. While price action formed lower lows during the correction phase, the RSI formed higher lows, indicating weakening bearish momentum and potential trend reversal. This divergence has been confirmed on the weekly timeframe, adding significant weight to the bullish case.
Fresh Higher High Confirmation:
Following the divergence, price action has broken above the previous swing high on the daily candle, confirming a potential change in trend structure. This break represents a shift from the previous pattern of lower highs and suggests renewed bullish momentum.
Price Targets
The analysis identifies three potential target zones:
- **Target 1:** 5,984.50 (Immediate resistance)
- **Target 2:** 6,360.65 (Medium-term target)
- **Target 3:** 6,788.90 (Extended target)
These targets are derived from previous resistance levels and Fibonacci extension analysis.
Moving Averages:
The chart shows multiple moving averages (likely 50 SMA and 200 SMA based on the red and orange lines). Price is currently attempting to reclaim these key moving averages, which would further validate the bullish thesis.
Risk Considerations
While the technical setup appears favorable, traders should consider:
- Confirmation on higher timeframes for reduced false signal risk
- Volume analysis to validate the breakout
- Proper risk management with stop-loss placement below recent swing lows
## Disclaimer
This is a technical analysis for educational purposes only and should not be considered as financial advice. Always conduct your own research and consult with a qualified financial advisor before making investment decisions. Past performance does not guarantee future results.
BankofIndia - Short to Long Term Investment BuyBank of India - Technical Analysis
Current Price: 129.77
Timeframe: Monthly Chart
Key Technical Observations
1. Currently, PSU banks are exhibiting bullish characteristics with positive sector support influencing the stock positively.
2. Cup and Handle Formation - The stock is displaying a gradually developing cup and handle pattern, a classic bullish continuation setup that suggests potential upside momentum.
3. Rising Channel Support - Bank of India is actively trading within and supported by a rising channel, indicating strength in the uptrend structure.
4. Historical Strength Pattern - Over the years since 2021, the stock has been making higher highs and has recently completed a decent retracement, suggesting a bounce-back scenario in formation.
5. RSI Hidden Divergence Confirmation -A hidden divergence has been identified on the RSI indicator, providing additional technical confirmation for trend continuation.
Potential Target Levels
Based on technical analysis:
- 20% Move: 155.40
- 50% Move: 194.70
- 77% Move: 232.00
Risk Management
Strict Stoploss: 99.18 on Weekly candle closing basis
DISCLOSURE & RISK WARNING:
This analysis is provided for educational and informational purposes only and should not be construed as financial advice, investment recommendation, or an offer to buy or sell securities. Past performance is not indicative of future results.

EXACT rejection from 26000!! What's next!?As we can see NIFTY did achieve our target of 26000 as expected and got rejected exactly from there which was well analysed in our previous post about the possible rejection being both a psychological level and important supply zone. Now that we have seen strong rejection, we can expect NIFTY to remain negative in coming trading sessions unless it manages to sustain itself above 26000 levels so plan your trades cautiously.

26000 coming up again!!As we can see NIFTY showed strong upmove which was expect as it closed itself above previous candles high and met all our criteria's for confirming its strength. Moreover, we can see no immediate RESISTANCE that can cause NIFTY to reject. Hence sticking to our analysis, we may see NIFTY heading towards 26000 level being a strong supply zone and psychological level so plan your trades accordingly and keep watching everyone.

GU Shorts 12/11/2025As discussed earlier looking for price to move into the daily FVG on either EU or GU, there's SMT on Daily Time frame between these bros at the highs, and we're in a bearish orderflow, so I'm looking for a continuation setup in Newyork, selling from the bearish FVG if MY SETUP FORMS THERE.
There's also smt at the lows and if it invalidates the bearish FVG I'll not be taking any trades.
Thank you and manage your risk bois.
Keep Winning!

NIFTY just turned BULLISH!!As we can see NIFTY managed to close above previous swing and as per our analysis, its a sign of REVERSAL, moreover we can see it is getting rejected from a psychological level and a very strong demand zone hence we may now expect NIFTY to continue its bull run as long as it sustains itself above 25500.

EURUSD Trade Idea Shorts Tuesday/Wednesday WASUPPP LADSSS!
Yeah EU/GU are in a bhllish orderflow, I'm expecting them to continue higher but not before retracing back into the daily bullish Fair Value gap. So GU has printed a H4 Bearish FVG and there's smt between EU and GU on the Daily Time Frame. I'm expecting a second smt to push price lower into the daily fair value gap before continuing upwards, so short term i would be looking for sells.
So this is the plan, in London -
If price creates an smt divergence with DXY/GBP/USDCHF I would look for shorts to the daily bullish fair value gap, this is basically an ERL to IRL play.
This is just an idea, it has necessary conditions which need to be met to be acted upon, like smt and a bearish orderflow on the 15m timeframe. If these two conditions are met I would look for shorts, unless price decides to continue going higher. Thank you and keep winning!!!

NIFTY managed to close above 25500 but still looks weak!As we can see despite its close above 25500, Nifty can be seen forming more like an induction candle in daily time frame showing confusion and bearish power in the charts. Taking these in consideration, we can expect NIFTY to remain sideways to negative until it manages to close above previous candles high so plan your trades accordingly and keep watching everyone.
