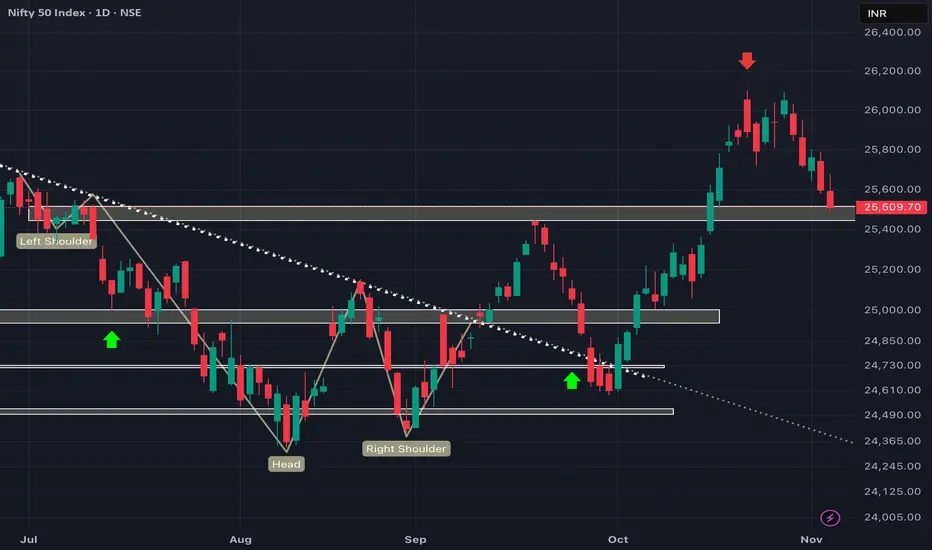
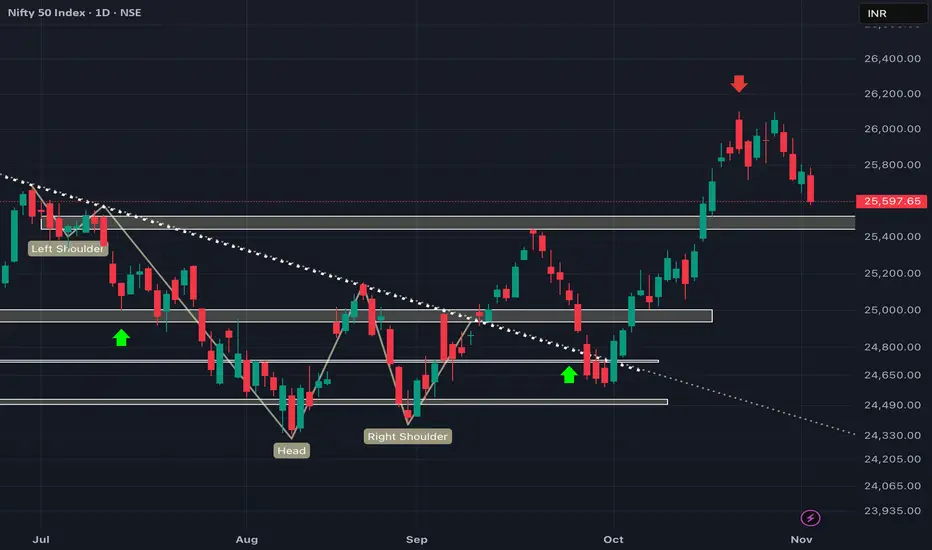
NIFTY managed to close above 25500 but still looks weak!As we can see despite its close above 25500, Nifty can be seen forming more like an induction candle in daily time frame showing confusion and bearish power in the charts. Taking these in consideration, we can expect NIFTY to remain sideways to negative until it manages to close above previous candles high so plan your trades accordingly and keep watching everyone.
Multiple Time Frame Analysis

Trade Journal 4th trade -:10/11/25 - GBP SellWassup Lads!
So this was a trade I took which I exited at B.E., it was a risky sell - basically a counter trade in a bullish orderflow. I took it but exited it on a small profit because I was not feeling confident.
Anyway talking about the trade, this was totally a time based setup -
The reason for the trade -
1. SMT Divergence between EU and GU on the daily time frame
2. Second Stage SMT between EU and GU (London highs)
Two stage SMT confirmed the reversal but I didn't have much confidence considering the overall bullish orderflow.
Keep winning bois!

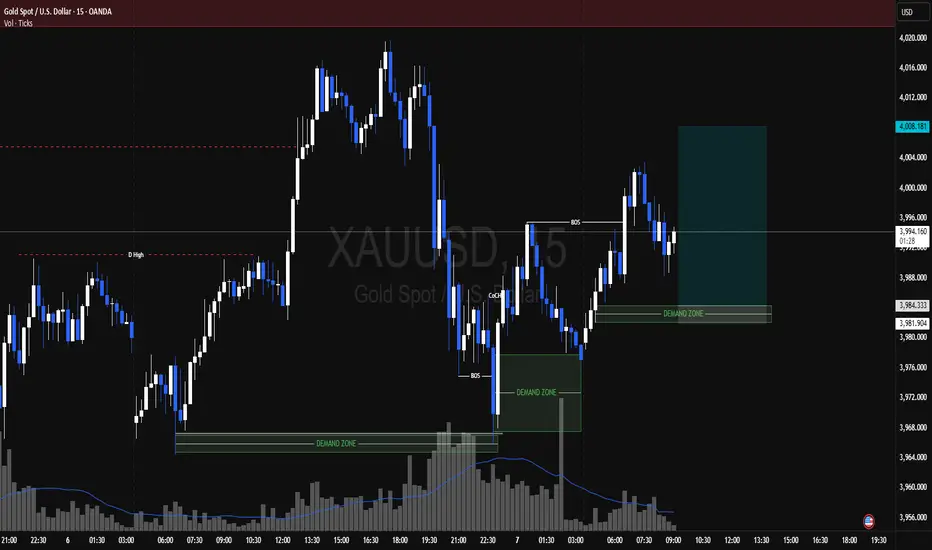
XAUUSDGold is almost at the Supply. There might be possibility of reversal from here. Buy side liquidity is done. Now it can start targeting sell side Liquidity.

XAUUSDGold is in bullish phase. It can retrace back to the demand zone in near future. Keep patience and wait for it to tap into the demand. Target whatever the recent new high would be, just above that.

XAUUSDGold is in Last phase of clearing sell side liquidity. Wait for the price to hit the supply and show rejection. It can fall down to the temporary support or demand zone. Then again can built Sell side liquidity . Keep Patience. price might go down first before hitting the supply zone.

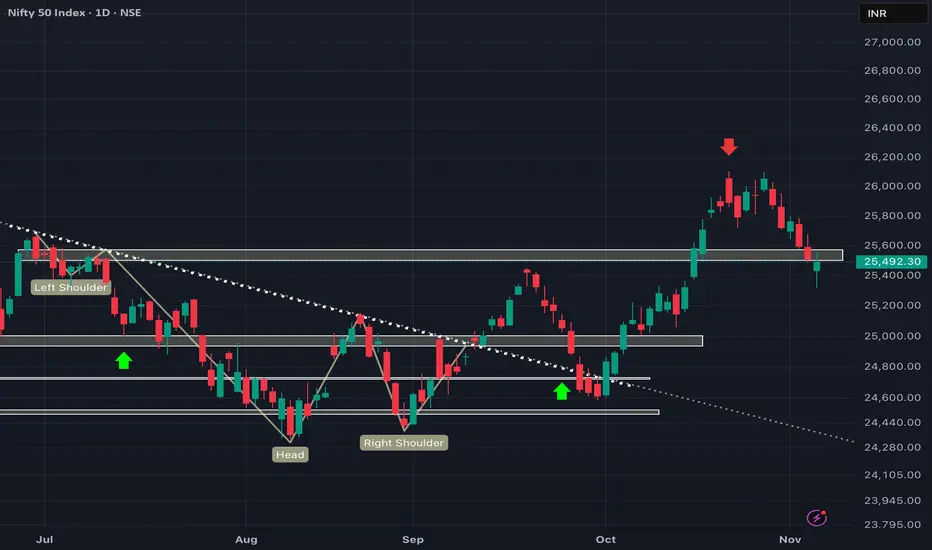
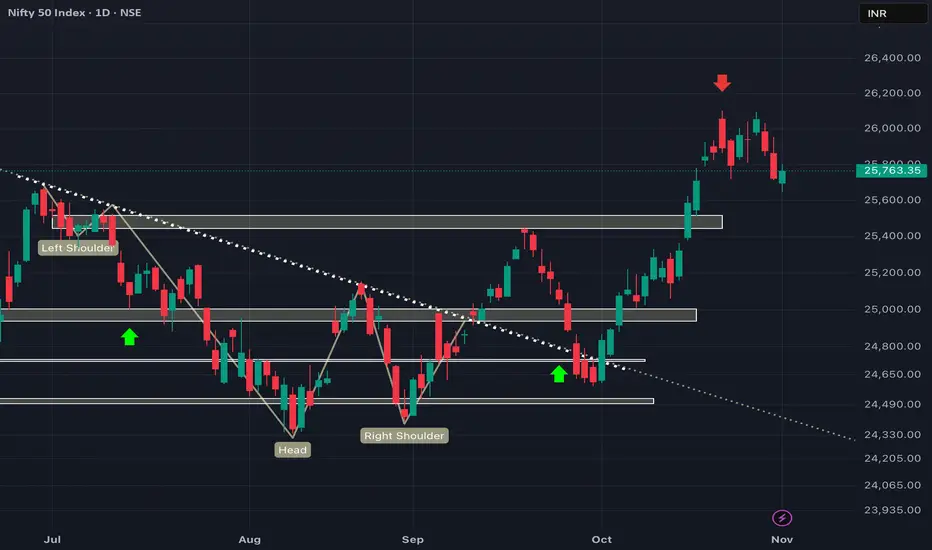
How will 25500 act now! As a SUPPORT or RESISTANCE!?As we can see NIFTY showed strong recovery despite opening weak exactly as analysed bt failed to close above 25500 which could potentially make 25500 psychological level as STRONG DEMAND ZONE TURNED SUPPLY ZONE but will turn void if opens gap up and sustains itself above 25500! 25500 can be ascertained as a SUPPLY ZONE only if NIFTY despite opening strong fails to hold itself above 25500 and closes below so keeping all these important points in mind, plan your trades accordingly.
BTCUSDT Outlook 08/11/2025So right now, what I’m seeing on crypto today — honestly, it’s the weekend, and that’s never the best time to look for high-probability setups. But if we ignore the timing for a second and just focus on structure, I’m leaning bearish.
On the daily, the flow’s clearly bearish. ETH already cleared the daily FVG and showed SMT divergence with BTC, while Bitcoin couldn’t even take out the highs — basically an SMT sell setup between the two.
On the H4, you can spot the second stage of SMT divergence — one up at the top, and another with the previous candle.
Price looks like it wants to pull back and roll over from here.
So yeah, I’m kinda expecting a red weekend for BTC, as long as this structure keeps holding

XAUUSD BUYGold is in a consolidation before pushing up. these are internal structure level for small trade.
if it comes down to Nearby small demand we can see a small buy orders pushing price to supply.
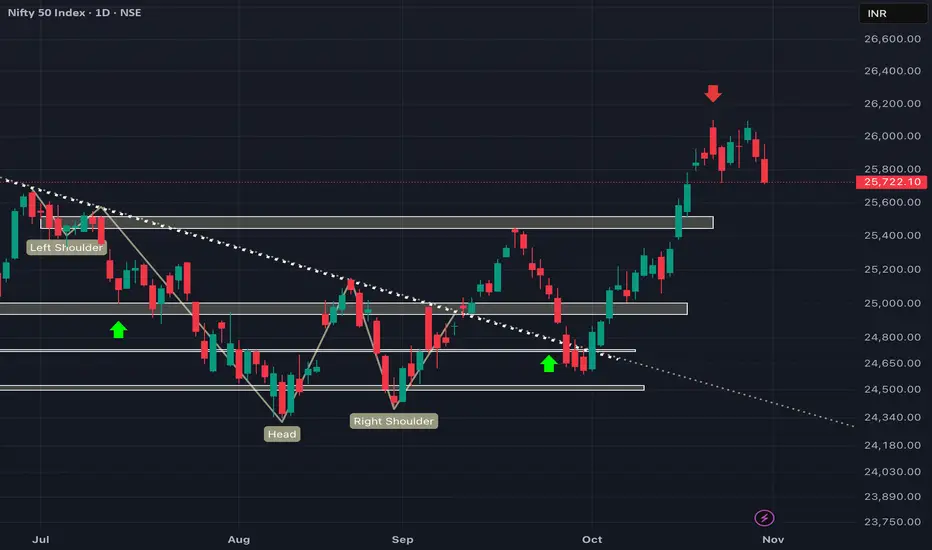
TARGET ACHIEVED!! Where are we heading next!? EXPLAINED We are finally at our target exactly as analysed and our patience and belief in oneself did paid off. Now, following the global cues, we can still expect NIFTY to open weak and fall but we have to look at tomorrow's closing as it is not just a day's closing but also closing for the week. Now we keep our bearish bias on following our analysis which is aligning with our analysis unless signs of reversal is seen around 25500 so plan your trades accordingly and keep watching everyone.
RBL Bank -Multi-Year #Breakout After 4 Years of ConsolidationRBLBANK has broken out of a multi-year resistance zone after a long accumulation phase since 2020.
This type of structure often leads to sustained upside momentum if the #breakout holds.
📌 Breakout Zone: ₹280 – ₹300
📌 Current Price: ~₹327
📌 Structure: Higher Highs & Higher Lows
📌 Volume: Strong accumulation visible
📌 Trend: Strong uptrend above long-term trendline & EMAs
Key Levels
Immediate Resistances ₹360
₹425 (Major long-term level)
Supports
₹300 – breakout retest zone
₹260 (major swing support)
As long as price stays above ₹300, bulls remain in control 🐂🔥
Technical Highlights
✅ 4-year consolidation breakout
✅ Major downtrend line broken
✅ Strong volume confirmation
✅ Clean price action + trend continuation
View
Bias remains bullish as long as price holds above the breakout zone.
Breakout + retest setups may offer opportunities in trending markets.
Not investment advice — for educational chart analysis only. Always do your own research.

Bajaj Consumer Care - Multi Year #BreakoutBAJAJCONSUMER has finally given a strong multi-year breakout after consolidating for almost 4+ years ✅
📌 Breakout Zone: ₹285 – ₹295
📌 Current Price: ~₹307
📌 Volume: Increasing – confirms accumulation
📌 Trend: Higher Highs & Higher Lows structure intact
📌 EMA Support: Riding above EMA – strong momentum
This kind of long-term range breakout often leads to multi-month / multi-year uptrends if sustained 🏆
Next Major Zones / Targets
₹330
₹360
₹400+ (Long-term)
Support Levels
₹288 – breakout retest zone
₹260 (strong major support)
As long as price stays above ₹288, bulls in full control 🐂💪
📈 Positioning: Long bias (This is for educational analysis only, not investment advice. Please do your own research.
Chart Setup
✅ Multi-Year Trendline Break
✅ Price above 200 EMA & 50 EMA
✅ Strong volume breakout
✅ Bullish price action + momentum
Risk Management
Always trail stop-loss & manage position size.
Market me survive karna hi jeet hai✨

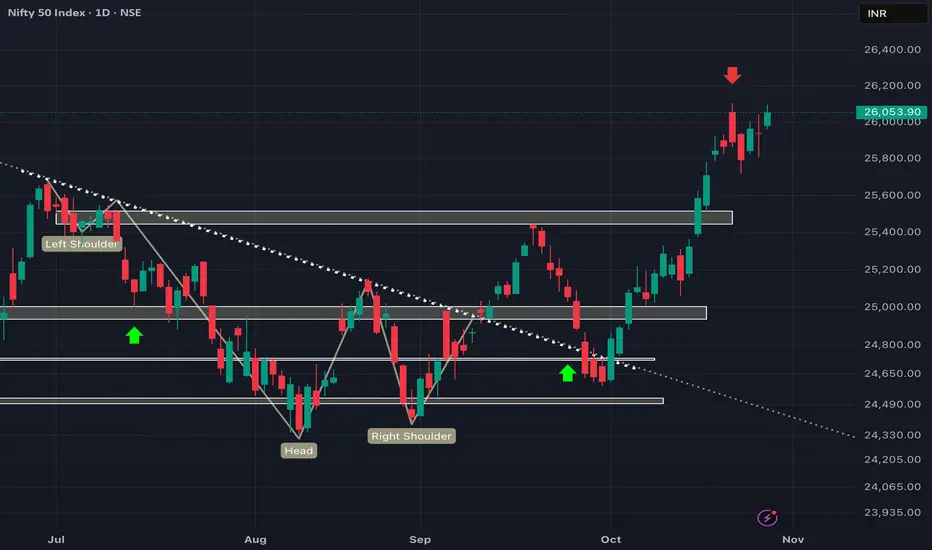
NIFTY getting closer to our target! What's next!?As we can see NIFTY fell more like unidirectionally exactly as analysed in our previous analysis and about to reach 25500 which had been our initial target. Now that it is about to reach our important demand zone, we may see NIFTY taking SUPPORT as this zone can act as a retest to the breakout and cam show substantial upmove from there if signs of REVERSAL is seen around the demand zone but if fails to take support and closes its candle below 25500 then that zone will act as a RESISTANCE which would lead to more fall so keeping all these in consideration, plan your trades accordingly and keep watching everyone.
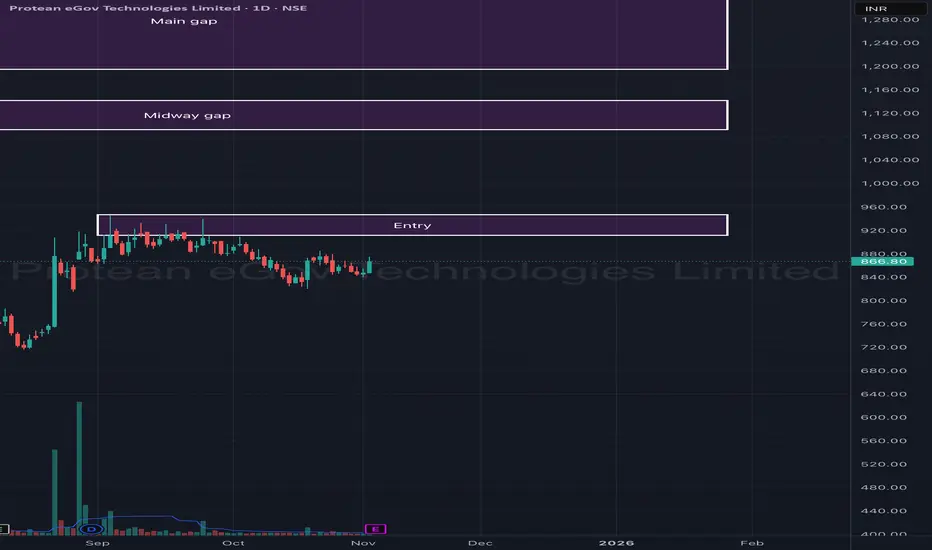
Protean eGov Technologies Ltd – Gap Fill Setup (Daily Chart)Protean eGov Technologies is showing early signs of base formation after a prolonged downtrend. The price is currently consolidating near the ₹850–₹880 zone, forming a potential accumulation structure that could lead to a gap-fill rally in the short to medium term.
The chart highlights two major unfilled gaps — a midway gap and a main gap — both acting as key upside targets once the current range breakout confirms.
🎯 Key Levels:
CMP: ₹866.80 (+2.25%)
Entry Zone: ₹850 – ₹880
Midway Gap Target: ₹1,100 – ₹1,150
Main Gap Target: ₹1,280 – ₹1,350
Stop-Loss: ₹820 (on daily close basis)
📊 Technical View:
Price consolidating after a steep decline — forming a base near support zone.
Volume spikes during accumulation suggest smart buying interest.
Breakout above ₹880–₹900 could trigger a gap-fill move toward ₹1,100+.
Short-term EMAs are flattening, indicating the downtrend might be losing momentum.
🧠 View:
Sustaining above ₹880 could confirm the beginning of a recovery phase. Watch for a breakout with volume to target ₹1,100 first (midway gap), followed by ₹1,300+ (main gap fill).
XAUUSDGold is approaching supply zone. From there it can fall to sweep sell side liquidity.
Then again continue to push up from Demand as soon as we get confirmation

DMart(Avenue Supermarts Ltd) – A Correction Inside a CorrectionOn the daily chart, DMart(Avenue Supermarts Ltd) appears to be unfolding a clean (a)-(b)-(c) correction within the ongoing downtrend from ₹4,949.50.
The initial leg down to ₹4,111 unfolded in five waves, marking Wave (a) of the correction. A relief rally is likely next — an expected Wave (b) move that could face resistance around the ₹4,500–₹4,600 zone.
If this view holds, a final Wave (c) decline may complete the pattern near ₹3,300–₹3,400 — aligning with the previous demand area. RSI is trying to rebound from oversold territory, hinting that the short-term recovery phase could soon begin.
When we zoom out to the weekly chart, this entire structure fits as part of a larger W–X–Y double zigzag correction that began from the ₹5,900 all-time high.
In other words — a correction inside a correction .
Until price convincingly breaks above ₹4,950, DMart remains in a broader corrective phase. The bulls may see short-term relief, but the bigger correction likely hasn’t finished playing out.
Disclaimer: This analysis is for educational purposes only and does not constitute investment advice. Please do your own research (DYOR) before making any trading decisions.

XUD/USD-Long-15MinInitially, the Previous Day High (PDH) and Previous Day Low (PDL) are marked on the Daily Time Frame. After that, we switch to the 4-Hour Time Frame to identify the Imbalance (IMB) candle for a potential entry setup. Once the IMB candle is identified, we move to the 15-Minute Time Frame, where the chart clearly highlights the Order Block and Liquidity Area.
The market then shows a clear Change of Character (CHOCH) indicating a shift from an uptrend. Following this, a liquidity hunt occurs as the market moves downward to capture liquidity. After this liquidity sweep, we shift to a Lower Time Frame (LTF) to plan the entry at the next Order Block. The target is set at the Previous Day High, while the stop loss is placed below the last liquidity hunting area.

NIFTY still looks very weak!As we can see despite forming M pattern and breaking below, it still looks very weak looking at weekly candlestick which is aligning with our analysis since 26000 level! We will stick with our analysis until and unless NIFTY breaks above and sustains itself above 26000 and closes weekly keeping our first target intact at 25500. So plan your trades accordingly and keep watching everyone.
XAUUSDGold is approaching supply zone. If we see a rejection from top. It can fall down to the below liquidity as shown.

NIFTY might get weaker below 25700!!As we can see NIFTY has fallen exactly as analysed as it couldnt sustain itself above 26000 level. Now that it has closed below 26000, and also fomed M kinda pattern in bigger time frame which is a REVERSAL kinda pattern moreover we can see a strong bearish candle in WEEKLY time frame which can add fuel to fire hence sticking to our view, we will keep selling keeping target of 25500 in coming trading session so plan your trades accordingly.
XAUUSDGold shows bullish retracement. It will react from inducement zone. and will fall to the Demand and reverse to continue upside.

XAUUSDGold has been going down from the beginning of the week. There is possibility of retracement to the up side and take out Buy side liquidity.
Price slows down as it moves down.
Daily is closing bullish. Giving us Inside bar.
We can expect a sell side liquidity sweep and then reverse to target buy side liquidity.
Expect a pull back as price opens on Friday 31 Oct. then reverse to go up.

We are back below 26000!As said in previous analysis that it is too soon to confirm further upmove based on DAILY candle's closing above 26000 level as the weekly candle is yet to be formed. Since we have on more day to go, we may expect further bearish to volatile market so plan your trades accordingly and keep watching everyone.

Will only go LONG if weekly candle closes above 26000 level!As we can see NIFTY has shown unidirectional upmove and also managed to close above 26000 level but 2 more days is left to confirm its weekly closing above the resistance level. Till then we stand by our analysis, selling every rise for 25500 keeping stop loss above last swing and high of NIFTY that too closing basis so we must wait patiently to confirm NIFTY's direction keep watching everyone.