Multipolar World & Geopolitical Risk Premiums1. What Is a Multipolar World?
A multipolar world refers to an international system in which power is distributed among several major states rather than concentrated in one (unipolar) or two (bipolar) dominant powers. In the 19th century, Europe functioned as a multipolar system with empires such as the United Kingdom, France, Austria-Hungary, Russia, and Prussia balancing one another.
After World War II, the world shifted into a bipolar structure dominated by the United States and the Soviet Union. Following the Soviet collapse in 1991, the U.S. emerged as the sole superpower in what many analysts described as a unipolar moment.
Today, however, global politics increasingly resembles multipolarity. Major actors shaping global outcomes include:
United States
China
Russia
European Union
India
These actors compete and cooperate across domains such as trade, technology, energy, military alliances, and financial systems.
2. Characteristics of a Multipolar System
A multipolar world has several defining features:
A. Diffusion of Power
Military, economic, technological, and financial power are more evenly spread. No single country can unilaterally dictate global rules.
B. Flexible Alliances
Unlike rigid Cold War blocs, alliances are fluid. For example, India maintains strategic ties with the United States while continuing defense and energy cooperation with Russia.
C. Regional Power Centers
Regional actors assert influence:
Turkey in the Middle East
Brazil in Latin America
Saudi Arabia in energy markets
D. Institutional Fragmentation
Global institutions such as the United Nations and the World Trade Organization face gridlock as great-power rivalry intensifies.
3. Geopolitical Risk: Concept and Evolution
Geopolitical risk (GPR) refers to the risk that political tensions, conflicts, wars, sanctions, or policy uncertainty will disrupt economic stability and financial markets.
Examples include:
The Russia-Ukraine War
Rising tensions between China and Taiwan
Sanctions imposed by the United States on Iran
In a multipolar system, geopolitical risks tend to increase because:
Power transitions create instability.
Strategic mistrust grows among major powers.
Economic interdependence becomes weaponized (e.g., trade restrictions, export controls).
4. What Is a Geopolitical Risk Premium?
A geopolitical risk premium is the additional compensation investors demand for holding assets exposed to geopolitical uncertainty.
It appears in various markets:
Oil prices rise when conflict threatens supply.
Government bond yields increase for politically unstable countries.
Equity markets decline amid war fears.
Currencies depreciate in high-risk environments.
For example, during the Russia-Ukraine War, global oil prices surged because markets priced in supply disruption risks.
In essence:
Geopolitical Risk Premium = Extra expected return required due to political uncertainty.
5. How Multipolarity Increases Risk Premiums
Multipolarity amplifies geopolitical risk premiums through several channels:
A. Strategic Competition
The rivalry between the United States and China spans semiconductors, artificial intelligence, rare earth minerals, and trade routes. Export controls and technology bans create uncertainty for global firms.
Investors therefore demand higher returns for exposure to supply chains dependent on either power.
B. Sanctions & Economic Weaponization
Financial sanctions have become common tools. When the United States and its allies restricted Russian banks’ access to SWIFT, it signaled that access to the global financial system is not politically neutral.
Countries now diversify reserves away from the U.S. dollar, increasing fragmentation and uncertainty.
C. Energy & Commodity Volatility
In multipolar competition, energy security becomes strategic. Actions by OPEC and geopolitical tensions in the Middle East directly affect global inflation.
Energy-importing countries face risk premiums in currency and bond markets when oil prices spike.
D. Supply Chain Reconfiguration
“Friend-shoring” and “near-shoring” reduce efficiency but improve resilience. However, restructuring supply chains increases short-term costs and uncertainty, contributing to equity risk premiums.
6. Historical Comparisons
During 19th-century European multipolarity, shifting alliances and arms races eventually contributed to World War I. While today’s world differs due to nuclear deterrence and economic interdependence, instability risks remain.
The Cold War bipolar system was tense but predictable. The current multipolar system is arguably less predictable because:
There are more actors.
Strategic alignments shift.
Middle powers exercise autonomy.
7. Financial Market Transmission Channels
Geopolitical risk premiums transmit through several mechanisms:
1. Equity Markets
Stock prices decline during crises due to uncertainty and earnings risk.
2. Fixed Income Markets
Emerging market bonds widen in spread when political risk rises.
3. Commodity Markets
War risk increases prices of oil, gas, wheat, and metals.
4. Currency Markets
Safe-haven currencies (USD, CHF, JPY) appreciate.
8. The Role of Emerging Powers
Emerging powers such as India and Brazil are not passive players. They practice “strategic autonomy,” balancing between great powers to maximize national interest.
This fluid positioning makes geopolitical forecasting more complex and increases uncertainty premiums.
9. Implications for Policymakers
Governments respond to multipolar risk by:
Increasing defense spending
Diversifying energy sources
Building regional trade blocs
Accumulating foreign reserves
Central banks must also account for geopolitical shocks when setting interest rates, as conflicts often trigger inflation via commodity prices.
10. Implications for Investors
Investors adapt by:
Diversifying geographically
Holding commodities and gold as hedges
Reducing exposure to politically fragile regions
Monitoring sanction regimes and trade policy
Risk modeling increasingly incorporates geopolitical indicators alongside macroeconomic variables.
11. Is Multipolarity More Dangerous?
Scholars debate whether multipolar systems are inherently more unstable. Some argue they create balancing mechanisms that prevent dominance. Others argue they increase miscalculation risk.
What is clear is that:
Economic interdependence no longer guarantees peace.
Political fragmentation raises structural uncertainty.
Markets now price geopolitical tension as a persistent feature, not a temporary shock.
Conclusion
The transition toward a multipolar world marks one of the most significant structural shifts in international relations since the Cold War. Power is diffusing across multiple centers, alliances are flexible, and economic tools are increasingly weaponized.
As a result, geopolitical risk premiums are becoming structurally embedded in global markets. Investors demand higher returns to compensate for political uncertainty. Governments must adapt to a world where stability cannot be assumed, and economic globalization is no longer frictionless.
In short:
Multipolarity increases complexity.
Complexity increases uncertainty.
Uncertainty increases risk premiums.
The coming decades will likely be defined not by a single hegemon but by competitive coexistence among major powers—where economics, finance, and geopolitics are deeply intertwined.
Multi

Borosil (W): Cautiously Bullish, Awaiting Breakout ConfirmationThis is a classic "wait and watch" scenario. The stock is in a multi-year base-building pattern, and all signs point to a significant bullish breakout. However, a formidable resistance has not yet been broken.
📈 1. The Long-Term Context
- Multi-Year Consolidation: The stock has been in a wide, sideways consolidation phase since its All-Time High (ATH) in April 2022.
- The "Lid": This entire 3.5-year pattern has been capped by a critical horizontal resistance trendline formed since December 2021 . This level is the single most important line on the chart.
🚀 2. The Current Setup (The "Battle at Resistance")
- The "Battle": For the past five weeks , the stock has been actively "battling" this multi-year resistance.
- The Failure (So Far): While there have been multiple attempts, the stock has failed to secure a weekly close above this level .
- Bullish Volume: After a long "dry period," volume is slowly rising. Crucially, these breakout attempts are being accompanied by volume spikes , showing that buyer conviction is growing.
📊 3. Confluence of Bullish Indicators
The alignment of the Monthly and Weekly timeframes is a very powerful sign:
- RSI: The Relative Strength Index is rising on both the Monthly and Weekly timeframes, showing that long-term momentum is building.
- EMAs: The short-term Exponential Moving Averages are in a "PCO" (Price Crossover) state on both the Monthly and Weekly timeframes, confirming the long-term trend is turning bullish.
🎯 4. Future Scenarios & The "Game Plan"
🐂 The Bullish Case (Confirmation)
- Trigger: We need to see a decisive weekly close above the horizontal resistance.
- Confirmation: The "gold standard" confirmation, would be a successful "re-test" —where the stock pulls back, touches the old resistance, and "bounces" off it as new support.
- Target 1: ₹840
- Target 2: ₹1,130
🐻 The Bearish Case (Breakout Failure)
- Trigger: If this 5-week "battle" results in a strong rejection and momentum is lost.
- Target: The stock will likely fall to retest its immediate support level at ₹635 .
Conclusion
The rising volume and bullish high-timeframe indicators are pressing against a multi-year resistance. The breakout, if it is confirmed, will be significant. The best approach is patience.

ETHUSDT/BTCUSDT Short idea 11/11/2025Wassup Lads!
This looks like a very enticing short setup simply because
1. Price in a daily bearish fair value gap
2. We have SMT Divergence between BTC and ETH on the daily time frame
Switching over to the H1 time frame I'm clearly seeing price print out a bearish orderflow, I have not yet entered but will look to enter a sell postion on retracement to the H1 Bearish fair value gap, targeting a basic 1 to 2 risk to reward ratio. So basically, if price retraces to the h1 bearish fair value gap I'll look for shorts or I'm happy waiting on the sidelines for a new setup.
As always -
1. Manage your risk
2. Stay disciplined
3. Do your own research
One wrong trade can spoil months of discipline
Keep winning!!

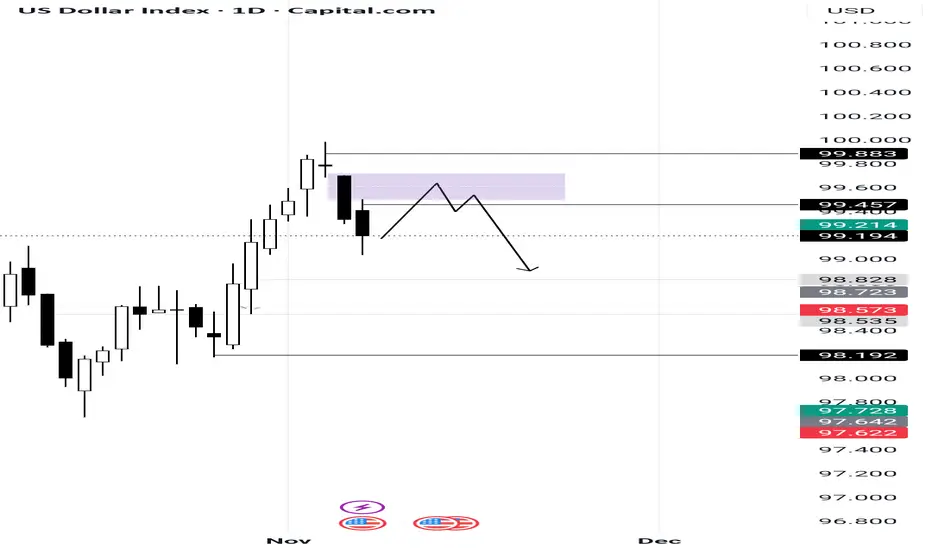
DXY Weekly Outlook 10/11/2025 - 14/11/2025Wassup Lads!
The dollar index has closed sharply into the weekly range and has formed a daily swing point and a strong rejection candle on the weekly time frame. I am expecting dollar to retrace to the bearish daily fair value gap and continue lower.
I recommend you to -
1. Maintain your risk
2. Stay disciplined
3. Do your own research
Let's win the week
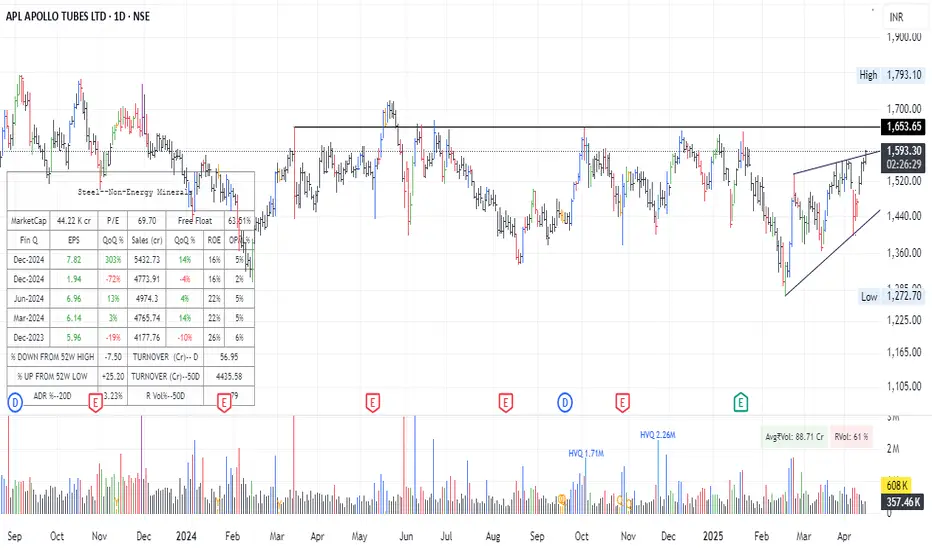
Apl Apollo Tube - ReRating Candidate !!??Stock peaked in Sep 2023.. Has been Range bound since almost 2 yrs now.. Interestingly had the best quarter ever last qtr.. Margins are stable and constant through many months.. If margins expand we are looking at a re-rating candidate.. Over all looking very interesting..
AVANTI FEEDS - A Hidden Multibagger!Overview & Observation:
1. Trendline break.
2. Change in price structure.
3. Prices are reversing with double bottom formation and breakouts are sustaining.
4. Buyers have started dominating
5. Good volume support is also present.
6. Momentum will be slow since multiple hurdles are present!
Trade Plan
Entry = CMP
SL = 10%
TP = Minimum double and more based on trailing and holding capacity.
-Stay tuned for further insights, updates and trade safely!
- If you liked the analysis, don't forget to leave a comment and boost the post. Happy trading!
Disclaimer: This is NOT a buy/sell recommendation. This post is meant for learning purposes only. Please, do your due diligence before investing.
Thanks & Regards,
Anubrata Ray

SYNGENE - Demand zone tapped: Ready for a move of 50%! Trade Idea Description:
Despite weak earnings, the potential for better quarterly results could trigger a breakout.
Here’s the plan:
- Entry Point: At CMP 691
- Stop Loss: 10% below the entry around 640 on candle closing basis.
- Target: Aiming for a 50% upside, 1:5 risk-reward ratio
With minimal downside risk, this is a compelling long-trade opportunity.
- Stay updated for further insights and trade safely!
- If you have liked the analysis, don't forget to leave a comment and boost the post. Happy trading!
Disclaimer: This is NOT a buy/sell recommendation. This post is meant for learning purposes only. Please, do your due diligence before investing.
---
Thanks & Regards,
Anubrata Ray

Latent View Analytics Ltd| Swing + long term investingLatent View Analytics Ltd provides analytics services such as data and analytics consulting, business analytics & insights, advanced predictive analytics, data engineering, and digital solutions. The company provides services to blue-chip companies in Technology, BFSI, CPG & Retail, Industrials, and other industry domains
Financial:
Market Cap₹ 11,158 Cr. Current Price ₹ 542 Stock P/E 75.6
ROCE 16.7 % ROE13.8 % Debt to equity 0.02
Promoter holding 65.4 % Quick ratio 15.8 Current ratio 22.9
Piotroski score 5.00 Profit Var 3Yrs 31.8 % Sales growth 3Years 20.2 %
Return on assets 13.0 %
This stock is recently published and you can see long downside cover with rounding bottom and clear cut straight away RSI in strong Momentum .keep close watch on this .Data and Analytics is the Future of India. so keep invest on India and make wealth.
Note: I am not SEBI registered financial Adviser. I solely present my views on chart .I do not charge any kind of service. This is not buy sell recommendation.
If you like my ideas than like boost and follow me for more ideas.
Thanks and feel free to comment .

TEXRAIL | BULLISH MOMENTUM | MULTI - YEAR BREAKOUTTEXRAIL stock has given a multiyear breakout . We can expect some solid momentum in upcoming days

How to use the Multi-layout feature?If you track several markets or if you need to track multiple symbols simultaneously, the multi-layout feature is the way to go. It enables you to track different markets or the same symbol simultaneously on different time frames. This particularly comes in handy if you trade indices and need to track the constituents to observe their price behaviour.
Example : If you trade Bank Nifty index futures or options, you can track the top constituents of the index. This will help you in assessing which constituents are pulling up or dragging the index and how the overall move can unfold.
This short visual guide will help you in accessing and customizing the multi-layout feature. Let’s get started!
1. Open the homepage of TradingView, go to “ Products ” and then open your chart layout.
2. Once you are on the chart page, you’ll see a small square icon at the top-right hand side of the screen. This is the “ Layout ” option. Click on it to view different available options.
3. As soon as you click on it, you’ll be greeted with a small window showing various combinations of horizontal and vertical layouts .
4. You can select the desired layout as per your needs. The vertical layouts look great on monitors in landscape mode, whereas the horizontal layouts go with portrait mode.
Please note that the number of charts per tab varies with the subscription type. The limit is as follows:
Free plan- 1 chart (Can’t use the multi-chart feature)
Pro plan - 2 charts
Pro+ plan - 4 charts
Premium plan - 8 charts
If you need to upgrade your account, be sure to check our Black Friday sale . You can get up to 60% off on subscriptions.
5. As we mentioned earlier, the multi-layout feature enables you to track several markets simultaneously or the same symbol on different time frames.
Example: Tracking different markets
Example: Tracking the same symbol on different time-frames
Observing the same symbol on multiple time frames provide easy insight into the multi-time frame analysis.
6. There are also a few synchronization options. You can synchronize the symbol, interval, time, crosshair, and date range between the charts. You can just select the sync option by just clicking on it.
Thanks for reading! Hope this was helpful!
See you all next week. 🙂
– Team TradingView
Feel free to check us out on Twitter and Instagram for more awesome content! 💘

BITCOIN ANALYSIS. CHART SAYS IT ALL.BITCOIN ANALYSIS.
Been on a down trend. It broke out of it now taking consolidation near latest supply.

Multi year BreakoutMulti year Breakout on Greaves cotton ltd , cmp 227.40 /almost 7 year breakout on chart /good consolidation and nice breakout/do your own analysis before take any trade..


ACC multi time frame Breakout#ACC
ACC on multiple time frames.
Monthly breakout done on july 2021
Stock retested breakout on weekly charts.
RSI above 50 on all three timeframes.
Stock in accumulation right now.
#vr

Multi year breakout in Aditya Birla FashionFrom April'20, this stock has continuously shown us higher highs and now it stands at the breakout levels of 2016. It has great strengh and momentum to go over 100 points from here. This is at the good level after the breakout and retest is completed.
Buy at current level with stop loss below 210. If you can take a good risk and hold for few months, go with SL of 204.
Kindly note, this is only an analysis and not any recommendation. Please consult your financial advisor before investing.

CUMMINSIND heading for big BOAfter last upmove #CUMMINSIND consolidating almost 5+ month.
It tried multiple times to sustain above 900 but failed each time. Finally now it sustaining above 900 plus it give highest weekly closing after March 21.
Long entry can be initiated at this level with SL of 820. For safe player wait for daily candle close above 925.
Target - 1200+ All time high.

Fortis breakout after three rounding bottoms - Bulling pattern Fortis has given a breakout after a rounding bottom and broken the resistance from May 2017. This is a bullish pattern.
Please note, this is not a recommendation and only an analysis.

Donear Industries @ your fingertips🎀all studies explained in the chart
just Buy and hold
period 1-3 month
trgt 47-53-63+
🎲fundamentals not bad.
🎲promising chart.
🎲can see a breakout in this session.
study well then invest🙏
#your money
thanku
like |🔹| comment |🔹| support

#57 RECLTD POSITIONAL SETUP#57(GENIE IDEAS): I will daily post intraday/swing/positional trading opportunities so u can analyse and get the most from it. if you like my analysis do like and follow me as a token of appreciation.and if you have any queries let me know. I have also linked my views on stocks which on the verge of breakout BELOW.
Leave a comment that is helpful or encouraging. Let's master the markets together .

TCS positional setup Good candles on this trendline = extremely good long situations.
Charts speak more than my words now here : low risk setup ;; huge rewards :)
💲💲 FOLLOW me @Averoy_Apoorv_Analysis and get these free analysis :) 💲💲
🔰 {Some info}
➼My name is Apoorv and I am a 2nd year Engineering student, I want to pursue trading as my career, and thus whatsoever setups or trades I potentially see on my charting platform, I post it here and share them with you all.
➼I hope you will love my simple analysis style.
➼Feel free to suggest your view on this as learning is earning here :)
➼I take my trades on my Zerodha account :)
➼These charts are my and only my work, my thought process, just from an educational point of view and no calls.
<<<<<>>>>>


Head and shoulder multi year breakoutSteel sector is doing great. This is benefitting all steel companies

MULTI-YEAR BREAKOUT- NHPC LTDHI ALL
There is a multi year breakout on
NHPC LTD on Monthly timeframe.
NHPC involves in business of electrical equipment's.
Levels of Breakout:
29.40 & 29.50
Targets: 35
