BUY NATIONAL ALLUMINIUMNational Aluminum gives all time high breakout and than retest the level which become strong support and stoploss for a trade, so long on national aluminum or hold as a trade as well long term investment with strict stoploss. Do your own research this is only for education purpose not any buy or sell recommendations. i am not expert in market because market is the king. Enjoy the Ride.
Multibagger

RR KABEL : Breakout Soon Candidate NSE:RRKABEL
🔹 Technical View
Strong recovery from ₹900 zone
Price testing major resistance at ₹1,500–1,510
Above ₹1,510 (weekly close): Breakout → ₹1,650–1,800
Support: ₹1,380–1,400
Structure turning higher high–higher low → bullish bias
🔹 Fundamental Snapshot
Strong brand in wires & cables
Consistent growth, improving margins
Beneficiary of housing, infra & electrification demand
🔹 Outlook
Above ₹1,510: Momentum trade active
Below ₹1,380: Consolidation risk
Medium–Long term: Structurally bullish
Disclaimer:
This content is shared strictly for educational and informational purposes.
We are not SEBI-registered investment advisors or analysts.
The views expressed are personal opinions, based on publicly available data and market observations.
Please consult a SEBI-registered investment advisor before taking any investment or trading decisions. Any actions taken based on this
content are entirely at your own risk and responsibility.
Trade Secrets By Pratik

IOCL - Investment Doubler - MultiTimeframe Analysis
**📊 Indian Oil Corporation (IOC) - Technical Analysis**
#Multiple timeframe analysis showing IOC at a critical juncture around ₹136-163 levels.
Key Observations:
- On an Yearly Chart, Prev Yearly candle attempt failed to do Breakout.
- On Half-yearly chart breakout confirmed and the stock retraced and bouncing back to Key Levels.
- On an Yearly chart the Previous leg which attempted to break Previous ATH has strong #Momentum - The Stock Bounce back on Major Demand Zone, signs of retracement complete.
- Current price: 163.67
- Multiple "Buy on Dips" opportunities identified across timeframes
- 2017 highs acting as reference resistance levels
- Target levels marked: Tgt 1 196.80, Tgt 2 220, Tgt 3 250, Tgt 4 280
- Conservative stop-loss suggested on candle closing basis (short-term)
Trading Strategy:
- Swing trading approach recommended
- #Investment Doubler potential noted on long-term chart
- Expecting 2017 yearly breakout on extended timeframe
DISCLAIMER:
This is for educational and informational purposes only. This is NOT investment advice. Trading and investing in stocks involves substantial risk of loss. Always conduct your own research and consult with a certified financial advisor before making any investment decisions. Past performance does not guarantee future results. The author/analyst is not responsible for any losses incurred from trading decisions based on this analysis.
#TradingView #IOC #IndianOilCorporation #StockMarket #TechnicalAnalysis #SwingTrading #NSE #IndianStocks #BuyOnDips #ChartAnalysis #BreakoutTrading #StockTrading #MarketAnalysis #Nifty #BSE #EquityTrading #ShareMarket #InvestingIndia #TradingSetup #PriceAction #SupportResistance #TrendAnalysis #DayTrading #PositionalTrading #StockTips #MarketOutlook #TechnicalChart #CandlestickPattern #BullishSetup #FinancialMarkets
💡 Remember: Trade at your own risk. Risk management is key to successful trading!

Mazdock : A Sleeping Giant Mazgaon Dock broke out of a very strong resistance after forming a base to form new life time high
Post that if you notice
1) volumes dropped
2) Price has fallen
3) There is an obvious invalidation of the breakout which took it to life time high
4) Classic Smart Money Liquidity Sweep
It has posted a healthy set of results in the last quarter and with defense spending ramping up this stock is going to perform extremely well.
It can 2X from here in a reasonably good amount of time.
Watch for a high volume Marubozu on the chart, any time now!

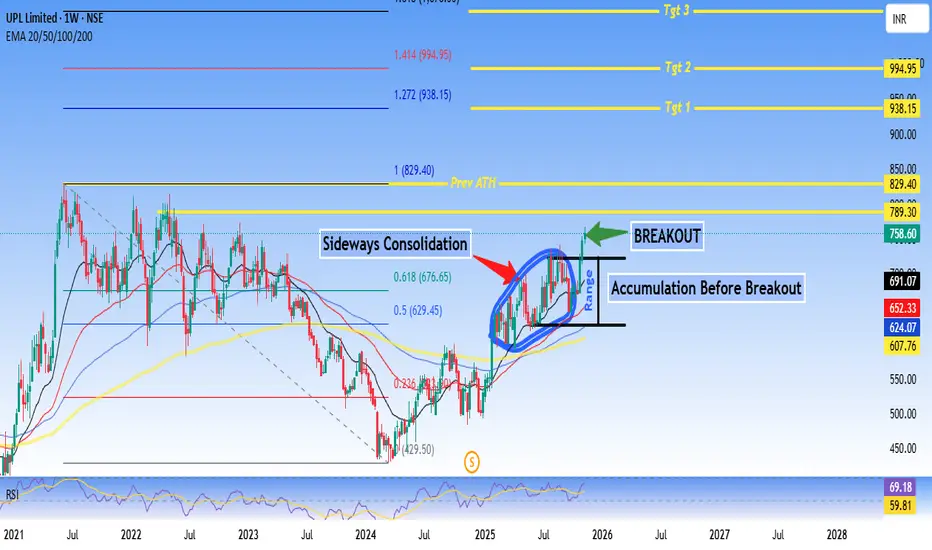
UPL Limited approaching Prev ATH - Technical AnalysisUPL Limited - #Breakout Setup After #Accumulation Phase
Current Price: 691.07
Good For Swing to Short-term Trading.
Technical Summary:
UPL is showing a classic accumulation-to-breakout pattern after an extended sideways #consolidation phase. The stock has broken out from a well-defined range with strong volume confirmation and is now positioned for potential upside momentum.
Key Technical Highlights:
✅ Breakout Confirmed: Price breaking above 768 resistance zone with volume expansion
✅ Accumulation Phase Complete: Extended consolidation (2024-2025) suggesting smart money accumulation
✅ EMA Alignment: 20/50/100/200 EMAs converging and starting to fan out bullishly
✅ RSI Strength: At 69.18, showing momentum without being overbought
✅ Fibonacci Levels: Currently between 0.236-0.5 retracement, plenty of upside room
Price Targets:
- Target 1: 938.15 (+35% from current levels)
- Target 2: 994.95 (+44%)
- Target 3: 1,050+ (Extended target)
Support Levels:
- Immediate: 676 (0.618 Fib)
- Strong: 629 (0.5 Fib + breakout level)
- Critical: 607 (20 EMA)
Risk-Reward: Favorable at current levels with defined support zones and multiple upside targets.
Disclaimer:
This analysis is for educational and informational purposes only and should NOT be considered as financial advice or a recommendation to buy/sell any security.
- Technical analysis is based on historical price patterns and may not predict future performance - Past performance is not indicative of future results - Trading and investing involve substantial risk of loss - Always conduct your own research and due diligence - The author may or may not hold positions in the discussed security - Price targets are projections based on technical levels and not guaranteed outcomes - Market conditions can change rapidly, invalidating technical setups - Use appropriate position sizing and risk management strategies
** Trade at your own risk. You are solely responsible for your trading/investment decisions.**
#UPL #TechnicalAnalysis #Breakout #Accumulation #StockMarket #NSE #SwingTrading #ChemicalSector #FibonacciRetracement #RSI
Graphite India: Sparking the Next Electrode UpswingNSE:GRAPHITE
Company snapshot
India’s largest graphite electrode manufacturer; also produces specialty graphite, impervious graphite equipment, GRP pipes and high-speed steel.
Capacity of ~98,000 TPA across plants at Durgapur and Nashik; Germany plant closed. Utilisation stood at ~83% in FY25.
Investing in advanced carbon technologies; announced ~25,000 TPA capacity expansion (~123,000 TPA target).
Market context
Rising share of electric-arc-furnace (EAF) steel globally supports electrode demand.
US anti-dumping duty (~93.5%) on Chinese graphite improves non-Chinese producers’ competitive positioning.
Valuation & stock stats (Oct 2025)
Share price ~₹625; 52-week range ~₹365–₹638.
Market cap ~₹122 billion; P/E ~34; P/B ~2.1; dividend yield ~1.8%.
Peer: HEG and other electrode-cycle players.
Key fundamentals
Q1 FY26 results: Total income ~₹789 crore; PAT ~₹145 crore; EBITDA ~₹200 crore.
Business mix (FY25): Graphite & Carbon ~89%; Steel ~9%; Others ~2%.
Ownership: Promoters ~65% (no pledge); FIIs ~6.6%; MFs ~7.5%; DIIs ~9.6%.
Capacity & capex
Base electrode capacity ~98,000 TPA; plan to expand by ~25,000 TPA.
Expansion capex ~₹600–650 crore; timeline yet to be fully disclosed.
Technical view
Trend: Price is above 200-day moving average (~₹559); near 52-week high.
Support zone: ~₹480–₹510–₹546.
Resistance/breakout zone: ~₹630–₹640.
Strategy: Positive momentum; consider buying on dips with support around ₹540.
Actionable watch-points
Electrode price trends and needle-coke spread (core margin driver).
Execution of the ~25,000 TPA expansion—schedule, funding, payback.
EAF steel cycle developments in India and globally.
Policy/anti-dumping updates impacting Chinese graphite supply.
Capital allocation: capex vs dividend, progress in advanced carbon tech.
Key risks
Slowdown in EAF steel or electrode demand; sharp rise in raw-material (needle coke) costs.
Reversal of favourable trade or tariff policies.
Expansion delays or weaker‐than‐expected product mix shift to lower margin grades.
Stance
Fundamental: Strong balance sheet, favorable cycle exposure, expansion potential.
Technical: Bullish bias
⚠️ Disclaimer:
This analysis is for educational and informational purposes only.
We are not SEBI-registered analysts or advisors.
This is our personal view based on available data and market trends.
Please consult your SEBI-registered investment advisor before making any investment or trading decisions.
You are solely responsible for any financial decisions you make based on this content.
========================
Trade Secrets By Pratik
========================

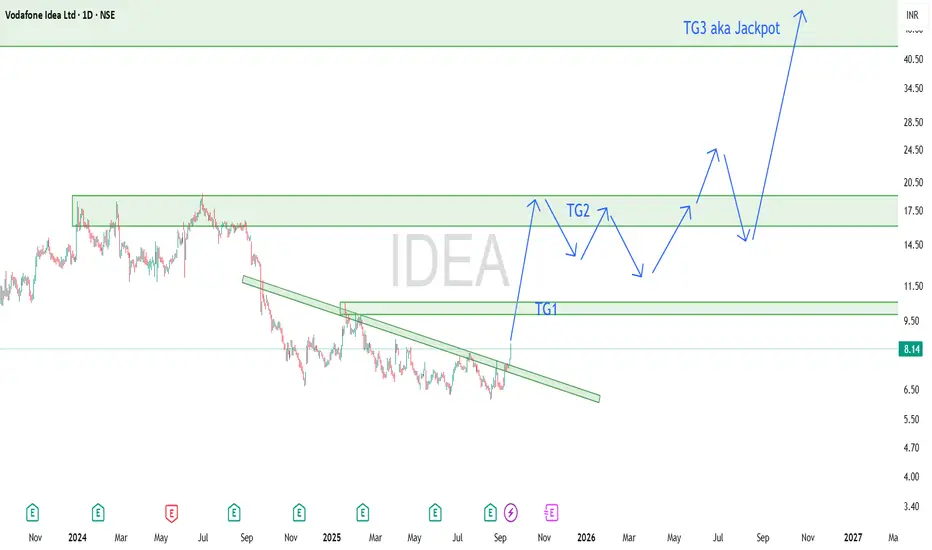
How to make Vodafone Idea a multibagger by 2026-2027After consolidating heavily at the bottom IDEA is finally moving up, We can plan for a long term view for insane profits, it will take months though. If your view is short just keep looking for bullish inside candle after a retracement and enter or Look out for good options CE setups in intraday for the next year or so, You can ride using 20 and 50 SMAs.
I'm gambling on the path(shown in arrows) it might take to reach jackpot, Remember holding that long will be a BUMPY ride, there might be deep retracements, expert traders will add more on those, Noobs will end up panicking and sell on the low of retracements and regret later. We also might see a couple of months long consolidations. If you are happy with the TG1, TG2 gains, you can book early and enter again when a good bullish setup forms.
OR this plan will fail miserably but its worth trying ;)
Entry at CMP or around 7
SL at 5.95
Targets 10, 18, 40 and beyond..
Torrent Power - Short Term Investment IdeasTorrent Power Limited - Technical Analysis Report
Current Market Price: 1,328.40
Opportunity: The Stock is Trading at 40% discount to intrinsic value, presenting a potential value investment in the #Integrated #powersector.
Technical Setup: Stock testing critical 20 #EMA support on monthly timeframe after forming #HiddenDivergence #pattern. Recent decline suggests caution but oversold conditions emerging.
Technical Snapshot
Trend: Monthly chart shows trend continuation pattern with classic divergence forming between February and October 2025 lows. Currently attempting support at 20 EMA (1,329).
RSI: Monthly RSI at 33.26 (oversold territory) with RSI 3 breakout indicating significant selling pressure but potential bounce setup.
Support Levels: 1328, 1200, 1055
Resistance Levels: 1539, 1743 (recent high)
Business Overview (Fundamentals)
Torrent Power operates across three segments: thermal power generation and LNG trading, transmission and distribution (largest revenue contributor), and renewable energy through wind and solar projects.
Trading Strategy
Aggressive Buyers: Accumulate at current levels with stop loss below 1,280. Risk-reward favorable given 40% discount.
Conservative Buyers: Wait for weekly close above 1,350 confirming support hold before entry.
Target:1,539 (short-term), 1,743+ (medium-term)

SUBEX LTDNo BUY or SELL Recomendation
Fundamentals need to be Analysed
Just Technical Analysis shared here
I'm not at SEBI Registered Analyst

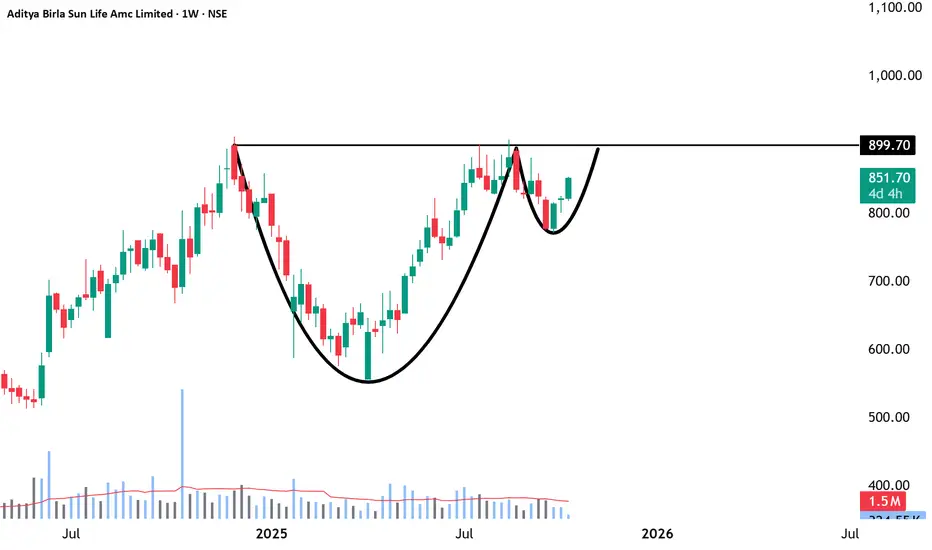
Aditya Birla Sun Life AMC-Built to Compound, Poised to BreakoutNSE:ABSLAMC
🔹 Fundamental Overview
Business Strength—One of India’s leading asset management companies, part of the Aditya Birla Group; operates across mutual funds, PMS, and AIF segments.
Financial Health – Debt-free balance sheet with excellent profitability and high cash reserves.
Profitability Metrics – ROE around 28%, ROA near 25%, and net margins above 50%, indicating strong operational efficiency.
Growth Trend – Revenue and net profit are both growing at ~20–25% YoY, supported by rising AUM and stable fee income.
Valuation—Trades near 24× P/E and 6–7× P/B; premium valuation justified by brand strength and consistency, but limits margin of safety.
Dividend Policy – Moderate yield (~1.5–1.7%) with regular payouts; good for long-term income seekers.
Key Positives—Strong parentage, scalable business, high ROE, and steady market share gains.
Key Risks—Market-linked revenues, fee compression risk, and competition from passive products and fintechs.
🔹 Technical Overview
Trend Bias—The long-term trend remains bullish, with the price comfortably above the 50-DMA (₹838) and 200-DMA (₹748).
Momentum – RSI around 55–60, neutral to mildly positive; no overbought signs.
Trend Strength – ADX below 20 shows consolidation; potential for trend expansion if volume picks up.
Crucial Support Zone – ₹ 815 – ₹ 830; strong base for accumulation.
Resistance Zone – ₹ 854 – ₹ 860; a breakout above this range may trigger a sustained rally.
Long-Term Projection – 2,500+++ possible over 3–5 years in favorable market conditions.
Risk Control – Maintain stop-loss below ₹ 810 for long positions; trail profits once above ₹ 900.
🔹 Investor Takeaway
Outlook—Fundamentally robust, financially sound, and technically poised for breakout after consolidation.
Strategy—Ideal for gradual accumulation on dips and adding on confirmed breakouts above ₹ 860.
Time Horizon – Best suited for 1–5 year investors seeking stable compounding from a high-quality financial business.
========================
========================
⚠️ Disclaimer:
This analysis is for educational and informational purposes only.
We are not SEBI-registered analysts or advisors.
This is our personal view based on available data and market trends.
Please consult your SEBI-registered investment advisor before making any investment or trading decisions.
You are solely responsible for any financial decisions you make based on this content.
========================
Trade Secrets By Pratik
========================
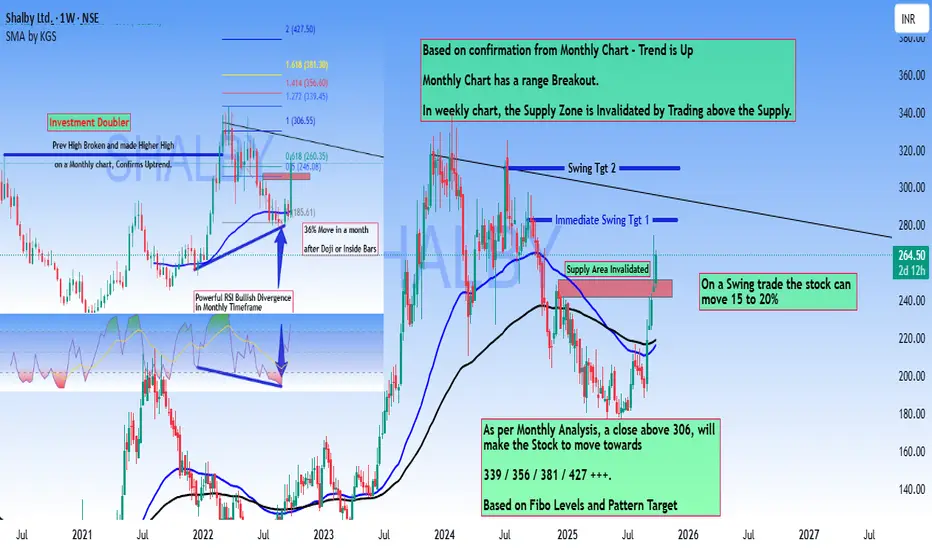
ShalbyLtd - Investment Doubler - High Conviction Trade Setup#Shalby Ltd - #Technical Analysis Report
Current Price: 264.50
Key Technical Signals
Bullish Confirmation from Multiple Timeframes:
- Monthly chart shows a confirmed range breakout with uptrend validation
- Previous high broken on monthly chart, establishing higher highs
- Powerful RSI Bullish Divergence observed in monthly timeframe
Weekly Chart Analysis:
- Supply zone has been invalidated by price trading above 246-250 Levels
- Stock is now in an active swing trade setup
- Expected Immediate 10 to 15% Move Swing Setup.
Investment Status:
The stock presents a compelling "Investment Double" opportunity, with the previous high broken and a higher high confirmed on the monthly chart. The pattern suggests significant upside potential after a period of consolidation.
Price Targets
Short-term Swing Trade: Potential move of 15-20% from current levels
Medium to Long-term Targets:
- ₹306 (Critical breakout level)
- ₹339
- ₹356
- ₹381
- ₹427++++
A decisive close above ₹306 will trigger momentum toward higher Fibonacci-based targets.
Risk Consideration
Expect a consolidation period of approximately one month following Doji or inside bar formations before the next major move materializes.
Conclusion
Shalby Ltd presents a strong technical setup with multiple timeframe confirmation. The invalidation of the supply zone and monthly breakout suggest the stock is positioned for a sustained upward movement. Traders should monitor the ₹306 level closely for breakout confirmation.
Disclaimer: Charts shared only for Educational purpose only. Its not a trade recommendation. Do your own analysis to survive in Trading for a longer run.
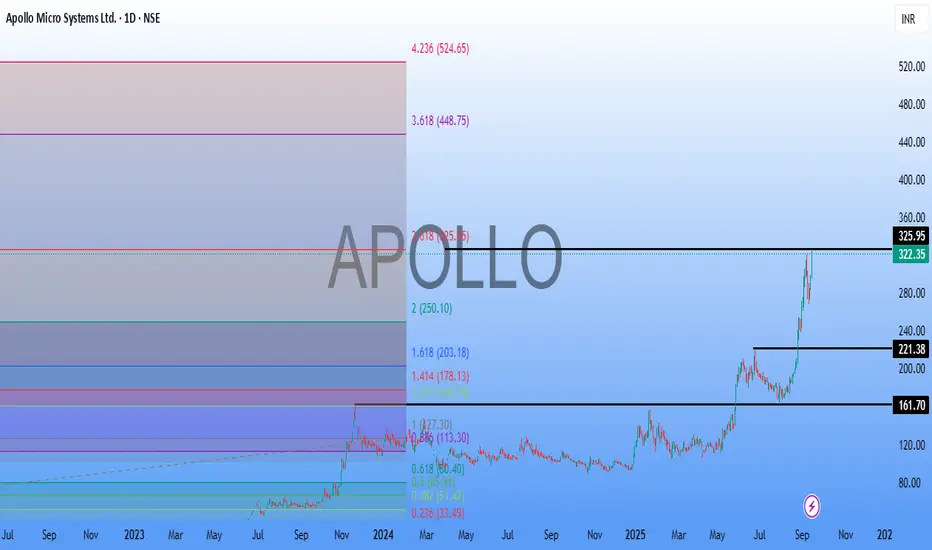
ApolloMicro SystemsApollo Micro Systems (AMS) is an Indian defense and aerospace electronics company poised for growth due to strong order books and expansion plans.
Apart from the Fundamentals, from Technical Point of view based on previous high breakout, stock has reached the Fibo Extension of 325.95. and its the Major Resistance.
Its a buy on dip candidate for a short to long term Investment stock,
with next target of 448.75 / 524.65.
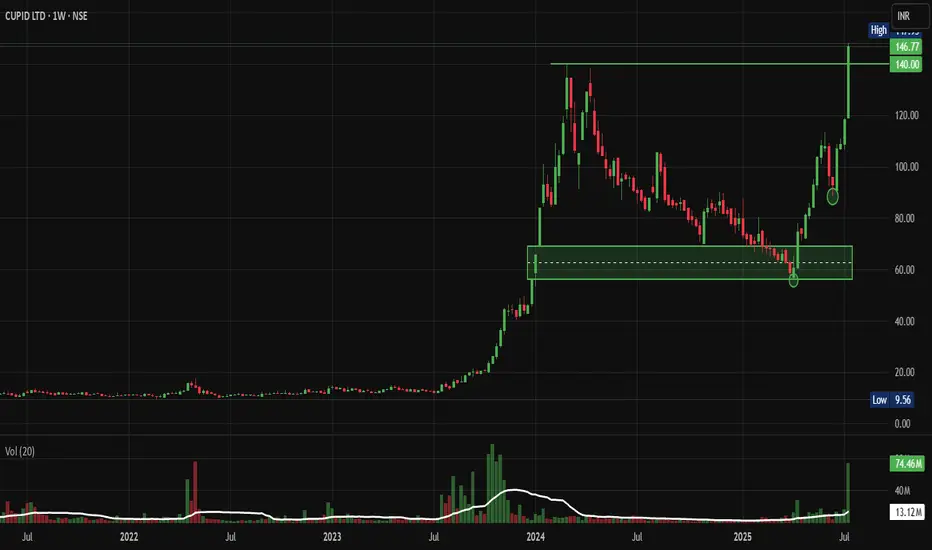
Cupid: Past Multibagger Forming Rounding Bottom BreakoutFrom ₹10 to ₹150: How CUPID Stock Became a Multibagger Dream and What's Next. Let's analyse and Deep Dive into my Chart of the Week Idea.
Price Action Analysis:
Long-term Trend Analysis:
- Primary Trend: Strongly bullish multi-year uptrend since 2023
- Trend Structure: Classic accumulation-markup-distribution pattern visible
- Price Progression: Massive rally from ₹10 levels in 2023 to ₹145+ levels
- Current Phase: Potential early stage of renewed markup phase after consolidation
Volume Spread Analysis:
Volume Profile Assessment:
- Accumulation Phases: High volume during the 2023-2024 markup phase
- Distribution Evidence: Volume spike during 2024 highs suggesting profit-taking
- Current Volume: Recent volume expansion (74.46M) confirming breakout momentum
- Volume Trend: Healthy volume participation during the current breakout phase
Volume-Price Relationship:
- Positive Correlation: Rising prices accompanied by expanding volume
- Breakout Validation: Current breakout supported by above-average volume
- Distribution Concerns: Previous high volume at peaks indicated selling pressure
Key Price Levels:
Support Levels:
- Immediate Support: ₹95-100 (recent consolidation base)
- Critical Support: ₹80-85 (previous resistance turned support)
- Major Support: ₹65-70 (rectangle pattern lower boundary)
- Ultimate Support: ₹50-55 (long-term trend line support)
Resistance Levels:
- Key Resistance: ₹145-150 (previous highs)
- Major Resistance: ₹150-155
- Target Extension: ₹170-180 (measured move projection)
Technical Indicators Assessment:
Trend Indicators:
- Moving Averages: Price clearly above major moving averages, indicatinga bullish bias
- Trend Strength: Strong upward trajectory since the consolidation base
- Momentum: Building positive momentum after prolonged consolidation
Trade Setup & Strategy:
Primary Long Setup:
- Entry Strategy: Buy on dips to ₹115-120 support zone
- Confirmation: Entry above ₹145 for momentum traders
Alternative Strategies:
Conservative Approach:
- Entry: Wait for pullback to ₹100-105 levels
- Timeframe: Medium to long-term holding period (Weekly Charts)
- Risk Profile: Lower risk, moderate reward
Aggressive Approach:
- Entry: Immediate entry at current levels (₹145)
- Timeframe: Short to medium-term momentum play (Daily Charts)
- Risk Profile: Higher risk, higher reward potential
Entry and Exit Levels:
Entry Zones:
- Zone 1: ₹115-120 (Primary entry for dip buyers)
- Zone 2: ₹145-150 (Momentum breakout entry)
- Zone 3: ₹100-105 (Deep pullback opportunity)
Target Levels:
- Target 1: ₹150-155 (Short-term objective)
- Target 2: ₹160-165 (Medium-term target based on pattern)
- Target 3: ₹180-190 (Long-term extension target)
- Ultimate Target: ₹200+ (Bull market extension)
Exit Strategy:
- Profit Booking: Book 30% at Target 1, 40% at Target 2, and the remaining at Target 3
- Trailing Stop: Implement trailing stop-loss above ₹140
- Time Stop: Review position if targets are not achieved in 8-12 months
Stop-Loss Strategy:
Stop-Loss Levels:
- Aggressive Stop: ₹110 (for entries around ₹120)
- Moderate Stop: ₹100 (for swing traders)
- Conservative Stop: ₹85 (for long-term investors)
Stop-Loss Management:
- Initial Risk: Limit to 8-10% of the entry price
- Trailing Mechanism: Move stop-loss to breakeven after 15% gains
- Pattern Stop: Below ₹95 invalidates the breakout setup
- Time-based Stop: Exit if below ₹110 for more than 2 weeks
Position Sizing & Risk Management:
Position Sizing Guidelines:
- Conservative Investors: 2-3% of portfolio
- Moderate Risk Takers: 4-5% of portfolio
- Aggressive Traders: 6-8% of portfolio (maximum)
- Sectoral Exposure: Limit total pharma/healthcare exposure to 15-20%
Risk Management Framework:
- Maximum Loss: Limit loss to 2% of total portfolio per trade
- Diversification: Don't concentrate more than 10% in a single stock
- Sector Allocation: Balance with other defensive sectors
- Time Diversification: Stagger entries over 2-3 weeks
Portfolio Integration:
- Correlation Check: Monitor correlation with other pharma stocks
- Sector Rotation: Consider the pharma sector cycle and rotation
- Market Cap Allocation: Balance small-cap exposure with large-caps
- Liquidity Consideration: Account for small-cap liquidity constraints
Risk Assessment:
Technical Risks:
- Failed Breakout: Risk of false breakout below ₹115
- Distribution Pattern: High volume at peaks may indicate selling
- Overbought Conditions: Rapid rise may lead to consolidation
- Support Breakdown: Break below ₹95 would be technically negative
Fundamental Risks:
- Valuation Concerns: High PE ratio of 96+ indicates premium valuation
- Sales Decline: The Recent 7% sales decline raises growth concerns
- Sector Competition: Increasing competition in the contraceptive market
- Regulatory Changes: Healthcare sector regulatory modifications
Market Risks:
- Small-Cap Volatility: Higher volatility compared to large-caps
- Liquidity Risk: Potential liquidity issues during market stress
- Sentiment Risk: Healthcare sector sentiment shifts
- Global Economic: Impact of global economic conditions on exports
Company Overview & Fundamental Backdrop:
Business Profile:
- NSE:CUPID is India's premier manufacturer of male and female condoms, personal lubricant, and IVD kits, established in 1993
- The company manufactures and exports contraceptives, including male and female condoms, and medical devices, with a focus on sexual health and reproductive safety, serving both domestic and international markets, supplying high-quality products to governments and NGOs
- Market capitalization: ₹3,940 crores as of July 2025, classified as a Small Cap company
Financial Performance:
- Current valuation metrics: PE ratio of 96.3 and PB ratio of 11.5
- Recent performance: Sales declined by 7.24% to Rs 61 crore in Q4 FY25 versus Rs 66 crore in Q4 FY24; however, net profit rose 2.71% to Rs 41 crore for FY25
- Long-term returns: The stock has delivered 133% returns in the last 3 years
Sectoral Growth Outlook:
- The Indian contraceptive devices market is expected to grow at a CAGR of 6.2-6.3% from 2025 to 2030
- Market size estimated at USD 264.01 million in 2025, expected to reach USD 377.61 million by 2030, at a CAGR of 7.42%
- India's pharmaceutical sector aims to grow from the current US$50 billion to US$450 billion by 2047, with India being the 3rd largest producer of drugs globally
Monitoring Parameters:
What to Look Closely at Technically?
- Weekly Close: Monitor weekly closes above ₹115 for trend continuation
- Volume Trends: Watch for volume expansion on up-moves
- Relative Strength: Compare performance with the Nifty Healthcare Index
What to Look Closely at Fundamentally?
- Quarterly Results: Track revenue growth and margin expansion
- Order Book: Monitor new contract wins and export orders
- Sector Trends: Keep track of contraceptive market growth
- Management Commentary: Follow management guidance and outlook
Now, when to exit?
- Technical Breakdown: Close below ₹95 for two consecutive days
- Volume Reversal: High volume selling at resistance levels
- Fundamental Deterioration: Significant decline in business metrics
- Sector Weakness: Broad-based healthcare sector underperformance
So, My Take:
NSE:CUPID presents a compelling technical setup with a confirmed breakout from a year-long consolidation pattern. The stock has transformed from a ₹10 stock to a multibagger, and current technical indicators suggest potential for further upside. However, premium valuation and recent sales decline warrant careful risk management. The trade offers an attractive risk-reward profile for investors willing to accept small-cap volatility in exchange for participation in a growing healthcare subsector.
Keep in the Watchlist and DOYR.
NO RECO. For Buy/Sell.
📌Thank you for exploring my idea! I hope you found it valuable.
🙏FOLLOW for more
👍BOOST if you found it useful.
✍️COMMENT below with your views.
Meanwhile, check out my other stock ideas on the right side until this trade is activated. I would love your feedback.
Disclaimer: "I am not a SEBI REGISTERED RESEARCH ANALYST AND INVESTMENT ADVISER."
This analysis is intended solely for informational and educational purposes and should not be interpreted as financial advice. It is advisable to consult a qualified financial advisor or conduct thorough research before making investment decisions.
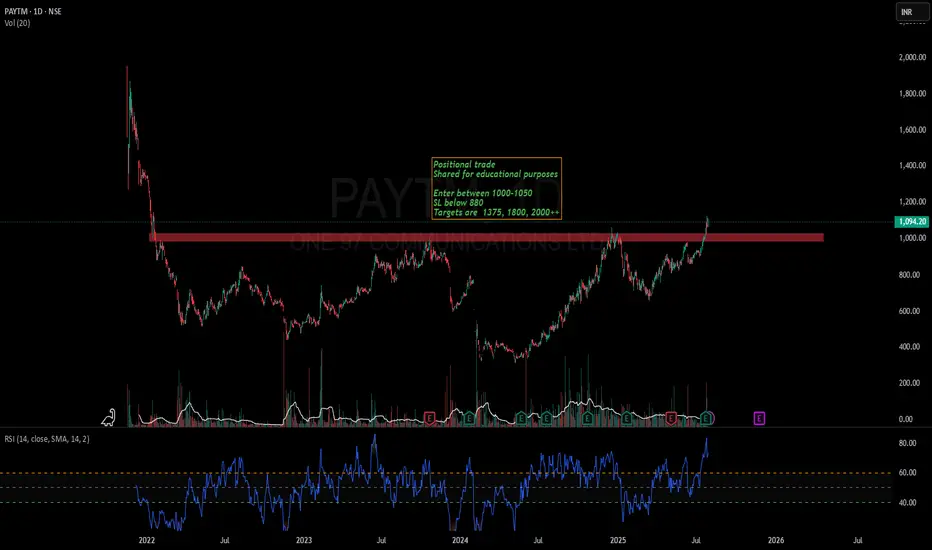
Paytm-A new ATH is coming soonPaytm has finally closed above its long term resistance of 1000.
Stock has potential to cross 2000 in near future
Keep stock in watchlist
Stock has also formed a kind of inverted head and shoulder pattern.
Not a recommendation. Watch and learn.
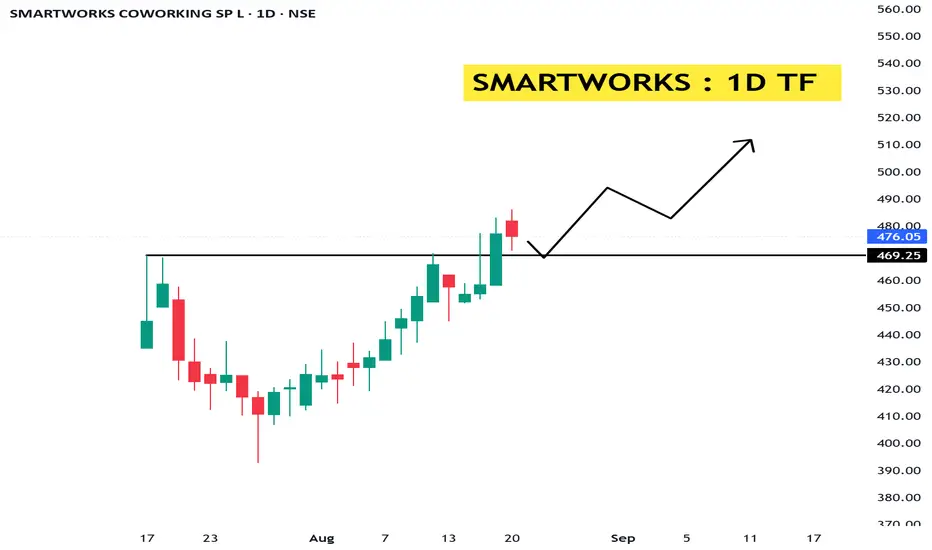
Smartworks: From IPO Buzz to Breakout ZoneNSE:SMARTWORKS
📊 Technical Analysis (Daily & Weekly Chart)
Trend: After listing in Aug 2025 around ₹407, the stock corrected to ~₹393 and then staged a strong rally towards ₹480. Currently consolidating near recent highs.
Current Price: ₹476.05
Resistance Levels:
₹480–₹490 (immediate supply zone)
₹520–₹550 (next major resistance)
Support Levels:
₹460 (short-term support)
₹420 (major support / breakout retest zone)
Chart Structure: Stock is forming a short-term bullish structure with higher highs and higher lows since early Aug. A weekly close above ₹490 may trigger continuation rally.
View: Sustaining above ₹490 can open upside towards ₹520–₹550; failure to cross may lead to pullback towards ₹460–₹420 support zone.
🏭 Fundamental Analysis
Business Model: Smartworks is India’s leading managed office space provider, offering flexible workspaces to corporates. Operates on a “space-as-a-service” model—leasing large commercial spaces, customizing, and sub-leasing to enterprises.
Growth Drivers:
Rising demand for flexible office spaces post-pandemic.
Corporate shift towards asset-light models.
Strong tailwinds from India’s IT, startup, and service sector growth.
Expansion across Tier-1 & Tier-2 cities.
Financials (FY25 & Q1 FY26): (approximate)
Revenue FY25: ~₹1,374 Cr (38.9% CAGR over 2 years).
EBITDA FY25: ~₹172 Cr (117% CAGR).
Net Loss FY25: ~₹63 Cr (loss narrowing).
Q1 FY26: Revenue ~₹379 Cr; Net Loss ~₹4 Cr (showing progress toward breakeven).
Market Cap: ~₹5,200 Cr.
Strengths:
Fastest-growing flexible office provider in India.
Strong corporate client base (enterprise-focused, not just startups).
Expanding in sync with India’s office demand cycle.
High revenue growth with improving operating margins.
Risks:
Still loss-making; breakeven depends on occupancy/utilization.
Highly competitive industry (WeWork, Awfis, IndiQube).
Lease liability-heavy model exposes risk during demand slowdowns.
Valuation expensive (P/B ~9x, negative P/E).
🎯 Conclusion
Technical View: Stock near crucial resistance ₹480–₹490. Breakout with volume can take it towards ₹520–₹550. Support at ₹460 / ₹420.
Fundamental View: Strong revenue growth and improving margins; leadership in flexible workspace model. IPO proceeds support expansion & debt reduction. Profitability is the key monitorable.
👉 Investor Stance:
Investors: Can accumulate gradually for long-term play on India’s office demand & corporate workspace outsourcing trend. Needs patience till profitability.
⚠️ Disclaimer:
This analysis is for educational and informational purposes only.
We are not SEBI-registered analysts or advisors.
This is our personal view based on available data and market trends.
Please consult your SEBI-registered investment advisor before making any investment or trading decisions.
You are solely responsible for any financial decisions you make based on this content.
========================
Trade Secrets By Pratik
========================
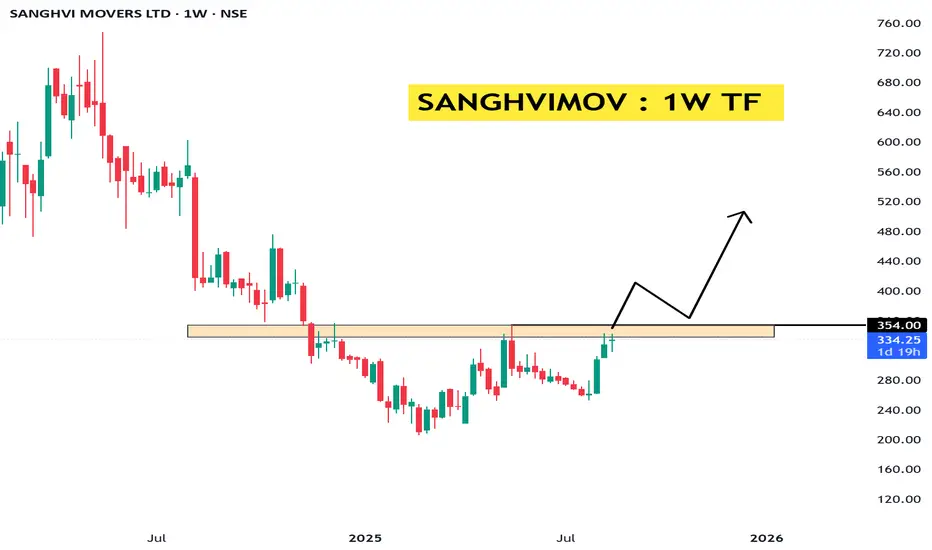
SHANGVIMOV : Heavy Lifter of India’s Infra GrowthNSE:SANGHVIMOV
📊 Technical Analysis (Weekly Chart)
Trend: After a steep fall from ~₹800 (2024 highs) to ~₹200 (2025 lows), the stock has been consolidating and is now attempting to break out of resistance near ₹350–₹360.
Current Price: ₹334.25
Resistance Levels:
₹350–₹360 (immediate supply zone, highlighted in your chart)
₹420–₹450 (next major resistance)
Support Levels:
₹300 (short-term support)
₹250 (major support, bottom zone)
Chart Structure: Formation of a rounding base; breakout above ₹360 on weekly closing can trigger momentum rally.
View: If price sustains above ₹360, potential upside towards ₹420–₹450; failure to break may lead to retest of ₹300.
🏭 Fundamental Analysis
Business Model: Sanghvi Movers Ltd is India’s largest crane rental company and among the top 10 globally. Provides heavy-lift, engineered transport & installation services, especially to wind energy, power, steel, cement, refinery, and infrastructure projects.
Growth Drivers:
Renewable energy push (especially wind and solar projects requiring heavy cranes).
Infrastructure growth under government’s capex focus.
Demand from steel, cement, oil & gas projects.
Financials (Latest FY24/25) (approximate):
Revenue: ~₹650–700 Cr.
Net Profit: ~₹120–130 Cr (steady growth).
Debt levels moderate; improved operating margins due to higher utilization of crane fleet.
Strengths:
Market leader with strong fleet of high-capacity cranes.
Asset-heavy model creates strong entry barriers.
Benefits from India’s renewable & infra capex cycle.
Risks:
Cyclical industry – earnings depend on capex cycles.
High capital expenditure (maintenance, fleet expansion).
Order inflow variability.
🎯 Conclusion
Technical View: Stock is at a crucial resistance zone (₹350–₹360). A breakout with volume could take it to ₹420–₹450. Support at ₹300.
Fundamental View: Strong long-term player in crane rental, directly benefiting from infra & renewable boom. Earnings visibility is improving with higher crane utilization.
👉 Investor Stance:
Investors: Long-term accumulation is possible; positioned well in the infra/renewable growth cycle, though cyclicality risk exists.
⚠️ Disclaimer:
This analysis is for educational and informational purposes only.
We are not SEBI-registered analysts or advisors.
This is our personal view based on available data and market trends.
Please consult your SEBI-registered investment advisor before making any investment or trading decisions.
You are solely responsible for any financial decisions you make based on this content.
========================
Trade Secrets By Pratik
========================
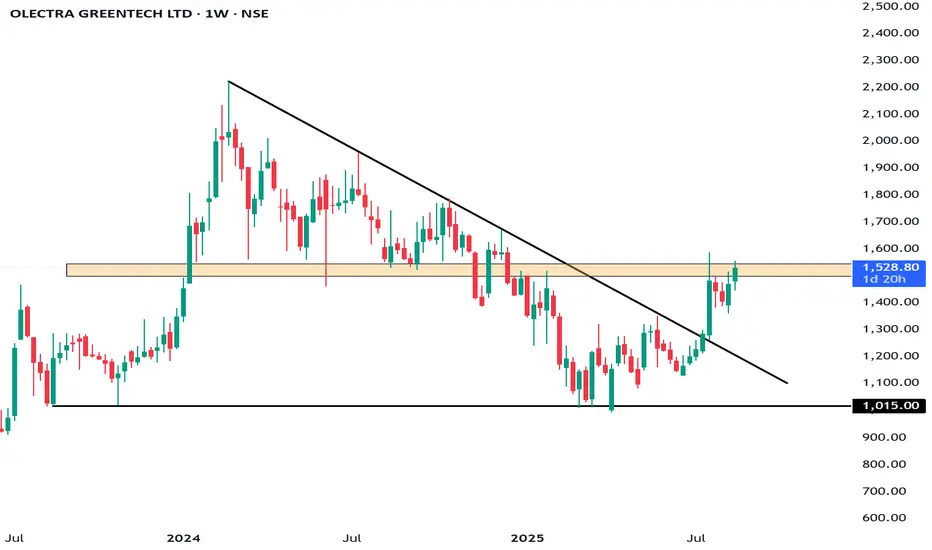
Olectra Greentech – The Silent EV Multibagger in MakingNSE:OLECTRA
📊 Technical Analysis (Weekly Chart)
Trend: The stock had a steep fall from ~₹1,800 (2024 highs) to ~₹1,000 (2025 lows). It has since formed a rounded bottom and is showing signs of reversal.
Current Price: ₹1,528.80
Resistance Levels:
₹1,600 (immediate resistance)
₹1,800 (major breakout level)
Support Levels:
₹1,400 (nearby support)
₹1,200 (major support, recent bottom area)
Indicators:
Momentum improving with strong green candles and higher lows.
Weekly structure suggests accumulation and potential trend reversal.
View: If stock sustains above ₹1,600, it can retest ₹1,800–₹2,000 in medium term.
🏭 Fundamental Analysis
Business Model: Olectra Greentech is India’s largest electric bus manufacturer, part of MEIL (Megha Engineering). It also works on tippers, EV trucks, and composite insulators.
Growth Drivers:
Government’s push for EV adoption in public transport (FAME-II scheme).
High demand for electric buses from state transport corporations.
Strong backing from parent MEIL ensures execution capacity.
Financials (Latest FY24/25) (approximate):
Revenue: ~₹1,300–1,400 Cr (growing rapidly with order wins).
Profit: Still moderate due to high R&D and capex.
Order Book: Over ₹12,000+ Cr, ensuring visibility for next 3–4 years.
Strengths:
Market leader in EV bus space.
Rising government contracts.
First-mover advantage.
Risks:
Execution delays (delivery timelines).
Intense competition from Tata Motors, Ashok Leyland.
Margin pressure due to high input and battery costs.
🎯 Conclusion
Technical View: Bullish reversal forming. Sustaining above ₹1,600 can lead to ₹1,800–₹2,000. Strong support at ₹1,200.
Fundamental View: Strong long-term growth story in India’s EV transition, backed by large order book and government support. Near-term volatility possible, but structurally a good EV play.
👉 Investor Stance:
Investors: Accumulate gradually for 3–5 years; could be a multibagger if execution sustains.
⚠️ Disclaimer:
This analysis is for educational and informational purposes only.
We are not SEBI-registered analysts or advisors.
This is our personal view based on available data and market trends.
Please consult your SEBI-registered investment advisor before making any investment or trading decisions.
You are solely responsible for any financial decisions you make based on this content.
========================
Trade Secrets By Pratik
========================
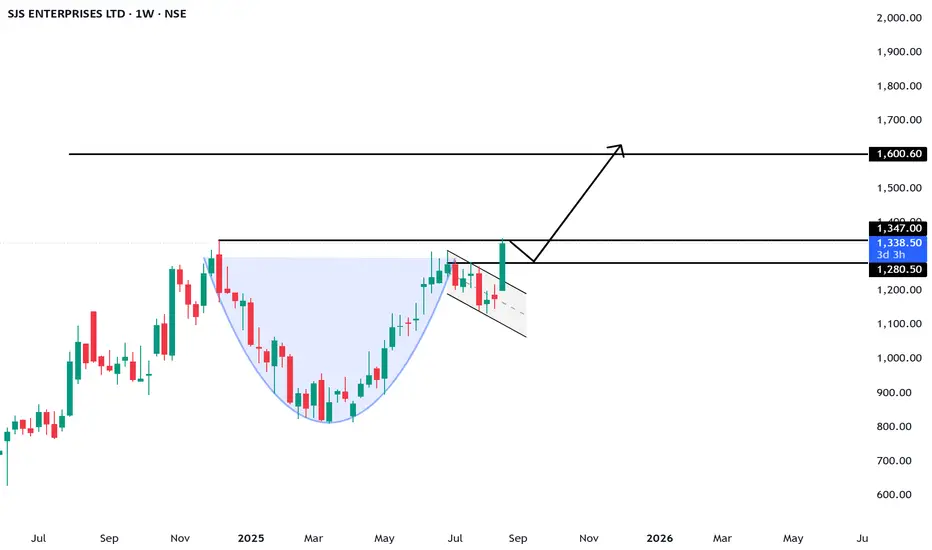
SJS Enterprises: The Silent Multi-bagger in the Making ??NSE:SJS
📌 SJS Enterprises Ltd. – Detailed Analysis Report
1. Company Overview
Leading decorative aesthetics solutions provider (decals, overlays, 3D appliqués, badges, domes).
Serves automotive, consumer appliances, and healthcare sectors.
Manufacturing in Bengaluru & Pune with exports to Europe, North America, Latin America, and ASEAN.
Strong OEM relationships and quality certifications.
2. Financial Performance
Revenue Growth: ₹370 Cr (FY22) → ₹760 Cr (FY25), CAGR ~26%.
Net Profit: ₹55 Cr (FY22) → ₹119 Cr (FY25), CAGR ~29%.
Margins: Stable ~15–16%.
Return Ratios: ROE ~18%, ROCE ~17%.
Debt Levels: Virtually debt-free.
3. Valuation Snapshot
Current Price: ~₹1,330.
P/E ~30x, P/B 5.5x → slightly expensive vs. fair value (₹950–1,000).
Analysts remain bullish with targets between ₹1,400–1,700.
4. Technical View
The stock recently broke out near ₹1,350 with strong momentum (+43% in last 6 months).
Support zone: ₹1,150–1,200.
Resistance: ₹1,350–1,400; breakout above could lead to ₹1,500+.
5. SWOT & Growth Prospects
Strengths: Diversified portfolio, strong financials, global reach, debt-free balance sheet.
Weakness: Expensive valuation, low dividend yield.
Opportunities: EV adoption, growth in appliances & healthcare aesthetics, acquisitions boosting scale.
Threats: Auto sector cyclicality, raw material cost pressures.
6. 3-Year Price Projection
Bull Case: ₹2,500–2,800 (23–27% CAGR) – if high growth and premium valuation sustain.
Base Case: ₹1,950–2,100 (13–16% CAGR) – steady growth with fair valuation.
Bear Case: ₹1,400–1,500 (1–4% CAGR) – slower growth and valuation compression.
7. Conclusion
SJS Enterprises is a high-quality, growth-oriented company with strong fundamentals, global presence, and minimal debt. Valuations are stretched, but long-term demand from EVs, appliances, and healthcare supports growth.
Long-term investors: Can hold for potential multibagger returns.
New investors: Best to enter on dips near ₹1,200–1,250.
Traders: Momentum above ₹1,400 can drive near-term rally toward ₹1,500+.
⚠️ Disclaimer:
This analysis is for educational and informational purposes only.
We are not SEBI-registered analysts or advisors.
This is our personal view based on available data and market trends.
Please consult your SEBI-registered investment advisor before making any investment or trading decisions.
You are solely responsible for any financial decisions you make based on this content.
========================
Trade Secrets By Pratik
========================
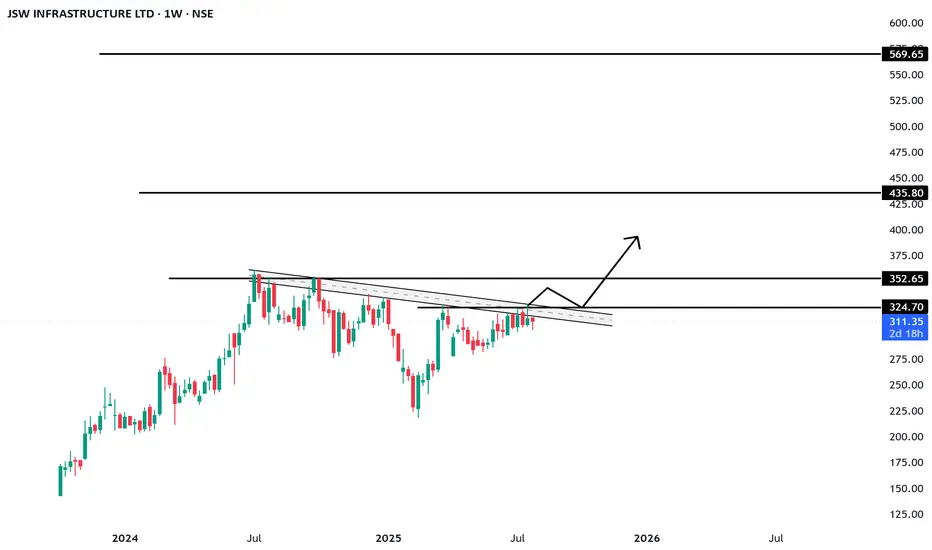
JSW-INFRA : Powering India’s Port Revolution – A Deep Dive into NSE:JSWINFRA
JSW Infrastructure Ltd.
🧾 Company Overview
Role: JSW Infrastructure is India's second-largest commercial port operator (after Adani Ports), and forms a core part of the JSW Group.
Operations: The company manages and operates major ports across both the east and west coastlines of India.
Revenue Streams: Primarily driven by port operations (handling bulk, breakbulk, containerized cargo), as well as integrated logistics services.
📊 FY24 Financial Snapshot
Revenue ₹3,200+Cr
EBITDA Margin 55–60%
Net Profit ₹750+Cr
Debt to Equity ~0.6x
ROCE ~15%
ROE ~13%
Positive aspects:
Asset Turnover Strong
Double-digit revenue CAGR (>20%) over the past three years.
High EBITDA margins consistent with best-in-class infra businesses.
Well-diversified cargo and customer profile, with increasing non-JSW business.
Stable long-term contracts & beneficiary of India’s logistics and trade reforms.
Risks / Weaknesses:
~70% revenue is from group companies, though diversification is underway.
Aggressive capex plans elevate financial risk.
Susceptible to regulatory, tariff, and environmental compliance changes.
📈 Technical Analysis (July 2025)
• Share Price: Trading in the ₹260–₹280 range. IPO was at ₹119 (Sep 2023); strong price appreciation since listing.
• Trend: Intact uptrend; recently consolidated between ₹240–₹260.
• Support/Resistance: Key support at ₹230–₹235; resistance at ₹285–₹300.
• Moving Averages: Stock remains above both its 50-EMA and 200-EMA — a structurally bullish indicator.
• Momentum:
o RSI: 60–65 (bullish, but approaching overbought)
o MACD: Fresh bullish crossover; volume shows accumulation near breakout.
• Outlook: Breakout above ₹285 could trigger medium-term upside toward ₹320–₹340. Buy-on-dips is favored, with strong accumulation likely in the ₹230–₹240 zone.
🚀 Growth Prospects & Strategic Moves
• Capacity Expansion: Plans to nearly double port capacity by FY30 (from ~160 MTPA to ~300 MTPA).
• Cargo Diversification: Targeting major reduction of group dependency (from ~70% to ~50%) by growing third-party cargo traffic.
• New Projects: Investment pipeline includes both greenfield and brownfield projects in Odisha, Maharashtra, and other states.
• Integrated Logistics: Deeper backward integration into rail connectivity and warehousing to capture higher value from logistics value chain.
• Macro Tailwinds
o Major government initiatives (e.g., Sagarmala) catalyzing sector growth.
o India’s trade/exports rising; strong outlook for cargo and container volumes.
o Shifts in supply chains to coastal shipping and blended logistics.
o Demand uptrend in containerization and warehousing services.
⚠️ Key Risks & Limitations
• High Capex Cycle: Expansion could elevate debt and financial leverage.
• Macro Sensitivity: Lower industrial/output growth would hit cargo volumes.
• Regulatory Overhang: Tariff and ESG regulations present chronic uncertainty.
• Group Concentration: Third-party cargo growth remains an execution challenge.
• Rivalry: Competitive intensity from Adani, DP World, and others is ramping up.
📌 Conclusion & Investment Verdict
Parameter Verdict
Fundamentals Strong, superior margins, efficient operations
Valuation Fair to premium (due to uptrend and growth)
Technical Trend Bullish, ready for potential breakout
Growth Outlook High (supported by sector tailwinds)
Risk Profile Moderate (driven by capex & regulatory factors)
For long-term investors:
JSW Infra presents a compelling case for portfolio inclusion, offering robust growth visibility, sectoral leadership, and operating excellence. Accumulation is best near ₹230–₹240 on dips.
Short-term view:
Stocks in strong uptrends may see minor corrections but are well-placed for fresh breakouts above ₹285, targeting ₹320–₹340.
The stock is ideal for investors seeking infrastructure-sector exposure with high growth potential, but one must remain mindful of execution and regulatory risks.
==============================
==============================
⚠️ Disclaimer:
This analysis is for educational and informational purposes only.
We are not SEBI-registered analysts or advisors.
This is our personal view based on available data and market trends.
Please consult your SEBI-registered investment advisor before making any investment or trading decisions.
You are solely responsible for any financial decisions you make based on this content.
========================
Trade Secrets By Pratik
========================
Update idea
Add note
Trade_Secrets_By_Pratik
Also on:
Disclaimer
The information and publications are not meant to be, and do not constitute, financial, investment, trading, or other types of advice or recommendations supplied or endorsed by TradingView. Read more in the Terms of Use.
English (India)
Select market data provided by ICE Data services.
Select reference data provided by FactSet. Copyright © 2025 FactSet Research Systems Inc.
© 2025 TradingView, Inc.
More than a product
Supercharts
Screeners
Stocks
ETFs
Bonds
Crypto coins
CEX pairs
DEX pairs
Pine
Heatmaps
Stocks
ETFs
Crypto
Calendars
Economic
Earnings
Dividends
More products
Yield Curves
Options
News Flow
Pine Script®
Apps
Mobile
Desktop
Tools & subscriptions
Features
Pricing
Market data
Trading
Overview
Brokers
Special offers
CME Group futures
Eurex futures
US stocks bundle
About company
Who we are
Athletes
Blog
Careers
Media kit
Merch
TradingView store
Tarot cards for traders
The C63 TradeTime
Policies & security
Terms of Use
Disclaimer
Privacy Policy
Cookies Policy
Accessibility Statement
Security tips
Bug Bounty program
Status page
Community
Social network
Wall of Love
Refer a friend
House Rules
Moderators
Ideas
Trading
Education
Editors' picks
Pine Script
Indicators & strategies
Wizards
Freelancers
Business solutions
Widgets
Charting libraries
Lightweight Charts™
Advanced Charts
Trading Platform
Growth opportunities
Advertising
Brokerage integration
Partner program
Education program
Look First
HDFC BANK LTD
NSE•Real-time•Market closed
Edit Idea
Minimize
Close
JSW INFRA : Powering India’s Port Revolution – A Deep Dive into
NSE:JSWINFRA
JSW Infrastructure Ltd.
🧾 Company Overview
Role: JSW Infrastructure is India's second-largest commercial port operator (after Adani Ports), and forms a core part of the JSW Group.
Operations: The company manages and operates major ports across both the east and west coastlines of India.
Revenue Streams: Primarily driven by port operations (handling bulk, breakbulk, containerized cargo), as well as integrated logistics services.
📊 FY24 Financial Snapshot
Revenue ₹3,200+Cr
EBITDA Margin 55–60%
Net Profit ₹750+Cr
Debt to Equity ~0.6x
ROCE ~15%
ROE ~13%
Positive aspects:
Asset Turnover Strong
Double-digit revenue CAGR (>20%) over the past three years.
High EBITDA margins consistent with best-in-class infra businesses.
Well-diversified cargo and customer profile, with increasing non-JSW business.
Stable long-term contracts & beneficiary of India’s logistics and trade reforms.
Risks / Weaknesses:
~70% revenue is from group companies, though diversification is underway.
Aggressive capex plans elevate financial risk.
Susceptible to regulatory, tariff, and environmental compliance changes.
📈 Technical Analysis (July 2025)
• Share Price: Trading in the ₹260–₹280 range. IPO was at ₹119 (Sep 2023); strong price appreciation since listing.
• Trend: Intact uptrend; recently consolidated between ₹240–₹260.
• Support/Resistance: Key support at ₹230–₹235; resistance at ₹285–₹300.
• Moving Averages: Stock remains above both its 50-EMA and 200-EMA — a structurally bullish indicator.
• Momentum:
o RSI: 60–65 (bullish, but approaching overbought)
o MACD: Fresh bullish crossover; volume shows accumulation near breakout.
• Outlook: Breakout above ₹285 could trigger medium-term upside toward ₹320–₹340. Buy-on-dips is favored, with strong accumulation likely in the ₹230–₹240 zone.
🚀 Growth Prospects & Strategic Moves
• Capacity Expansion: Plans to nearly double port capacity by FY30 (from ~160 MTPA to ~300 MTPA).
• Cargo Diversification: Targeting major reduction of group dependency (from ~70% to ~50%) by growing third-party cargo traffic.
• New Projects: Investment pipeline includes both greenfield and brownfield projects in Odisha, Maharashtra, and other states.
• Integrated Logistics: Deeper backward integration into rail connectivity and warehousing to capture higher value from logistics value chain.
• Macro Tailwinds
o Major government initiatives (e.g., Sagarmala) catalyzing sector growth.
o India’s trade/exports rising; strong outlook for cargo and container volumes.
o Shifts in supply chains to coastal shipping and blended logistics.
o Demand uptrend in containerization and warehousing services.
⚠️ Key Risks & Limitations
• High Capex Cycle: Expansion could elevate debt and financial leverage.
• Macro Sensitivity: Lower industrial/output growth would hit cargo volumes.
• Regulatory Overhang: Tariff and ESG regulations present chronic uncertainty.
• Group Concentration: Third-party cargo growth remains an execution challenge.
• Rivalry: Competitive intensity from Adani, DP World, and others is ramping up.
📌 Conclusion & Investment Verdict
Parameter Verdict
Fundamentals Strong, superior margins, efficient operations
Valuation Fair to premium (due to uptrend and growth)
Technical Trend Bullish, ready for potential breakout
Growth Outlook High (supported by sector tailwinds)
Risk Profile Moderate (driven by capex & regulatory factors)
For long-term investors:
JSW Infra presents a compelling case for portfolio inclusion, offering robust growth visibility, sectoral leadership, and operating excellence. Accumulation is best near ₹230–₹240 on dips.
Short-term view:
Stocks in strong uptrends may see minor corrections but are well-placed for fresh breakouts above ₹285, targeting ₹320–₹340.
The stock is ideal for investors seeking infrastructure-sector exposure with high growth potential, but one must remain mindful of execution and regulatory risks.
==============================
==============================
⚠️ Disclaimer:
This analysis is for educational and informational purposes only.
We are not SEBI-registered analysts or advisors.
This is our personal view based on available data and market trends.
Please consult your SEBI-registered investment advisor before making any investment or trading decisions.
You are solely responsible for any financial decisions you make based on this content.
========================
Trade Secrets By Pratik
========================
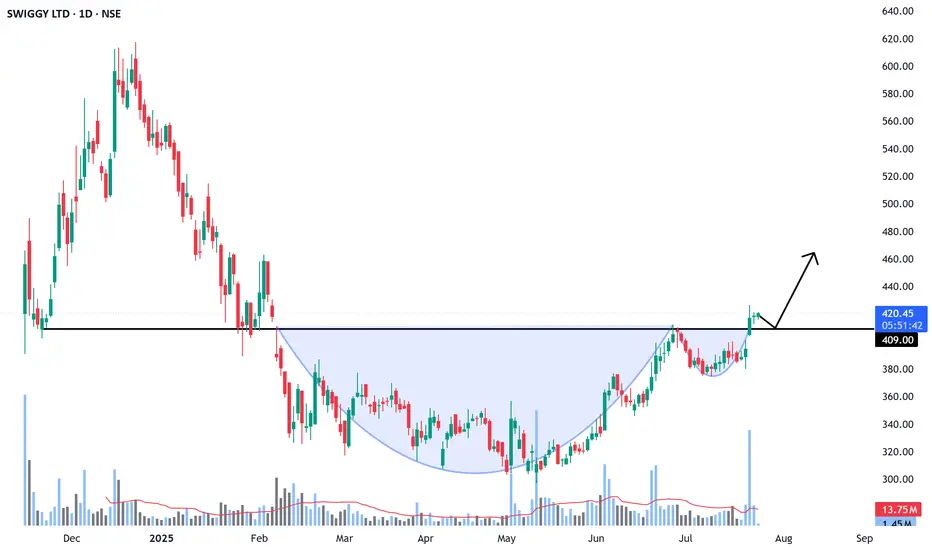
SWIGGY : Next Multi-bagger ??NSE:SWIGGY
🚀 SWIGGY LTD – Combined Technical + Fundamental Analysis
As of: 24 July 2025 | CMP: ₹420.50 |
📈 TECHNICAL ANALYSIS
🔷 Pattern: Cup and Handle Breakout
Cup & Handle pattern completed over 5 months (Feb–July 2025)
Breakout Level: ₹409 (marked horizontal resistance)
CMP: ₹420.50 — breakout confirmed with strong volume
Cup Depth: ₹409 – ₹285 = ₹124
🔍 Indicators & Price Action:
Price vs 50 EMA ✅ Above (bullish short-term trend)
Price vs 200 EMA ✅ Above (bullish long-term trend)
Volume ✅ Breakout confirmed with surge
RSI ~63 (strong but not overbought)
🔧 Key Levels:
Support Resistance Swing Target
₹409 (Breakout retest) ₹445 / ₹480 ₹533 (measured move)
Technical Verdict:
Bullish breakout from a long base. With volume confirmation and improving fundamentals, Swiggy is poised for a multi-week rally.
=======================================
📊 FUNDAMENTAL ANALYSIS
📈 1. Revenue Growth
Swiggy has shown consistent and impressive topline expansion over the past 3 years:
Financial Year Revenue (₹ Cr) YoY Growth
FY22 ₹5,705 –
FY23 ₹8,265 +45%
FY24 ₹11,115 +34%
FY25 (Est.) ₹14,500 +30% est.
Growth Drivers:
🚀 Instamart (Grocery) – fastest-growing vertical
🍽️ Food Delivery – steady in Tier I, expanding in Tier II/III
📍 Strong presence in metros, improving reach in smaller cities
💰 2. Profit Trajectory
Swiggy was known for heavy cash burn pre-IPO, but is now nearing profitability:
Financial Year Net Profit/Loss (₹ Cr) EBITDA (₹ Cr)
FY23 -₹4,179 -₹3,363
FY24 -₹1,482 -₹1,115
FY25 (Est.) +₹75 (Profit) +₹350
📉 Losses reduced by over 60% in 12 months
🔁 EBITDA-positive since Q4 FY25 — a major turning point
🛠️ Cost control, reduced discounting, and Instamart’s scale driving margin growth
🌱 3. Future Growth Prospects
Swiggy is now strategically positioned to capture multiple long-term themes:
Segment Outlook Comments
Instamart 🌟 High Growth 60%+ YoY growth, core revenue driver by FY26
Food Delivery 🔁 Steady to Moderate Strong in metros; Tier II/III scaling slowly
Dineout + Genie 🧊 Low Growth Not major contributors, but strengthen ecosystem
New Revenue 🧠 Ads, cloud kitchens High-margin potential in FY26/FY27
🧾 IPO proceeds deployed into logistics & tech infra (no major debt)
📈 Possible MSCI/Nifty Next 50 inclusion in FY26
🔓 Optionality: Entry into fintech/payments, loyalty programs, and dark kitchens
🔚 COMBINED VIEW – TECHNICAL + FUNDAMENTAL
Technical Pattern ✅ Cup & Handle breakout at ₹409
Revenue Trend ✅ Strong CAGR ~36%
Profit Outlook ✅ Profitability by FY25 end
Future Potential ✅ High – Instamart + Ads + Tier-II expansion
Risk ⚠️ Valuation premium + ONDC threat remains
⚠️ Disclaimer:
This analysis is for educational and informational purposes only.
We are not SEBI-registered analysts or advisors.
This is our personal view based on available data and market trends.
Please consult your SEBI-registered investment advisor before making any investment or trading decisions.
You are solely responsible for any financial decisions you make based on this content.
========================
Trade Secrets By Pratik
========================
REC LTD : PSU Power Stock at a Major Demand Zone..NSE:RECLTD
🔍 TECHNICAL ANALYSIS
1. Trend Overview
Primary Trend: Long-term bullish trend from late 2022 to early 2024, followed by a correction.
Current Trend: Consolidation in a sideways range after a correction from ₹644.70 to ₹400.
2. Fibonacci Retracement Levels
From ₹91.40 (low) to ₹644.70 (high):
50% level: ₹368.05 ✅ Price is hovering slightly above this.
61.8% Golden Ratio: ₹302.75 ✅ Strong demand zone.
These levels act as major support zones.
3. Support and Demand Zone
The shaded blue region (₹302–₹368) represents a strong demand zone with confluence from both:
Historical price action support.
Fibonacci 50–61.8% retracement levels.
Price bounced near this zone previously, indicating institutional interest.
4. Price Structure
Price has formed a higher low near ₹368 and is now consolidating between ₹390–₹410.
Sideways candles suggest low volatility accumulation, which can precede a breakout.
5. Volume Analysis
Volume has declined significantly since the top.
A small spike in volume during the bounce from the 50–61.8% zone hints at smart money accumulation.
Need confirmation with rising volume and bullish breakout above ₹420.
6. Key Technical Levels
Resistance (Swing High) ₹644.70
Intermediate Resistance ₹420–₹440
Current Price ₹400.00
Support Zone ₹368–₹302
============================
📊 FUNDAMENTAL ANALYSIS
============================
1. Business Overview
REC Ltd (Rural Electrification Corporation Ltd) is a Navratna PSU under the Ministry of Power.
Primarily lends to power generation, transmission, and distribution projects.
Also active in green energy, infrastructure & smart metering – aligned with India’s energy transition goals.
2. Financial Highlights (as of FY24-25)
Market Cap ₹1.05 Lakh Crore (approx)
P/E Ratio ~6.5x
Dividend Yield ~5.8%
ROE ~21%
Net Profit (FY24) ₹13,500+ Cr (growing YoY)
Gross NPA < 2%
Loan Book > ₹4.5 Lakh Cr
Consistent profit growth, strong asset quality, and high dividend yield make it a fundamentally sound stock.
3. Growth Drivers
Increased electrification & infrastructure projects.
Government's push for smart metering & green energy.
REC is also diversifying into non-power infra (railways, logistics, roads).
4. Valuation
At ₹400, stock is still undervalued based on fundamentals.
P/B and P/E both suggest attractive levels compared to historical averages and PSU peers.
5. Risks
Rising interest rates may affect lending margins.
PSU discounts can lead to slower rerating despite strong financials.
Political and regulatory risks.
🔄 Technical + Fundamental Confluence
📉 Price Correction: Healthy retracement near 50–61.8% zone = good entry for long-term investors.
🏗️ Strong Fundamentals: Profitable, growing book, high ROE, and PSU tailwinds.
🧠 Smart Money Activity: Signs of accumulation + base formation in key demand zone.
📈 Upside Potential: If ₹420–440 breaks out, REC could retest ₹520–600 in the medium term.
📝 Conclusion & Strategy
➕ Positives
Technically in a strong demand zone.
Fundamentally solid with high dividends and low valuation.
Smart money possibly accumulating.
⚠️ Caution
Wait for breakout above ₹420 with volume for confirmation.
Keep stop-loss below ₹368 (50% retracement) for swing trades.
💡 Investor Strategy
Investors: Accumulate in dips between ₹370–₹400 for long-term.
Traders: Buy breakout above ₹420 with target ₹480–₹520; SL: ₹388.
===================================================================
⚠️ Disclaimer:
This analysis is for educational and informational purposes only.
We are not SEBI-registered analysts or advisors.
This is our personal view based on available data and market trends.
Please consult your SEBI-registered investment advisor before making any investment or trading decisions.
You are solely responsible for any financial decisions you make based on this content.
========================
Trade Secrets By Pratik
========================

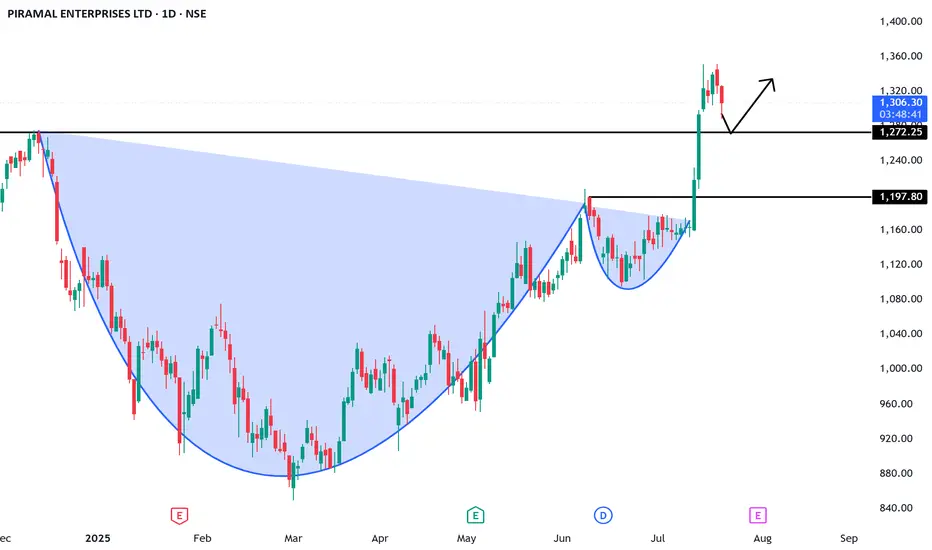
PEL : Is this just a breakout… or start of a multi-bagger move?NSE:PEL
🔍 Technical Analysis (Chart-Based)
📌 Pattern:
Cup and Handle Breakout clearly visible
Strong breakout above ₹1,197.80 neckline
Brief retracement after rally, likely testing ₹1,272.25 as support
📊 Key Levels:
Immediate Support: ₹1,272.25 (could act as a bullish retest)
Major Support: ₹1,197.80 (neckline of the cup and handle)
Resistance Zone: ₹1,360–1,400 (potential target zone post breakout)
🔄 Indicators & Momentum:
A strong bullish trend confirmed with higher highs and higher lows
Volume during breakout likely high (needs confirmation)
If price respects ₹1,272 and reverses, fresh upmove possible
🎯 Technical Summary:
Trend: Bullish
Bias: Buy on dips near support zones
Targets: ₹1,360, then ₹1,420
Stop Loss: Below ₹1,197
========================================
🧮 Fundamental Analysis (PEL - 2025 Outlook)
========================================
🏢 About the Company:
Piramal Enterprises Ltd operates mainly in:
Financial services (retail and wholesale lending)
Recent demerger of pharma business (PEL is now a pure NBFC)
📈 Key Financials (FY24–FY25E):
Metric Value
Market Cap ~₹30,000+ Cr
Revenue (FY24) ₹8,200+ Cr
Net Profit (FY24) ₹900+ Cr
P/E Ratio ~28–30x
Book Value ~₹1,300+
Price-to-Book (P/B) ~1.0x
ROE 6–8%
Debt/Equity ~0.8–1.0x
🔍 Key Positives:
Strong book value support
Low P/B indicates undervaluation vs peers
Cleaned-up balance sheet after pharma demerger
Focus on retail lending (more stable than wholesale)
⚠️ Risks to Watch:
Still consolidating after business restructuring
NBFC sector sensitive to interest rate cycles & RBI regulation
ROE still on the lower side compared to peers
=====================================
📌 Investment View (Short + Long-Term)
=====================================
✅ Short-Term View (1–3 months):
Technicals favor continuation of uptrend
Momentum can take it to ₹1,360–1,400 if support holds
✅ Long-Term View (6–18 months):
Strong restructuring play post-demerger
Clean balance sheet and pivot to retail NBFC is positive
Long-term target can be ₹1,600–1,800 if execution remains strong
========================================
⚠️ Disclaimer:
This analysis is for educational and informational purposes only.
We are not SEBI-registered analysts or advisors.
This is our personal view based on available data and market trends.
Please consult your SEBI-registered investment advisor before making any investment or trading decisions.
You are solely responsible for any financial decisions you make based on this content.
========================
Trade Secrets By Pratik
========================
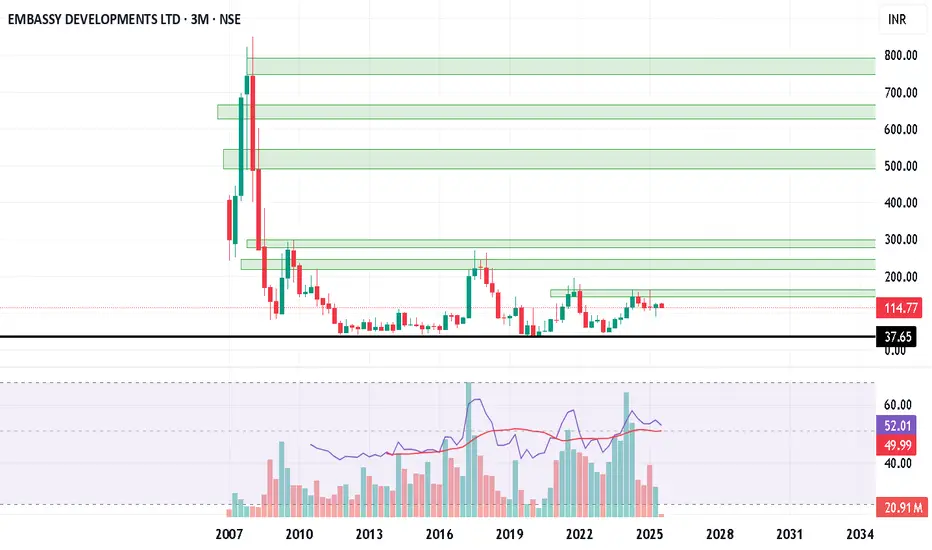
PLong
EMBDL, 3M, LONG Embassy developements, forming multi year base on quaterly chart. Higher volumes on upside on smaller time frame charts. Good to initiate a small position for investment, will more above 170. Will add more at 88-90. A potential multi bagger.