JTLIND: 3 year Downtrend Trendline Breakout, Chart of the WeekFrom ₹138 to ₹50: Why This Old Multi-Bagger Steel Stock Just Hit 20% Upper Circuit, Breaking 3-Year Downtrend and Getting a Big Order. Let's Understand in "Chart of The Week"
As per the Latest SEBI Mandate, this isn't a Trading/Investment RECOMMENDATION nor for Educational Purposes; it is just for Informational purposes only. The chart data used is 3 Months old, as Showing Live Chart Data is not allowed according to the New SEBI Mandate.
Disclaimer: "I am not a SEBI REGISTERED RESEARCH ANALYST AND INVESTMENT ADVISER."
This analysis is intended solely for informational purposes and should not be interpreted as financial advice. It is advisable to consult a qualified financial advisor or conduct thorough research before making investment decisions.
Price Action:
- Current Price: ₹72.29
- 52W High: ₹138.30
- 52W Low: ₹21.79
- The stock has recently broken above a critical downward trendline that had been in effect since mid-2024, showing strong reversal momentum with 15x average volume spike
Volume Spread Analysis:
Volume Characteristics:
- Average Volume: 1.42M shares
- Recent Spike: 21.33M shares (15x average)
- This represents exceptional institutional participation and strong momentum buying
- Historical volume spikes occurred during the 2021-2023 rally phase, suggesting similar strong hands accumulation
Volume Patterns:
- Volume dried up significantly during the downtrend, reaching multi-year lows near the ₹50 base
- This "spring" action with low volume at support followed by explosive volume on breakout is a classic Wyckoff accumulation pattern
- The volume bar chart shows distinct phases: high volume during 2023 rally, declining volume during correction, and massive spike on recent breakout
Volume-Price Correlation:
- The stock showed positive volume-price correlation during the breakout, confirming institutional buying
- Previous high-volume days in 2023 coincided with price rallies, suggesting volume leads price for this stock
- Current volume expansion suggests a potential multi-week rally ahead
Base Formation and Support Levels:
- Primary Base: ₹50-55 zone (marked with horizontal green dashed line)
- This base represents a critical accumulation zone where most institutional hands exchanged during the 2021-2022 period
- The stock tested this support multiple times between 2021-2022 before the explosive rally to ₹138
- Recent re-test of this base in late 2025/early 2026 at ₹50-52 suggests strong institutional buying interest
- Secondary Support: ₹21-22 zone represents the absolute low and panic bottom
Resistance Levels:
- Immediate Resistance: ₹80-85 zone
- Major Resistance: ₹95-100 (previous consolidation area in mid-2025)
- Critical Resistance: ₹110-115 zone
- Ultimate Resistance: ₹120-125 (prior to all-time high of ₹138.30)
Trendline Analysis:
- A clear downward trendline has been connecting lower highs since the peak at ₹138.30
- This trendline acted as resistance throughout 2024-2025, rejecting multiple bounce attempts
- Recent breakout above this trendline with massive volume confirms trend reversal
- The breakout occurred at approximately ₹60-62 level, suggesting the downtrend has been structurally broken
Breakout Confirmation:
- The recent 40% single-day rally with 20% upper circuit suggests strong momentum
- Breakout above the descending trendline with volume confirmation is a textbook bullish signal
- The stock reclaimed the ₹70 level, which previously acted as support-turned-resistance
Sectoral Backdrop:
Industry Overview:
- JTL Industries operates in the Steel Pipes & Tubes manufacturing sector, specifically focused on Electric Resistance Welded (ERW) pipes
- The company is positioned in the Basic Materials sector, under Steel & Iron Products subsector
- It serves critical end-use industries including Infrastructure, Oil & Gas, Power Transmission, Water Management, and Construction
Market Position:
- JTL is among the top 5 steel tube manufacturers in India and the largest ERW pipe manufacturer in North India
- Current manufacturing capacity: 9,36,000 MTPA (Metric Tons Per Annum) across 4 state-of-the-art facilities
- Geographic presence: Pan-India domestic market plus exports to 20+ countries across 5 continents
- Product portfolio: 1,200+ SKUs covering MS Black pipes, Galvanized pipes, Hollow sections, Solar mounting structures, Transmission towers, and specialty products
Sectoral Growth Drivers:
- Infrastructure Boom: India's infrastructure spending is accelerating with massive government projects including Bharatmala (34,800 km highways), PM-AWAS housing program, and Smart Cities 2.0
- Steel Demand Growth: India's steel demand is projected to grow at approximately 9% CAGR during 2025-2026, the highest globally according to World Steel Association
- Pipe Market Expansion: The Indian steel pipes market is expected to grow from USD 32.88 billion (2023) to USD 37.69 billion by 2030 at a CAGR of 6.43%
- Government Policy Support: Production Linked Incentive (PLI) scheme for specialty steel worth ₹27,106 crore and preferential procurement mandates support domestic manufacturers
- Power Sector Growth: Significant investments in power transmission infrastructure across India creating sustained demand for transmission towers and related products
Sector Challenges:
- Raw Material Volatility: Steel prices remain subject to global commodity cycles, coal costs, and iron ore price fluctuations
- Chinese Competition: China's steel oversupply and export surge create pricing pressure
- Environmental Regulations: EU's Carbon Border Adjustment Mechanism (CBAM) effective 2026 could add USD 80-397 per ton cost to exports
- Working Capital Intensity: Industry characterized by high working capital requirements (JTL's working capital days increased from 100 to 147 days)
Fundamental Backdrop:
Business Model:
- Integrated manufacturer of ERW steel pipes with backward integration capabilities
- Recent acquisition of 67% stake in Nabha Steels & Metals adds 2 lakh MT HRC (Hot Rolled Coil) capacity
- Diversified customer base across B2B, B2G, OEMs, and international markets reduces concentration risk
- Distribution network of 800+ dealers/distributors ensures strong market reach
Recent Corporate Actions:
- Major Order Win: Secured significant order from Punjab State Transmission Corporation Limited (PSTCL) for manufacturing 220kV transmission tower material and substation structures
- Execution Timeline: Order to be completed within FY 2025-26
- Strategic Significance: This order reinforces JTL's positioning in the power transmission infrastructure segment
- Stock Impact: The PSTCL order announcement triggered a 20% upper circuit rally, demonstrating market confidence
Financial Performance Snapshot:
- Q2 FY26 Revenue: ₹371 crores (down 22% YoY from ₹480 crores)
- Q2 FY26 EBITDA: ₹29 crores
- EBITDA Margin: Improved to 8% (from 6% YoY)
- EBITDA per ton: Increased 29% YoY to ₹4,247
- Market Capitalization: Approximately ₹2,360 crores
- Sales Mix: 88% domestic, 12% exports
Operational Efficiency Metrics:
- Despite revenue decline, operational efficiency has improved as evidenced by EBITDA margin expansion
- Higher EBITDA per ton suggests better realization and product mix optimization
- Working capital pressure visible with debtor days increasing from 40.1 to 52.8 days
Growth Catalysts:
- Capacity Expansion: With acquired Nabha Steels capacity, total capacity stands at 6 lakh MT for pipes + 2.5 lakh MT HRC + 1 lakh MT long products
- Product Diversification: Expansion into solar mounting structures, transmission towers, and specialty products reduces cyclicality
- Export Growth Potential: Recognition as "Star Export House" by Government of India supports international expansion
- Green Transition: Focus on sustainable practices and potential for green steel production aligns with global trends
Management & Governance:
- Promoter holding remains stable with recent inter-se transfers within promoter group
- ISO 9001:2015 certified operations demonstrating quality commitment
- Established in 1991, providing 30+ years of industry expertise
- Leadership under Pranav Singla (Executive Director) has articulated growth strategy and export targets
Competitive Landscape:
- Key competitors include APL Apollo Tubes, Rama Steel Tubes, Hi-Tech Pipes, Sambhv Steel
- Industry seeing consolidation with smaller players struggling with working capital and raw material costs
- JTL's integrated model and backward integration through Nabha Steels acquisition provides competitive advantage
Valuation Considerations:
- 5-Year Returns: Stock has delivered 312% returns over 5 years vs NIFTY 50's 79%
- Despite recent correction from ₹138 to ₹50, long-term value creation trajectory remains intact
- Current levels around ₹72 offer attractive entry for investors with 2-3 year horizon
- Recent order wins and capacity additions support earnings growth potential
Bull Case:
- Technical breakout from multi-month downtrend with exceptional volume confirmation
- Strong sectoral tailwinds from India's infrastructure boom and 9% steel demand growth
- Recent PSTCL order validates competitive positioning and execution capabilities
- Improved operational efficiency despite revenue headwinds
- Capacity expansion and backward integration strengthen margin profile
- Government policy support through PLI schemes and procurement preferences
Bear Case:
- Revenue declined 11% YoY in Q2 FY26, indicating near-term demand challenges
- Working capital pressure with increased debtor and working capital days
- Raw material cost volatility remains a persistent risk
- Global trade uncertainties and potential CBAM impact on exports
- Chinese steel oversupply creating pricing pressure
- Technical pattern needs confirmation with sustained trading above ₹65-70 zone
Key Monitorables:
- Quarterly revenue and EBITDA trend in coming quarters
- Execution and revenue recognition from PSTCL order
- Raw material cost trends and margin sustainability
- Order book build-up from infrastructure projects
- Working capital management improvements
- Technical price action: Holding above ₹65-70 support zone would confirm bullish reversal
My 2 Cents:
NSE:JTLIND presents an interesting technical setup following the breakout from a prolonged downtrend, supported by a major order win and improving operational metrics. The stock's 15x volume spike and 20% upper circuit rally suggest strong institutional interest resuming after extended consolidation at the ₹50-55 base.
From a sectoral perspective, the company is well-positioned to benefit from India's infrastructure boom, power transmission expansion, and robust steel demand growth. The recent PSTCL order validates its competitive capabilities in the high-value transmission infrastructure segment.
Full Coverage on my Mid-Week Newsletter coming Wednesday.
Keep in the Watchlist and DOYR.
NO RECO. For Buy/Sell.
📌Thank you for exploring my idea! I hope you found it valuable.
🙏FOLLOW for more
👍BOOST if you found it useful.
✍️COMMENT below with your views.
Meanwhile, check out my other stock ideas on the right side until this trade is activated. I would love your feedback.
As per the Latest SEBI Mandate, this isn't a Trading/Investment RECOMMENDATION nor for Educational Purposes; it is just for Informational purposes only. The chart data used is 3 Months old, as Showing Live Chart Data is not allowed according to the New SEBI Mandate.
Disclaimer: "I am not a SEBI REGISTERED RESEARCH ANALYST AND INVESTMENT ADVISER."
This analysis is intended solely for informational purposes and should not be interpreted as financial advice. It is advisable to consult a qualified financial advisor or conduct thorough research before making investment decisions.
Multibaggerstock

DALMIA BHARATHello & welcome to this analysis
Technical Outlook:
In the monthly time frame its completing the formation of a Cup & Handle breakout suggesting upside levels for medium term 2800 - 3500, for long term 3800 - 5000
Accumulation can be done in the range of 1900 (on downside) 2300 (on the upside).
The view would be invalid if it goes below 1700
Fundamental Outlook
Cost and operational efficiency focus
Recognized as one of the lowest-cost cement producers in India, thanks to measures such as increased use of blended cement, alternative fuels, optimization of lead distances
As of FY25, DBL reported a net debt to EBITDA ratio of ~0.3×, indicating a relatively comfortable leverage position for now.
Growth ambition/scale expansion
The company has achieved an installed capacity milestone of ~49.5 Mtpa (million tones per annum) of cement in FY25. It has set a long-term target of 110-130 Mtpa by ~FY31.
Regional presence & market opportunity
DBL has a strong footprint in the East & South of India, which are seen as growth regions. For example, the FY25 press release emphasized expansion in the East.
Where could margin gains realistically come from?
Better pricing / improved net realizations (higher NSR/ton).
Cost reductions: fuel/coal optimization, higher renewables share, freight savings and logistics efficiency.
Product mix shift to premium / blended cement with higher realizations.
Scale / utilization improvements (spreading fixed cost)
All the best

SUBEX LTDNo BUY or SELL Recomendation
Fundamentals need to be Analysed
Just Technical Analysis shared here
I'm not at SEBI Registered Analyst

JSWENERGY Quarterly Breakout#jswenergy Strong Breakout and Sustaining strongly on Quarterly Chart.
Good to Hold for Swing, Short and Long-term #Investment.
Strong on Technical's.
Charts never Disappoint me !

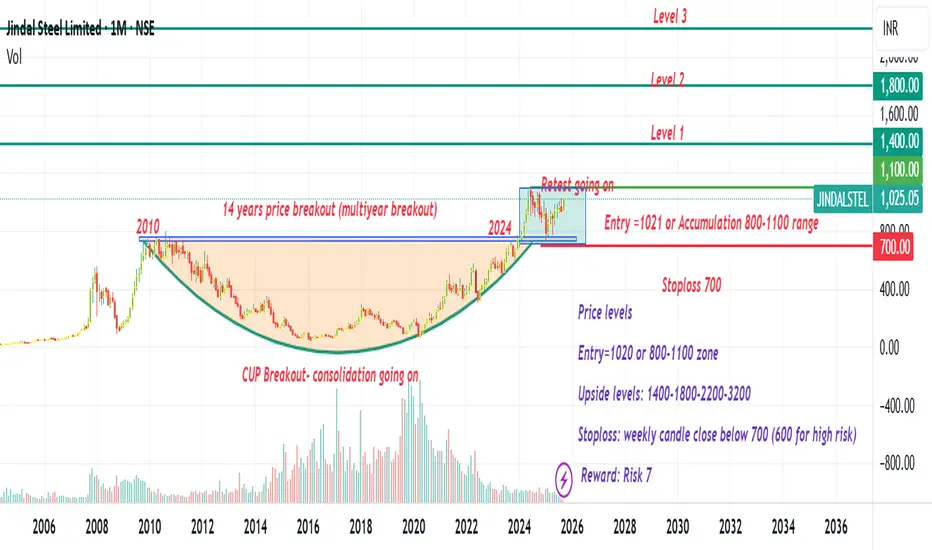
Jindal Steel multiyear price breakout #Nifty #JINDALSTELPrice is breaking out after 14 years, showing a multi-year price breakout.
Maybe a a Good chance for a Multi-bagger return
Entry: Current price or 800-1100 range
Stoploss: monthly or weekly close below 700
Upside levels: 1100-1400-1800-2200-3200
Analysis just for a learning point of view
Not a recommendation
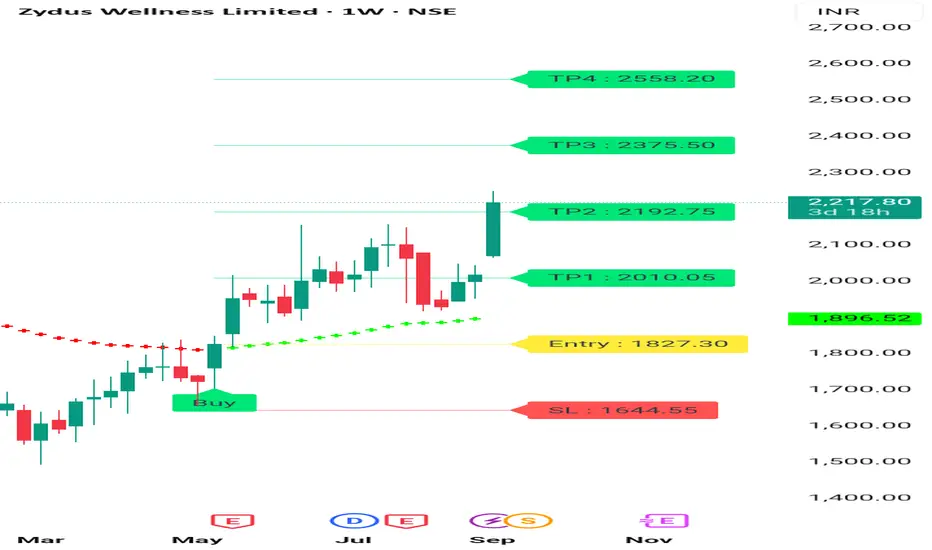
ZYDUS Wellness Weekly Chart Zydus wellness Given Good movement on Acquisition. Zydus wellness Given Weekly breakout, it's forming Rounding Pattern . Next tgt may be 2450 + 2500 in next 3 -6 months. Consult your financial advisor before making any position in this stock .
Rallis - 1. After reaching the pink channel top during the year 2010, it started moving sideways with very little inclination only to touch the other side of the parallel channel.
2. While going sideways,it formed the blue parallel channel. Whenever it touched the blue parallel channel bottom, it climbed higher to its top. Now it touched the bottom of the pink parallel channel + blue parallel channel+ support line of 254+ fib 0.618 retracement.
3. All the above led the strong foundation for its bullish rally and already gave 50% in 3 months.
4. Trade setup:
a. After reaching the blue channel top, it it comes to 254, its good to enter as a aggressive entry.
b. As a conservative entry, entry should be done only after the successful strong breakout above the blue channel and 362 resistance and it should sustain above it for 3 months.
c. Once the above is done, target will be minimum 5x in very long term.
Note: This is for educational purpose and not a stock recommendation.

Apollo Micro-Do not miss this Volume breakout!Apollo Microsystems has given a breakout of consolidation with a strong weekly closing, almost forming a bullish marubozu candle
Stock will look good only when it retest level of 110 and bounces.
Levels mentioned on chart. I will not buy at CMP.
Stock has potential to fly at least towards 200 according to fib extension.
It is too good of breakout to miss. I have hardly seen such a bullish weekly candle recently when Nifty has been slight bearish.

Frontier spring retesting multi year breakout Buy frontier spring cmp 405 buy till 385 sl 240 tgt 1000+++ keep an eye on frontier spring for longer term investment
The orders for manufacturing of Springs/Forging for Linke–Hofmann Busch(LHB) coaches and Electric Locomotives Springs such as WAP7 and WAG-9 which were being imported till date by Indian Railways continues manifold.
Focus
Plans to buy a Six Ton Hammer to forge new products which was earlier not possible due to capacity constraints.
It signed an agreement with Crescendo Worldwide which is an International Trade Organization for growing business globally. It has helped boost their sales and procured many profitable orders from Indian Railways

Bullish Flag Breakout in Marico. A Potential Upside OpportunityStock: Marico Ltd. (NSE: MARICO)
CMP: ₹715
Buy Above: ₹715
Stop Loss: ₹678
Target Levels: ₹729.50, ₹745.20, ₹761.25, ₹777.60, ₹794.30, and ₹810 (Final Target)
Time Frame: Short to Medium Term
🏢 About the Company: Marico Ltd.
Marico Limited is one of India's leading consumer goods companies operating in the beauty and wellness space. With well-known brands like Parachute, Saffola, Hair & Care, Set Wet, and Livon, Marico has a strong domestic presence and a growing international footprint across emerging markets in Asia and Africa. The company is known for consistent performance, strong cash flows, and product innovation in the fast-moving consumer goods (FMCG) sector.
Sector: FMCG
Market Cap: Approx. ₹91,000 Cr (as of April 2025)
Headquarters: Mumbai, Maharashtra
NSE/BSE Code: MARICO
🔍 Technical Analysis
A bullish flag breakout has been observed on the daily chart, indicating a potential continuation of the uptrend. Key observations:
Strong volume spike confirms buyer interest at breakout levels.
The price broke above the flag pattern with a decisive close above the resistance trendline.
Moving averages are aligned in a bullish formation (price > 20 EMA > 50 EMA).
RSI near 62 and rising, without being overbought, supports further upside.
This setup aligns with classic flag pattern breakout behavior, offering an excellent risk-reward ratio.
📊 Trade Setup
Entry Stop Loss Target 1 Target 2 Target 3 Target 4 Target 5 Final Target
₹715 ₹678 ₹729.50 ₹745.20 ₹761.25 ₹777.60 ₹794.30 ₹810
⚠️ Disclaimer
This analysis is for educational and informational purposes only.
I am not a SEBI-registered advisor. All trading and investment decisions should be made based on your own research or consultation with a qualified financial advisor. Stock markets involve risks, and past performance is not indicative of future results. Please use proper risk management and position sizing strategies when trading.
Don't forget to Follow for more such Ideas

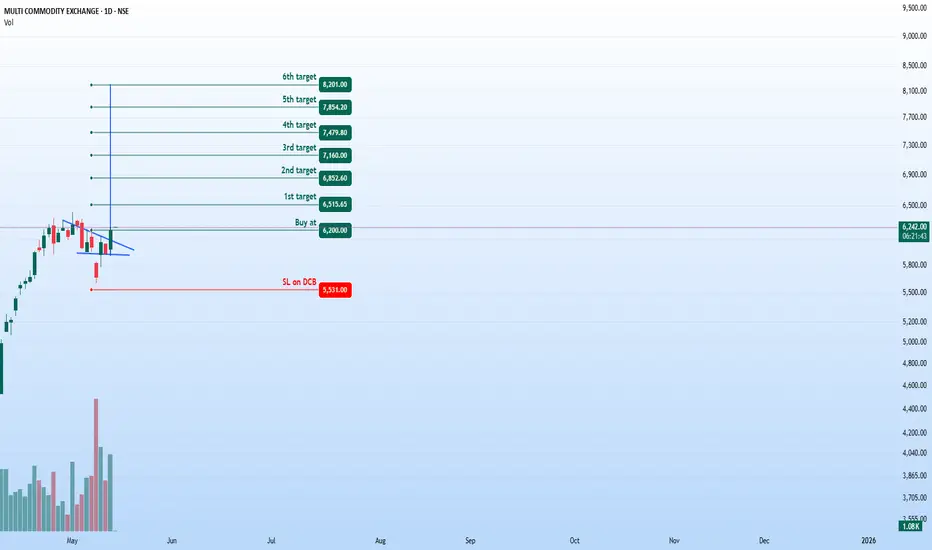
MCX - Bullish Breakout Opportunity (Daily Timeframe)Stock: MCX ( NSE:MCX )
Trend: Bullish Momentum Building 🚀
Risk-Reward Ratio: 1:3 (Favorable Setup)
Trade Parameters
🎯 Entry Zone: ₹6,200 (Breakout Confirmation)
🛑 Stop Loss: ₹5,531 (Daily Closing Basis) (~10.8% Risk)
🎯 Target Levels:
₹6,515.65
₹6,852.60
₹7,160.00
₹7,479.80
₹7,854.20
₹8,200 (Final Target)
Technical Rationale
✅ Bullish Flag Breakout - Price has broken out from consolidation pattern
✅ Strong Momentum - Daily & Weekly RSI >60 (Bullish territory)
✅ Volume Confirmation - Breakout volume 868K vs previous day's 571K (~52% increase)
✅ Technical Structure - Higher highs and higher lows formation
Key Observations
• The breakout comes with significantly higher volume
• Multiple targets allow for progressive profit booking
• Attractive 1:3 risk-reward ratio
• Strong technical structure supporting bullish case
Trade Management Strategy
• Consider partial profit booking at each target level
• Move stop loss to breakeven after Target 1 is achieved
• Trail stop loss to protect profits as price progresses
• Watch for volume confirmation on upside moves
Disclaimer ⚠️
This analysis is strictly for educational purposes and should not be construed as investment advice. Trading in financial markets involves substantial risk and is not suitable for all investors. Past performance is not indicative of future results. Always conduct your own thorough research and consult with a qualified financial advisor before making any investment decisions. The author assumes no responsibility for any trading losses that may occur from using this information.
What do you think? Are you watching this breakout on NSE:MCX ? Share your views in the comments!
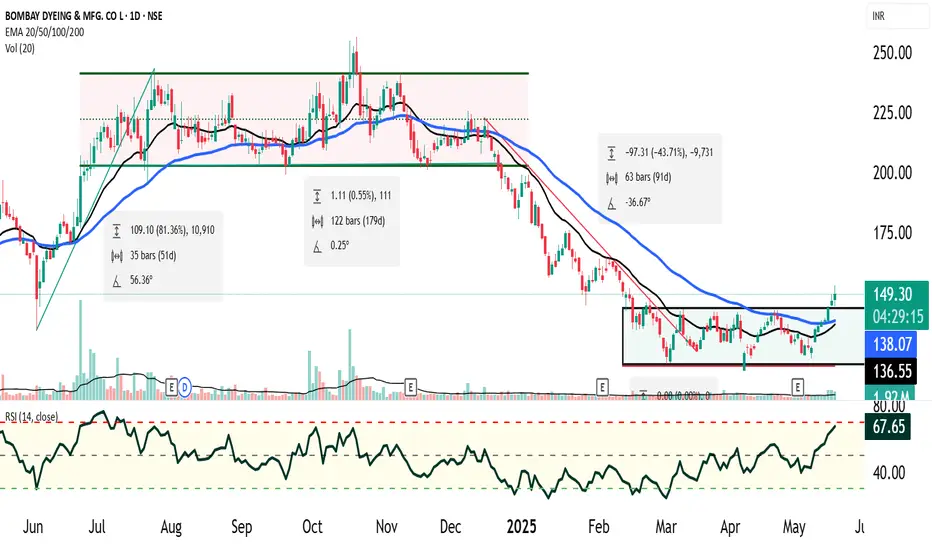
Bombay Dyeing : Market Cycle Recap✅ 1. Markup Phase (4 June 2024 – 25 July 2024)
Price movement: ~80% rally.
1. RSI behavior: RSI stayed above neutral (never oversold), frequently nearing overbought.
2. Volume: Increasing — confirmation of strong upside momentum.
3. Participants: Smart money and institutions led the rally.
🚨 2. Distribution Phase (~6 Months)
Price action: Sideways movement in a 20% range
1. Volume: Likely choppy or decreasing, with spikes on down days — a classic distribution sign.
2. RSI: Range-bound between 40–60 — no trend, loss of momentum.
3. Participants: Institutions unloading to retail/inexperienced participants.
🔻 3. Markdown Phase
Breakdown: Support breached after distribution range.
1. Price movement: Dropped ~50% from support breakout.
2. RSI: Frequently oversold — sign of strong weakness.
3. Volume: Likely increased on down days — panic selling.
🧱 4. Accumulation Phase (Last 3 Months)
Price action: Consolidated in ~15% narrow range.
1. RSI: Did not touch oversold zone — indicates seller exhaustion.
2. Participants: Value investors, smart money slowly building positions.
3. Volume: Gradually increasing — early signs of interest.
🔔 Current Technical Signal (20 May 2025)
Breakout: Price has now closed above the resistance of the accumulation range.
Volume: Above-average — confirms breakout strength.
1. RSI: Approaching overbought zone — sign of bullish momentum returning.
2. Price is above 20 EMA and 50 EMA.
3. Expected bullish crossover or confirmation already happened.
📊 Interpretation: Strong Bullish Reversal in Progress
Smart money has likely finished accumulating. Breakout from the accumulation zone with volume, RSI trend, and moving average confirmations all suggest the early stage of a new markup phase is starting. This could be the start of a fresh uptrend or the first leg of a longer bullish swing, especially if:
Broader market supports cyclical or value stocks.
Company-specific fundamentals (earnings, business outlook) align with technical cues.
✅ Actionable Steps (Not Financial Advice)
Entry:
Traders: Consider entry near breakout retest (if occurs).
Investors: Start building position gradually if long-term reversal is confirmed.
Risk Management:
Stop-loss: Just below the accumulation range (tight) or recent swing low (looser).
Position sizing based on volatility and risk appetite.
Targets:
Near-term: 15–20% move based on accumulation range height.
Medium-term: 50–80% potential if this is a true markup phase (mirroring last cycle).
Confirmation Factors:
Look for increasing volume in subsequent up candles.
Weekly close above breakout zone.
Fundamental support (news, earnings upgrade, insider buying, etc.).
If you'd like, I can also:
Draw a price cycle chart based on your description.
Help you draft a trade plan or investment thesis.
Pull recent news or updates on Bombay Dyeing (using live data).
Let me know how you'd like to proceed!
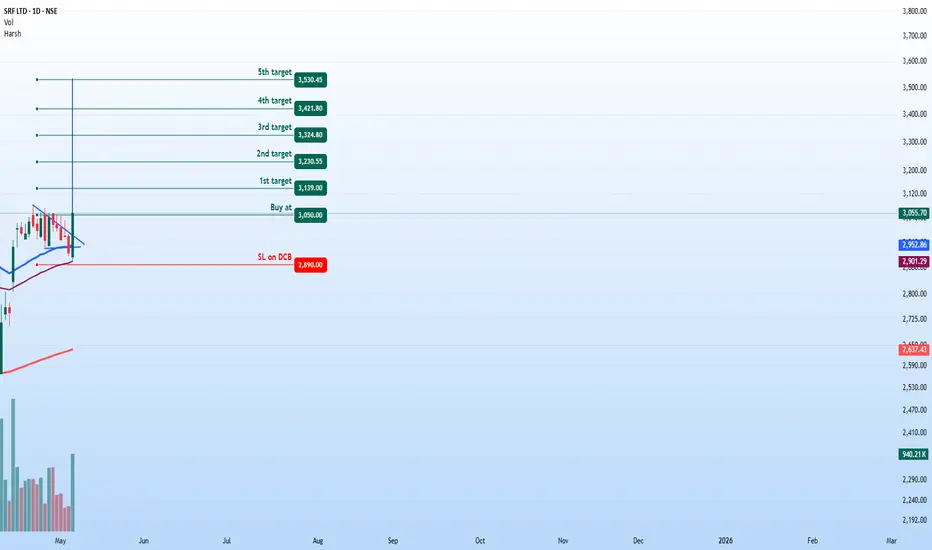
SRF – Bullish Breakout OpportunityStock Name: SRF Limited ( NSE:SRF )
Trend: Bullish 🚀
Timeframe: Daily
Trade Setup
Entry Zone: ₹3,050 (Breakout confirmation)
Stop Loss: ₹2,890 (~5.2% risk)
Targets:
T1: ₹3,139
T2: ₹3,230.55
T3: ₹3,324.80
T4: ₹3,421.80
Final Target: ₹3,530.45
Technical Rationale
✅ Bullish Flag Breakout – Price broke out of a consolidation pattern, signaling continuation.
✅ 200 DEMA Support – Strong bounce from the 200-day Exponential Moving Average.
✅ RSI Strength – Daily & Weekly RSI >60 (bullish momentum intact).
✅ Volume Surge – Breakout volume (940K) was 3x+ the previous day (300K), confirming strong buying interest.
Risk Management
Strict SL – Exit if ₹2,890 is breached on daily closing basis.
Trail SL – After hitting T1/T2, move SL to breakeven or higher.
Partial Booking – Consider taking profits at each target.
Disclaimer
This post is for educational purposes only and not investment advice. Trading involves risks, including capital loss. Past performance doesn’t guarantee future results. Always conduct your own analysis or consult a financial advisor before trading. The author holds no liability for financial decisions made based on this content.
Thoughts? Are you watching NSE:SRF for this breakout? Drop your views below! 👇
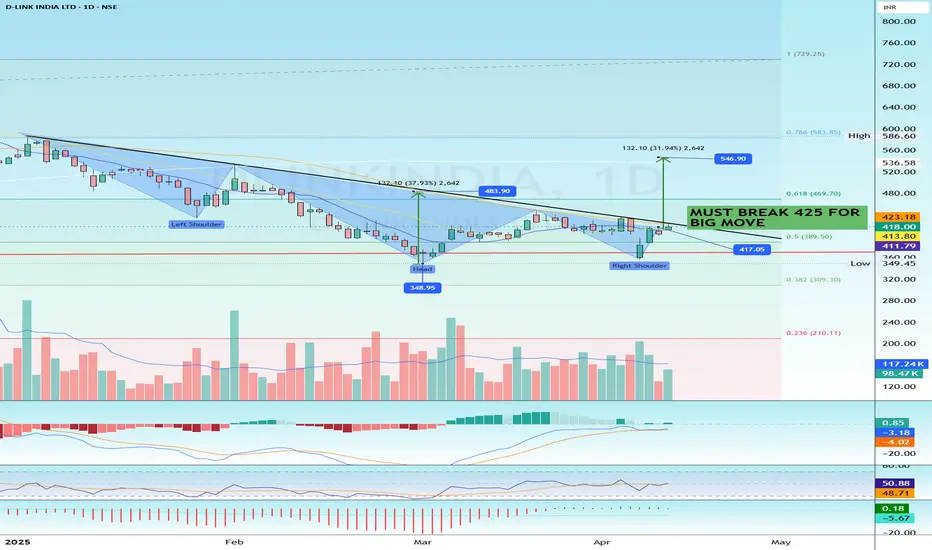
DLINK INDIA: A major beneficiary from Data Center theme. Interesting setup in DLINK-INDIA: Current Price ₹ 420
Dlink is a very well known name in the Internet hardware industry and we all have our DLINK modems at home or offices. Not just that the company has a vast product line that rages from Home to Businesses like Switching, Security cameras, Networking and accessories.
I want to draw the attention to the crazy interesting fundamentals in addition to the technicals i have shared.
Market Cap: ₹ 1,492 Cr. Sales: ₹ 1,341 Cr. Enterprise Value: ₹ 1,462 Cr.
High / Low: ₹ 729 / 295
Stock P/E: 14.8 Industry PE: 28.2
Debt to equity: 0.01
ROCE : 29.5 %
ROE: 22.3 %
Debt: ₹ 5.61 Cr.
Equity capital ₹ 7.10 Cr.
EPS: ₹ 28.3
Current ratio: 2.81
Pledged percentage: 0.00 %
These are essentially the parameters that any big investor with heavy buying capacity would look at. A no debt company with aggressive ROCE & ROE with a bright future ahead.
The stock is heavily corrected, see this as a sale and it has all the potential to go back to 700+ levels because investors will buy these companies first. Now it is forming Inverse Head and Shoulder pattern that can result to target of 550+
Again, these are my ways of understanding so I can't give any buy of sell recommendation. Please consult your financial advisors, they might agree too:)
Do boost the post, if you get value from it.
Trading Opportunity: Kabra Extrusiontechnik (Daily Flag BreakoutStock: NSE:KABRAEXTRU
Pattern: Flag Breakout (Daily Chart)
Type: Short to Medium-Term Trade
Trade Details
Buy Level: ₹513
Stop-Loss: ₹485
Targets:
₹527
₹543.35
₹555.60
₹570.05
₹584.35
Final Target: ₹597.50
Risk-to-Reward Ratio: 1:3
Analysis and Rationale
Kabra Extrusiontechnik has formed a classic flag breakout pattern on the daily chart, signifying a strong continuation of the ongoing uptrend.
Entry Level: ₹513 aligns with the breakout confirmation.
Stop-Loss: ₹485 protects against invalidation of the setup.
Targets: Derived based on measured moves and prior resistance levels.
Key Observation s
Trend Continuation: The flag breakout indicates bullish momentum.
Risk Management: Attractive risk-to-reward ratio of 1:3 enhances trade viability.
Scaling Out: Partial profit-booking at intermediate targets is advised.
Disclaimer
This analysis is for educational purposes only. Trading involves risk; consult a financial advisor before making investment decisions. Always trade within your risk tolerance.

Trading Opportunity: Salzer Electronics (On-Neck Breakout)Stock: NSE:SALZERELEC
Pattern: On-Neck Breakout (Weekly Chart)
Type: Medium-Term Trade Opportunity
Trade Details
Entry Point: Buy at ₹1411
Stop-Loss: ₹1257
Targets:
₹1486.45
₹1561.90
₹1649.90
Final Target: ₹1739
Risk-to-Reward Ratio: 1:2
Analysis and Rationale
The stock of Salzer Electronics has shown an on-neck breakout on the weekly chart, indicating a continuation of bullish momentum. This breakout is backed by strong price action, suggesting a favorable medium-term opportunity for traders.
Entry Level Justification: ₹1411 is a key level of confirmation where the breakout appears sustainable.
Stop-Loss Positioning: ₹1257 serves as a strategic stop to protect capital while allowing the trade room to develop.
Target Projections: The targets are calculated based on historical resistance levels and measured moves post-breakout.
Key Observations
Bullish Momentum : The on-neck breakout signifies buyer strength, hinting at further upside potential.
Volume Confirmation: Monitor trading volume, as increasing volume can further validate the breakout.
Medium-Term Horizon: The trade is structured for medium-term gains, ideal for positional traders.
Trade Plan
Risk Management: Maintain discipline by adhering to the stop-loss to ensure controlled risk.
Scaling Out: Consider partial profit-booking at intermediate targets to lock in gains.
Monitoring: Regularly track the stock’s performance to adjust levels if market conditions change.

Supriya Lifescience Ltd. (SUPRIYA): Flag Breakout OpportunityKey Points:
Pattern : Clear Bullish Flag breakout on daily chart.
Entry : Ideal buy point at ₹804 after breakout confirmation.
Stoploss : Set at ₹745 to protect against downside.
Targets:
833 INR
862 INR
891 INR
922 INR
948 INR
977 INR
Risk-Reward : Offers a potential reward up to 173 INR with a risk of 59 INR.
Considerations: Volume spike on breakout necessary for validation. Always review market conditions and company fundamentals.

KIRIINDUS (Kiri Industries Ltd.): Bullish Flag BreakoutSetup:
Pattern: Kiri Industries has formed a Bullish Flag on the daily chart, signaling a potential continuation of the prior uptrend.
Breakout: The stock has recently broken out of its consolidation phase, confirming the flag pattern.
Entry Strategy:
Buy at: 613 INR. Wait for a confirmation close above the flag's resistance for entry.
Risk Management:
Stoploss: Set at 554 INR, positioned below the flag's lower trendline.
Profit Targets:
1st Target: 644 INR
2nd Target: 670 INR
3rd Target: 702 INR
4th Target: 729 INR
5th Target: 760 INR
6th Target: 788 INR
Risk/Reward:
Risk : 59 INR (Entry - Stoploss)
Rewards: Ranging from 31 INR to 175 INR, offering a strong risk-reward profile.
Notes:
Volume Confirmation: Ensure the breakout volume is higher than average to validate the setup.
Market Context: Consider the sector and broader market trends for added confidence.
Fundamentals: For long-term holds, review company fundamentals.
This setup provides traders with a clear plan for entering, managing risk, and aiming for multiple profit levels. However, always adapt your strategy to real-time market conditions.

COCHIN SHIPYARD - MUTIBAGGER STOCKCan Enter at 1400
Target - 2450,2950
Disclaimer - All information on this page is for educational purposes only,
we are not SEBI Registered, Please consult a SEBI registered financial advisor for your financial matters before investing And taking any decision. We are not responsible for any profit/loss you made.
Request your support and engagement by liking and commenting & follow to provide encouragement
HAPPY TRADING 👍

Medium term opportunity in Oriental PG Electr for V. good upsideHi,
NSE:PGEL has given a Bullish Flag Breakout on Weekly charts with very good volume.
MACD is also on the bullish side on Weekly time frames. RSI is also on the bullish side on daily, weekly and monthly time frames.
In the current market scenario, I am expecting that the bullish momentum will continue.
Complete price projection like entry, stop loss and targets mentioned on the charts for educational purpose.
Don't Forget to Follow me to get all the updates.
Please share your feedback or any queries on the study.
Disclaimer: Please consult your financial advisor before making any investment decision.

HCG - 15% IN JUST 2 TRADING SESSIONDiwali Pick Success: HCG Delivers a 15% Return in Just 2 Trading Sessions!
I’m excited to share that HCG (HealthCare Global), my Diwali pick, has already achieved a remarkable 15% return in only 2 trading sessions! This swift gain underscores the strong momentum HCG has shown since being highlighted.
This stock was also recognized as a TradingView Editor’s Pick, validating its strength and potential. Congratulations to those who joined in on this festive pick – a true Diwali success!

Medium term trading opportunity in Aarvee Den for V. good UpsideHi,
NSE:AARVEEDEN has given a Bullish Flag Breakout on Weekly charts with very good volume.
MACD is also on the bullish side on Weekly time frames. RSI is also on the bullish side on daily, weekly and monthly time frames.
In the current market scenario, I am expecting that the bullish momentum will continue.
Complete price projection like entry, stop loss and targets mentioned on the charts for educational purpose.
Don't Forget to Follow me to get all the updates.
Please share your feedback or any queries on the study.
Disclaimer: Please consult your financial advisor before making any investment decision.
ALong

NEXT LUPIN ?PPLPHARMA Is India Consumer Healthcare Business Comprising Analgesics, Skin Care, Vitamin/mineral Supplement, Kids’ Wellness, Digestives, Women’s Health, And Hygiene And Protection.
PPLPHARMA Is At Support Level Of 214-216
Breakout A Trendline With Non Avrage Voloume
Buy @235
Target 1. 250
2. 300
3. 350
" Happy Diwali "
