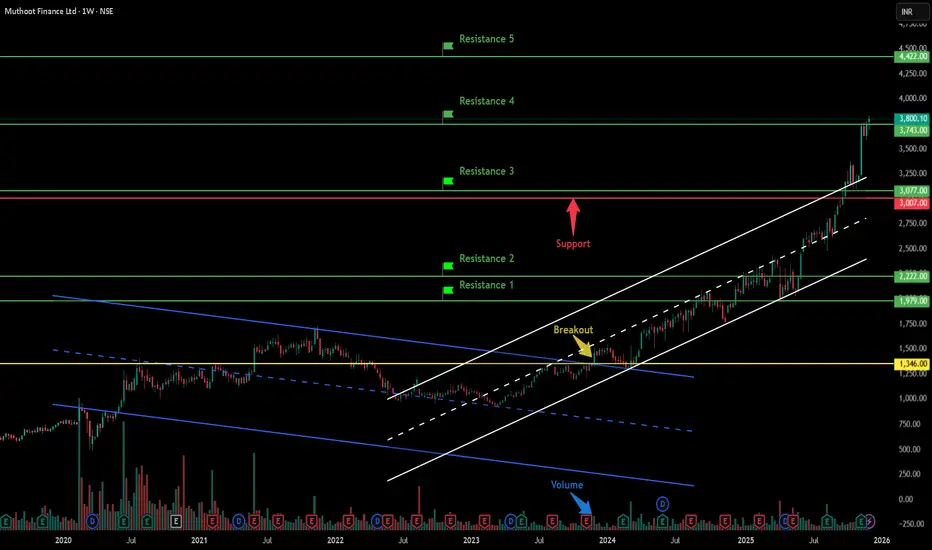
Muthoot Finance Limited - Breakout Setup, Move is ON...#MUTHOOTFIN trading above Resistance of 3743
Next Resistance is at 4422
Support is at 3007
Here are previous charts:
Chart is self explanatory. Levels of breakout, possible up-moves (where stock may find resistances) and support (close below which, setup will be invalidated) are clearly defined.
Disclaimer: This is for demonstration and educational purpose only. This is not buying or selling recommendations. I am not SEBI registered. Please consult your financial advisor before taking any trade.
MUTHOOTFIN
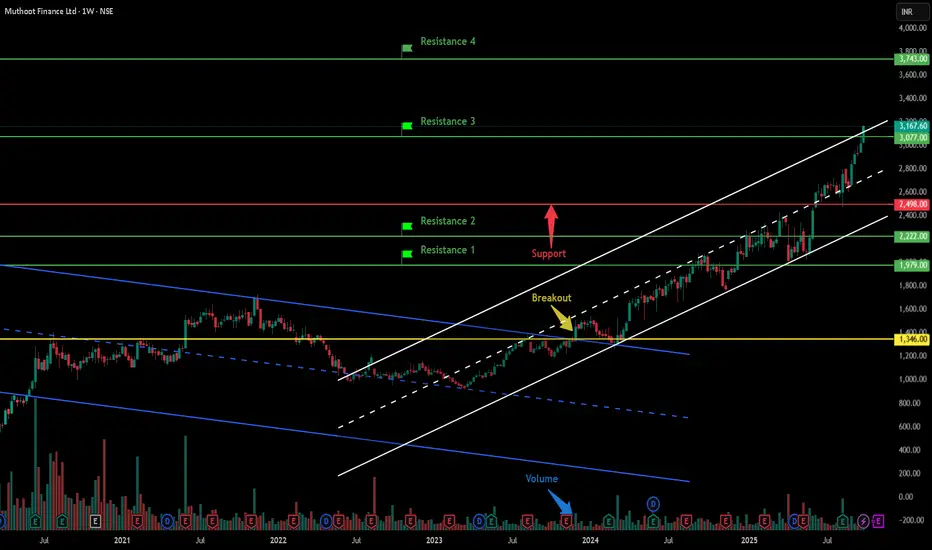
Muthoot Finance Limited - Breakout Setup, Move is ON...#MUTHOOTFIN trading above Resistance of 3077
Next Resistance is at 3743
Support is at 2498
Here are previous charts:
Chart is self explanatory. Levels of breakout, possible up-moves (where stock may find resistances) and support (close below which, setup will be invalidated) are clearly defined.
Disclaimer: This is for demonstration and educational purpose only. This is not buying or selling recommendations. I am not SEBI registered. Please consult your financial advisor before taking any trade.
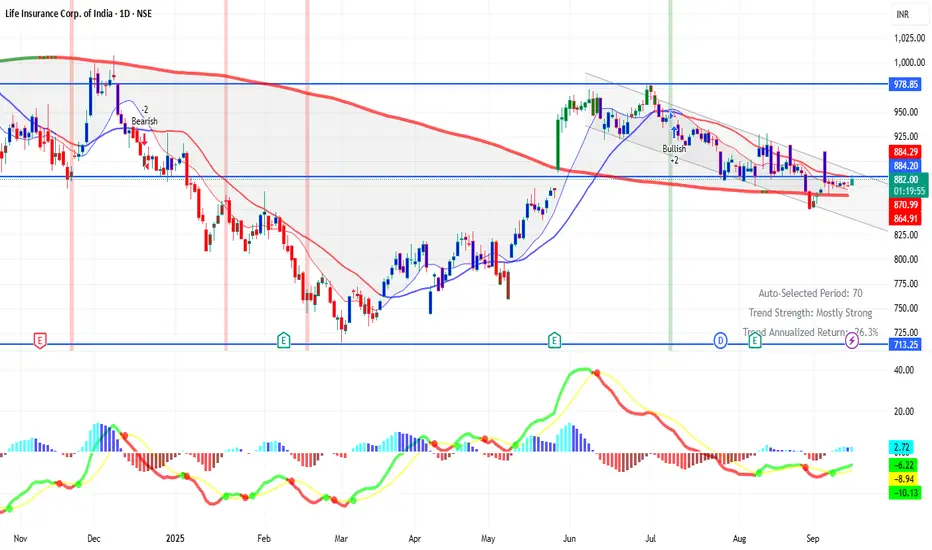
LICI 1D Time framePrice Action
Current Price: ₹882.50 (approx)
52-Week Range: ₹715.30 – ₹1,048.90
P/E Ratio: ~11.4
Book Value per Share: ~₹200+
🔹 Support & Resistance
Strong Support: ₹800 – ₹830
Immediate Resistance: ₹860 – ₹900
Next Resistance (medium-term): ₹1,000+
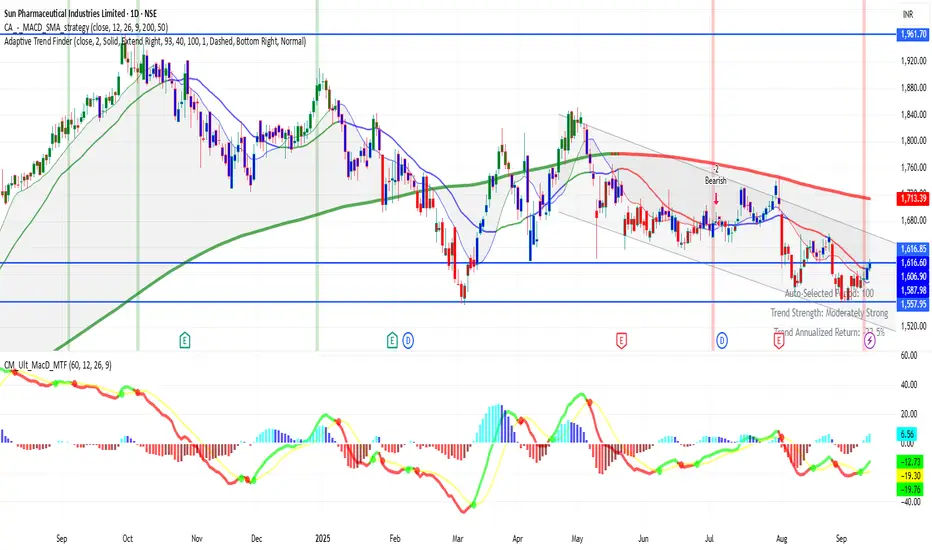
SUNPHARMA 1D Time frameCurrent Snapshot
Stock is around ₹1,616
52-week range: ~ ₹1,553 (low) up to ~ ₹1,960 (high)
Price is significantly below its 52-week peak, indicating past weakness or profit-taking from highs.
Bullish Scenario
If price can hold above the support (~₹1,590–₹1,600) and pushes above the immediate resistance (~₹1,620–₹1,630):
Could see a move toward ₹1,660–₹1,670.
If resistance is crossed with strength, next targets would be ~₹1,740-₹1,750 or more, depending on momentum.
SBIN 1D Time frameCurrent Price Action (Daily Chart)
Price Range: Stock is moving between ₹815 – ₹830 right now.
Trend: Consolidation with mild bullish bias.
Key Levels
Immediate Resistance: ₹830
Next Resistance: ₹840 – ₹850
Major Resistance: Around ₹875 (previous high)
Immediate Support: ₹815 – ₹820
Strong Support: ₹800 – ₹805
Critical Support: ₹785

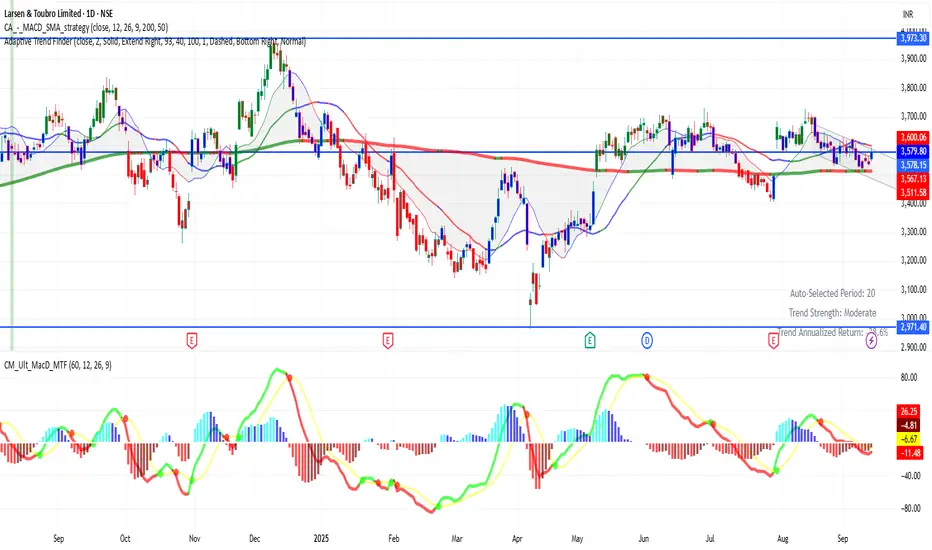
LT 1D Time frame LT — Daily (1D) Time Frame
Current Price: ₹3,579
Key Levels
Immediate Support: ₹3,540
Strong Support: ₹3,400
Immediate Resistance: ₹3,600
Major Resistance: ₹3,900
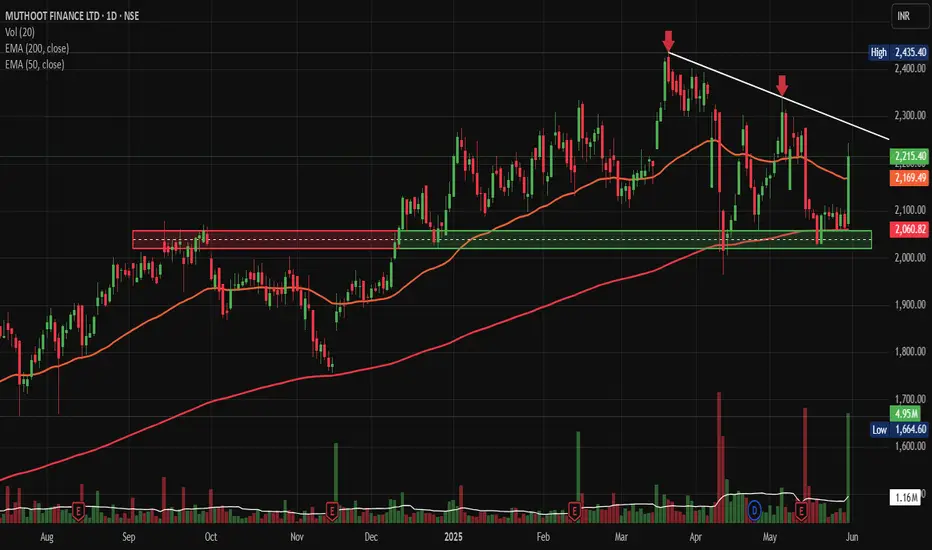
Muthoot Fin. bounce from Polarity LevelsNSE:MUTHOOTFIN made a good bounce from Polarity Levels with a huge candle again with high Volumes and closing above 50 DEMA, taking Support of 200 DEMA.
On the back news of the finance ministry seeking relaxation in the new rules on gold loans proposed by the central bank, they proposed that small ticket borrowers below 200,000 rupees should be excluded from the tighter rules to ensure speedy disbursements.
Price Action & Volume Analysis:
The stock has been consolidating in a well-defined range between ₹2,060-2,070 (support zone) and ₹2,400-2,435 (resistance zone) since April 2025. Today's strong move with above-average volume of 1.16M shares (compared to the 20-day average) suggests institutional participation and potential breakout momentum.
The price action shows a classic "coiling" pattern within the broader range, with decreasing volatility over the past few weeks, often a precursor to significant directional moves.
Key Technical Levels:
Support Zones:
- Immediate Support: ₹2,169-2,180 (50 EMA confluence)
- Strong Support: ₹2,060-2,070 (tested multiple times since April)
- Critical Support: ₹1,950-1,980 (October 2024 breakout level)
Resistance Zones:
- Immediate Resistance: ₹2,300-2,320
- Major Resistance: ₹2,400-2,435 (multiple rejections)
- Extension Target: ₹2,500-2,550
Base Formation & Pattern Recognition:
The stock has formed a robust Ascending Triangle pattern since the October 2024 lows. The horizontal resistance at ₹2,400-2,435, combined with rising support levels, creates a bullish continuation pattern. The triangle's apex is approaching, suggesting an imminent breakout.
Additionally, there's a clear Flag and Pole formation visible from the March-April rally, with the current consolidation representing the flag portion.
Moving Average Analysis:
- 50 EMA (Orange): Currently at ₹2,169, acting as dynamic support
- 200 EMA (Red): Located around ₹2,000, providing long-term trend support
- The stock is trading above both key EMAs, confirming the bullish trend structure
Trade Setup & Strategy:
Bullish Breakout Play:
Entry Strategy:
- Primary Entry: ₹2,320-2,330 (on volume breakout above resistance)
- Alternative Entry: ₹2,280-2,290 (pullback entry if direct breakout fails)
Target Levels:
- Target 1: ₹2,500 (measured move from triangle base)
- Target 2: ₹2,650 (extension target)
- Target 3: ₹2,800 (psychological resistance)
Risk Management:
- Stop Loss: ₹2,150 (below 50 EMA and swing low)
- Risk-Reward Ratio: 1:2.5 to 1:3.5
Position Sizing:
Risk should only be 1-2% of portfolio capital, given the stop loss distance.
Volume Confirmation:
Today's volume spike to 1.16M shares is encouraging, representing nearly 25% above the average. This volume expansion, coinciding with price advancement, suggests institutional accumulation. Watch for sustained volume above 1M shares for breakout confirmation.
Sectoral & Fundamental Backdrop:
NBFC Sector Dynamics:
The Non-Banking Financial Company (NBFC) sector has been gaining traction due to:
- Improving the credit growth environment
- RBI's supportive regulatory stance
- Rising rural credit demand
- Digital transformation initiatives
Muthoot Finance Fundamentals:
- Dominant player in gold financing with 5,000+ branches
- Strong asset quality with minimal NPAs
- Consistent dividend payout history
- Beneficiary of rising gold prices and rural credit demand
- Digital initiatives expanding customer base
Macro Tailwinds:
- Monsoon predictions favouring the rural economy
- Wedding season demand for gold loans
- Formalization of the gold loan market
- Potential interest rate stabilization
Risk Factors:
Technical Risks:
- Failure to sustain above ₹2,300 could lead to range continuation
- Broader market correction could impact individual stock performance
- Sector rotation away from financials
Fundamental Risks:
- Gold price volatility affecting loan demand
- Regulatory changes in the NBFC space
- Competition from banks in the gold loan segment
My Take:
NSE:MUTHOOTFIN presents an attractive risk-reward setup with its ascending triangle breakout potential. The combination of strong fundamentals, sector tailwinds, and technical setup creates a compelling investment thesis. However, strict adherence to stop losses and position sizing remains crucial given the inherent market volatility.
The stock appears poised for a significant move, with the technical pattern suggesting a higher probability of an upside breakout. Traders should wait for volume confirmation above ₹2,320 levels before initiating positions.
Keep in the Watchlist.
NO RECO. For Buy/Sell.
📌Thank you for exploring my idea! I hope you found it valuable.
🙏FOLLOW for more
👍BOOST if you found it useful.
✍️COMMENT below with your views.
Meanwhile, check out my other stock ideas on the right side until this trade is activated. I would love your feedback.
Disclaimer: "I am not SEBI REGISTERED RESEARCH ANALYST AND INVESTMENT ADVISER."
This analysis is intended solely for informational and educational purposes and should not be interpreted as financial advice. It is advisable to consult a qualified financial advisor or conduct thorough research before making investment decisions.
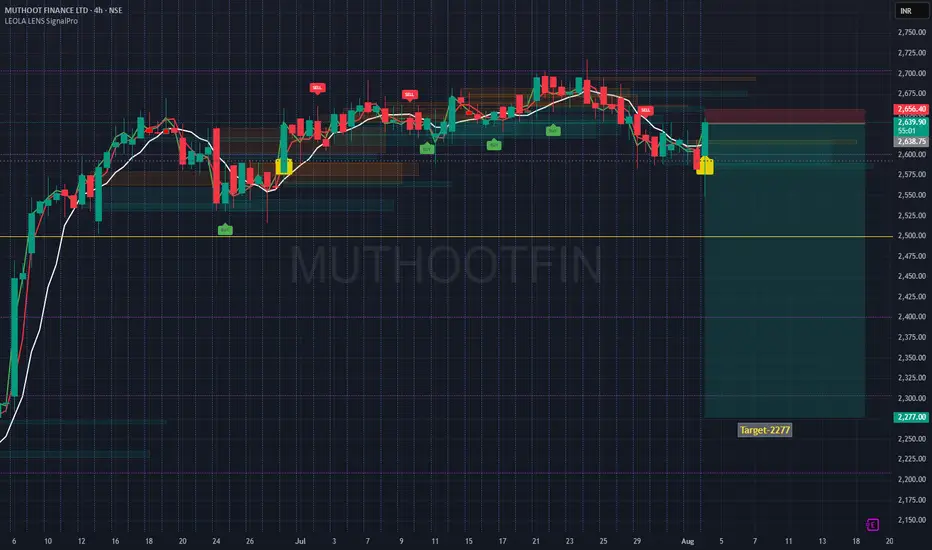
MUTHOOTFIN Structure Breakdown- 2277- Step Towards a Fall 🔍 Technical Structure Breakdown:
🟡 Caution label printed after extended distribution — often a signal for upcoming directional shift.
🔴 Price rejected strongly from the upper red supply zone near ₹2,656, confirming resistance from prior SELL cluster.
⚪ Structure broke below a multi-session accumulation zone, flipping the bias to bearish.
🟢 Current rebound is testing the underside of broken structure — often a key area for rejection or continuation.
📉 Target: ₹2,277, aligning with a major historical reaction zone and potential liquidity pocket.
This setup reflects a classic breakdown-retest structure where price may revisit lower order blocks if it fails to reclaim the broken support zone.
⚠️ Disclaimer:
This post is intended solely for educational purposes and does not constitute financial advice. Please do your own research and consult a licensed financial advisor before making any investment or trading decisions.

MOOTHOOT IS BULLISHmuthoot fin is at end of the accumulation zone and the price may go higher to the next level ema is also getting up so the price will go higher and enter with a lower time confirmation

Muthoot Finance - Risky 1:3 RR bet based on BO1. Volumes are low
2. Risk of BO failure
3. For now prices are sustaining above the BO level that's a good sign
4. Below Dz will be the best area to go long.
5. Trade with 10% SL
- Stay tuned for further insights, updates and trade safely!
- If you liked the analysis, don't forget to leave a comment and boost the post. Happy trading!
Disclaimer: This is NOT a buy/sell recommendation. This post is meant for learning purposes only. Please, do your due diligence before investing.
Thanks & Regards,
Anubrata Ray

Short Term Swing Trading Idea in Muthoot Fin for > 15% UpsideHi,
EXIDEIND
has given a Bullish Flag Breakout on Daily charts with very good volume.
MACD is also on the bullish side on Weekly and Monthly time frames. RSI is also on the bullish side on daily, weekly and monthly time frames.
In the current market scenario, I am expecting that the bullish momentum will continue.
Complete price projection like entry, stop loss and targets mentioned on the charts for educational purpose.
Don't Forget to Follow me to get all the updates.
Please share your feedback or any queries on the study.
Disclaimer: Please consult your financial advisor before making any investment decision.

MUTHOOT FINANCE C&H BREAKOUT WCBMuthoot finance breaking c&h pattern
weekly basis good volume and rsi
macd crossover
#target 1880 after breaking 1720 only
EDUCATIONAL IDEA

MUTHOOT FINANCE READY TO SWING UP WITH HUGE VOLUME BREAKOUT 📈💡MUTHOOT FINANCE READY TO SWING UP WITH HUGE VOLUME BREAKOUT 📈💡🔥
🟢 What a Reversal on weekly chart from Long term support! I would be damned if I wouldn't take a position it. So I will tomorrow.
🟢 That too with a steller Quarterly Results 🔥👇🏻
🎯 Revenue: Revenue increased 26.8% year-over-year to ₹3,842.68 Cr in the Q3 2023-2024
🎯 Net profit: Net profit increased 18.95% year-over-year to ₹1,103.52 Cr in the Q3 2023-2024
🎯 EPS: EPS is ₹29.46 for Q3 FY24, which is an increase of 16.19% year-over-year
🟢 Promoters Buying also Spotted 🔥🔥
I'll enter tomorrow for upto 35% upside rally with these levels 📈👇🏻
Entry - 1328
Target 1 - 1375
Target 2 - 1424
Target 3 - 1535
Target 4 - 1640
Stoploss - 1260 on Weekly Closing Basis

MuthootFin Priceaction BullishMuthoot On a Higher Timeframe making significant
Higher High and Higher Low
Stock rejected from Previous High and came down for retracement.
Stock Retested the Previous Breakout level and currently forming a
Strong #PriceAction.
So the Stock shd move from Higher Low to Previous Swing High then New ATH.

Long Setup In MuthootA Inverted Head & Shoulder Chart Pattern Breakout happened on the Daily Time frame of NSE:MUTHOOTCAP
Price Action supported by volume.
The stock is currently in uptrend making higher highs and higher lows.
One can add this stock into their stocks to buy list.
One can initiate the long trade as per the lavel mentioned on the chart
Stop loss will be on a Daily closing basis.
Trend Analysis :- UP Trend
Chart Pattern :- Bullish Inverted Head & Shoulder Chart Pattern
Technical Indicator :- Positive MACD Crossover
Disclaimer: This is for Educational Purpose only.

Fundamentally Strong Stock Breakout🌟 **Stock Alert: MUTHOOT Finance (CMP: ₹1415)** 🌟
📊 **Fundamentally Strong Pick!**
🎯 **Targets: ₹1500 and ₹1700 (Minimum)**
📉📈 **Technical Analysis: Cup and Handle Breakout!**
🚀 **Reasons to Consider:**
1. **Fundamental Strength:** MUTHOOT Finance boasts robust fundamentals, making it a resilient choice in the market.
2. **Cup and Handle Pattern:** Technical analysis indicates a potential breakout, suggesting a bullish trend ahead.
3. **Current Entry Point:** At the CMP of ₹1415, it presents an appealing entry opportunity.
🛑 **Stop Loss (SL):** ₹1280
💼 **Investment Strategy:**
- **Entry Point:** Enter at CMP (₹1415).
- **Stop Loss:** Set a protective Stop Loss at ₹1280 for risk management.
- **Hold Period:** Aim for minimum targets of ₹1500 and ₹1700 for potential gains.
📉📈 **Disclaimer:** Remember, all investments carry inherent risks. Stay informed, and consider seeking advice from financial experts before making investment decisions.
👀 **Monitor market developments and news for timely adjustments. Best of luck with your investment!** 📊🚀

Investment_ Muthoot FinanceNamaste!
Muthoot Finance is one of my favourite stocks in the finance sector. The formulae I use to calculate intrinsic value suggests this stock, whereas it somewhat fails in the valuation of Bajaj Finance, SBI Cards, etc.
It is trading at a PE (Price to earnings ratio) of 11.62, whereas Bajaj Finance is 51.29 and SBI Cards is 45.53.
In most cases, the lower PE is better. The intrinsic value stands around Rs 3000, assuming growth to be 17.2% YoY and 6.1% Indian treasury yields.
The reasons to buy this stock:-
1. Low PE and intrinsic value.
2. 1.75% Dividend Yields.
3. >20% correction in stock price.
Q: What price should I buy?
A: The current price of Rs 1144 is a good price.
Please do not invest more than 10% of your capital. I suggest many stocks, but it is your responsibility to choose your favourite ones.
Disclaimer: The analysis I have shared is based on my understanding and experience in the markets. Investment does not guarantee a fixed return due to volatile nature of markets and may result in a loss. Please do your analysis and/or consult your financial advisor before investing.

Muthoot -21.11.2023If trigger line crosses above -52.57, may reach 61.09, Cash price - 20-30
If trigger line crosses below -48.04, may reach 39.38, Cash price - 16-22

Muthoot -Intraday -15.11.2023If trigger line crosses over 53.38, may reach 66.07, cash Price may reach 30-45 with a gap up.
If trigger line crosses over 42.61, may reach 32.58, Option Price may reach 20-22.

intra buy intra buy around 1294 with stop 1281
targtet 1301+
trade purely based on trendline intersection
disclaimer - trade @ own risk

MUTHOOTFIN char analysisplease refer to chart
daily time frame
value and volume breakout seen
small swing possible

MUTHOOTFIN - Bullish Consolidation with VolumesNSE: MUTHOOTFIN is closing with a bullish consolidation candle supported with volumes.
Today's volumes and candlestick formation indicates strong demand and stock should move to previous swing highs in the coming days.
The stock has been moving along the horizontal support for the past few days which is indicating demand.
One can look for a 8% to 13% gain on deployed capital in this swing trade.
The view is to be discarded in the event of the stock breaking previous swing low.
#NSEindia #Trading #StockMarketindia #Tradingview #SwingTrade
