US Tech 100 (NASDAQ) 📊 US Tech 100 (NASDAQ) – 4H Market Structure Analysis 🚀
🔎 Market Overview
The 4H chart of US Tech 100 Cash (NASDAQ) shows a clear range-bound accumulation phase after a prior corrective decline.
Price is currently trading inside a well-defined structure:
🔝 Range High: ~25,500
🔻 Range Low: ~24,150
🎯 Upside HTF Target: 26,234
The market is compressing below resistance, preparing for expansion.
🏗 1️⃣ Structural Breakdown
📦 Range Structure (Accumulation Phase)
Price has been oscillating between:
Support: 24,143
Resistance: ~25,500
We see:
Multiple higher lows forming inside the range
Strong rejection from range lows
Gradual upside pressure building
This suggests internal strength rather than distribution.
📈 2️⃣ Order Flow & Momentum
Recent price action shows:
Higher lows forming ✔️
Bullish impulses stronger than bearish retracements ✔️
Repeated attempts to break the upper boundary ✔️
Momentum is shifting bullish inside the structure.
The market is compressing under resistance — compression often leads to expansion.
🎯 3️⃣ Primary Scenario (Higher Probability)
🟢 Bullish Breakout Setup
If price:
Holds above 24,869 (mid-range support)
Breaks and closes above 25,500
Confirms with momentum
Then the upside target becomes:
🎯 26,234 (Higher timeframe liquidity level)
This aligns with the projected move shown on the chart.
🔴 Alternative Scenario (Invalidation)
Bearish case activates if:
Clean break below 24,143
Acceptance below range support
Downside targets:
23,800
23,400
However, current structure favors upside continuation.
📊 4️⃣ Professional Bias Assessment
Factor Status
Market Phase Consolidation
Internal Structure Bullish Compression
Higher Timeframe Bias Upward
Best Trade Location Pullbacks above mid-range
Invalidation Break below 24,143
🧠 Strategic Conclusion
The market appears to be in a re-accumulation phase rather than distribution.
✔️ Higher lows indicate strength
✔️ Liquidity resting above range highs
✔️ Compression near resistance
Probability currently favors a break to the upside toward 26,234.
📌 Key Focus: Watch for breakout confirmation above 25,500.
Nasdaq

#NASDAQ FINAL DOWNWARD MOVE📊 Nasdaq Elliott Wave Update
The Nasdaq began its daily correction on 29 Oct 2025 📉, forming its A wave on 21 Nov 2025 with a low at 23,854.
- 🔎 The A wave unfolded in 3 subwaves, signaling a flat correction.
- 📈 As expected, the B wave retraced >61.8%, rising to 26,165.
Now, the index is progressing through its C wave:
- 🌀 C waves typically fall in a 5-wave structure.
- ✅ 4 waves are complete, and the 5th wave is unfolding.
- 🎯 This final leg could potentially drive the Nasdaq down toward 24,000.

EURUSD - 4H - SHORTFOREXCOM:EURUSD
Hello traders , here is the full multi time frame analysis for this pair, let me know in the comment section below if you have any questions, the entry will be taken only if all rules of the strategies will be satisfied. wait for more Smart Money to develop before taking any position . I suggest you keep this pair on your watchlist and see if the rules of your strategy are satisfied...
Keep trading
Hustle hard
Markets can be Unpredictable, research before trading.
Disclaimer: This trade idea is based on Smart money concept and is for informational purposes only. Trading involves risks; seek professional advice before making any financial decisions. Informational only!!!

US100 (Nasdaq) – Intraday Short Setup | Smart Money Concept 🔍 Market Context
Price is currently trading near a strong premium supply zone with multiple confluences:
Previous Liquidity Sweep
Bearish BOS + CHoCH
Descending Trendline Resistance
Premium pricing zone (OTE area)
This indicates institutional selling pressure and a high-probability short opportunity.
🧠 Technical Confluence
Liquidity grab above highs
Break of Structure (BOS) → Bearish
CHoCH confirming trend shift
Premium Supply Zone respected
Trendline acting as dynamic resistance
Entry from Discount → Premium retracement
🎯 Trade Plan
Bias: Short
Entry Zone: 25,300
Stop Loss: 25,458
Targets:
TP → 24,950
Risk : Reward: ~1 : 2+
📌 Execution Logic
Wait for:
Bearish confirmation candle
Rejection from supply + trendline
Lower timeframe CHoCH for sniper entry
No FOMO trades. Patience = Profit.
Disclaimer: Educational purpose only.

NAS100 – Range extension Play from discount area.🔍 Market Context
Nasdaq is currently reacting from a discount area with confluence from the 24700 support zone and the lower trendline support. Price has shown signs of holding this level, indicating a potential bullish pullback toward premium levels.
📘 Trade Idea (Long Bias)
Entry: 24700
Stop-Loss: 24550 (below structural support + trendline)
Take-Profit Targets:
TP1: 25000
TP2: 25175
This setup anticipates a reaction from the discount zone back toward equilibrium and previous supply levels.
📌 Notes
Confluence of discount pricing, trendline support, and horizontal support increases probability.
Structure remains bearish overall, so this is a counter-trend pullback long—manage risk accordingly.
⚠️ Disclaimer
For educational purposes only. Not financial advice. Follow for more ideas.

Nasdaq Ichimoku 1H: Kijun Rejection — Control Firmly with BearsNasdaq Ichimoku 1H: Kijun Rejection — Control Firmly with Bears
The Daily TF has just undergone a Kumo breakdown , confirming a fresh bearish shift in higher-timeframe structure . That HTF signal provides clear downside context and support for continuation setups on lower timeframes.
Within this backdrop, the 1H chart printed a clean Kijun reclaim failure . Price attempted to reclaim balance but failed to sustain or close above the Kijun, reinforcing that upside attempts remain corrective and are being sold into .
As long as price fails to decisively close above 25,169 on a 1H closing basis , bearish structure remains intact. Below, the following reference levels act as natural reaction zones within the ongoing downtrend:
L1: 24,856
L2: 24,752
L3: 24,652
Until balance is reclaimed and held, the message from structure is clear: Control remains firmly with the bears.

NASDAQ bullish bias on HTF and ITFThe price is currently reacting to THE DAILY FAIR VALUE GAP , which is a good confluence for bullish and long clarity, as the dollar continues to freefall , we can consider the relative strength between the index and the currency to support our long idea.
The closest target would be the recents 4 hour highs.
Wait until 9:30 openin for any manipulation to frame our trade.
Invalidation :- closing below the (dfvg)

US100 LONG SETUP — “Major Liquidity Sweep Into Demand US100 has aggressively dropped into a major higher-timeframe demand zone, sweeping liquidity below previous lows and tapping into a strong bullish reaction block. This move also aligns perfectly with the rising trendline support from recent structure.
The sharp sell-off looks like a liquidity grab / stop-hunt, making this a high-probability long setup.
Description:
Price broke down impulsively and cleared all buy-side liquidity sitting below 25,350–25,300 levels. After the sweep, US100 has entered a clean demand zone highlighted in red, which was a strong origin of previous bullish expansion.
This is a classic smart-money setup:
✔ Liquidity sweep
✔ Entry in demand
✔ Trendline confluence
✔ Price in deep discount
A bullish reversal from here is highly likely if buyers defend this zone.
Trade Plan (Suggestive)
Entry Zone: 25,230 (inside the demand zone)
Stop Loss: Below demand zone at 25,080
TP1: 25,550
Risk–Reward: ~1:2

US100 – Rejection From Discoun Zone + Trendline TapBias: Bullish Reversal (Counter-Trend Move Toward Premium)
Strategy Basis: SMT / Premium–Discount / Liquidity Sweep
📖 Trade Idea Description
US100 has tapped into a higher-timeframe ascending trendline support after delivering a sharp sell-off. Price swept the recent sell-side liquidity, reacted from the discount zone, and instantly showed strong bullish displacement.
This rejection aligns perfectly with:
✔ Retest of previous demand zone
✔ Liquidity grab below equilibrium
✔ Rejection wick forming bullish orderflow
✔ Discount pricing inside the PD Array
✔ Premium to discount rebalancing setup
Price has now reclaimed structure and is respecting the trendline, indicating possible continuation higher toward the premium zone.
🟢 Long Setup
Entry: 25,152 (after trendline rejection)
Stop Loss: Below discount zone – 24986
Take Profit: 25,500 (mid-range liquidity
🎯 Trade Narrative
Market has entered a deep discount after taking out major liquidity. The violent wick gives a clue that smart money stepped in. As long as price sustains above the demand + trendline, we anticipate a bullish push toward the imbalance and premium area.
This setup remains valid as long as price holds above the trendline and discount block.
For Educational purpose only.

LXEO FLAG & POLELXEO made a FLAG & POLE formation and breakout. We can expect flag target to $12.8 and pole target to $15.5. Entry price above $10.35 with a stoploss of $8.9
We can expext strong resistance at $11.5
Please make your own analysis before taking any trade.

FLUENCE ENERGYFLUENCE ENERGY MADE DOUBLE BOTTOM with DIVERGENCE in monthly chart and also in process of forming CUP & HANDLE FORMATION, and it is at resistence level at $24, if it breaksout resistance at $24 we can expect to reach $30 & $44.
Chart analysis done on best of my knowledge, it may reach or may not reach targets :-)

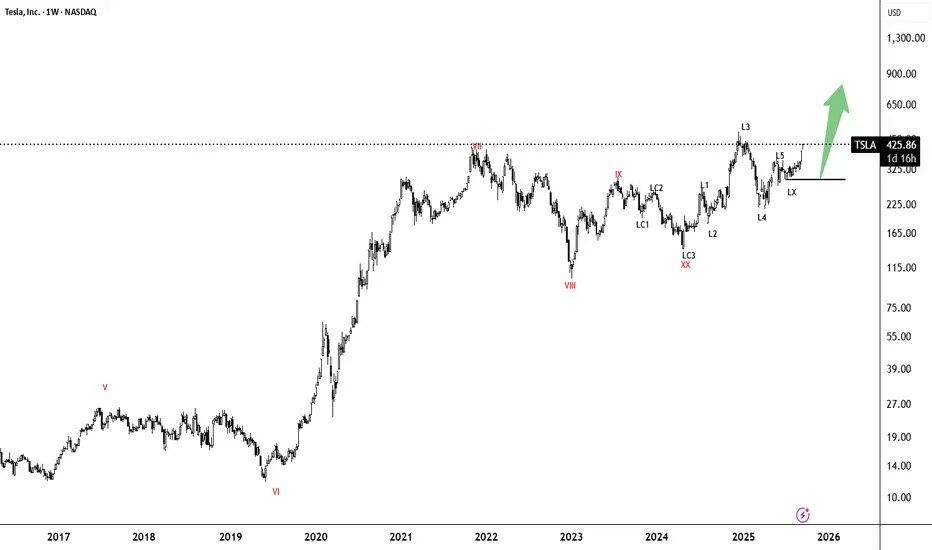
TESLA Bullish Wave CyclesHi everyone
Welcome to intelligent investor, we provide market insights by synchronising and combining all the price action waves from different time frames and gives you single trend.
If you see different keyword in charts, here is the meaning and an explaining video will be made in some time how to read and trade with these waves charts. Still if you have any query , you can leave a comment, i will be happy to answer your query.
Keyword Mean-
S- Short Term Trend
M- Medium Term Trend
L- Long Term Trend
I- Super Trend
(I)- Multiyear Trend
1,2,3,4,5 are wave bullish or bearish wave count
SC,MC,LC,AA,(AA)- mean consolidation or correction
X/XX- Like a joint in a trend or consolidation.
GBPUSD - 15M (IDEA)FOREXCOM:GBPUSD
Hello traders , here is the full multi time frame analysis for this pair, let me know in the comment section below if you have any questions, the entry will be taken only if all rules of the strategies will be satisfied. wait for more Smart Money to develop before taking any position . I suggest you keep this pair on your watchlist and see if the rules of your strategy are satisfied...
Keep trading
Hustle hard
Markets can be Unpredictable, research before trading.
Disclaimer: This trade idea is based on Smart money concept and is for informational purposes only. Trading involves risks; seek professional advice before making any financial decisions. Informational only!!!

NASDAQ 100 : This is going to hurt Chart is self explanatory. Refer to marked S/R Zones
- Divergent RSI
- NNH (Net new highs) dropping fast
- Anticipatory shorts are riskier but can give a great entry.
Stop Loss - 25200 DCB

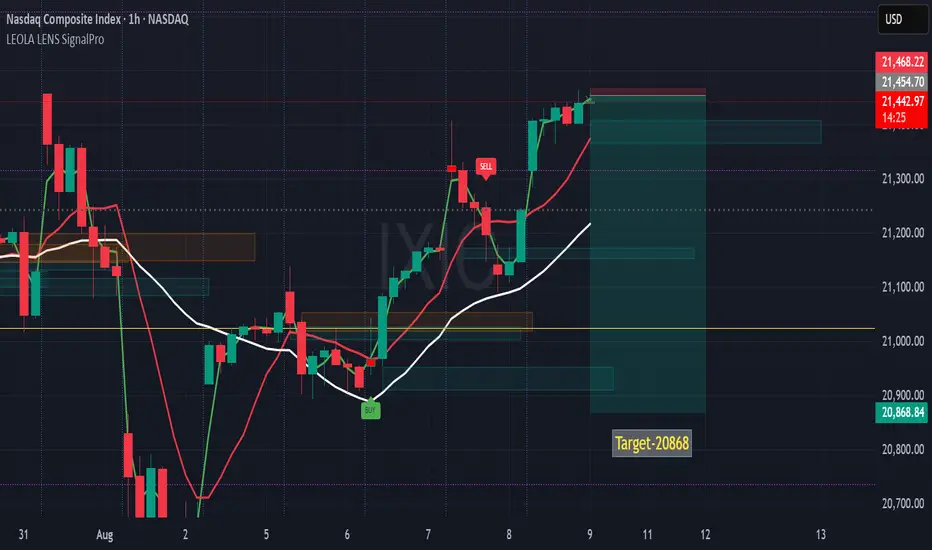
NASDAQ Composite (IXIC)- 1hr Reversal Setup Targeting 20,868This 1-hour chart shows a potential short-term reversal on the NASDAQ Composite, identified using Leola Lens SignalPro.
🔍 Technical Notes:
🟢 Price recently tested the upper red supply zone near 21,454, where prior SELL pressure emerged.
⚪ The white trendline (mid-term bias) is still below price, suggesting a test of resilience before reversal.
🔴 Multiple rejections near the supply zone may hint at exhaustion of buying momentum.
📉 Target: 20,868 — aligning with a prior structural pivot and liquidity zone.
🟡 Watch for confirmation via lower timeframe breakdowns before any continuation lower.
The setup reflects a possible supply-zone reaction after an extended rally, with a measured move toward a lower support zone.
⚠️ Disclaimer:
This analysis is for educational purposes only and should not be taken as financial advice. Always do your own research and consult a licensed financial advisor before making any trading decisions.
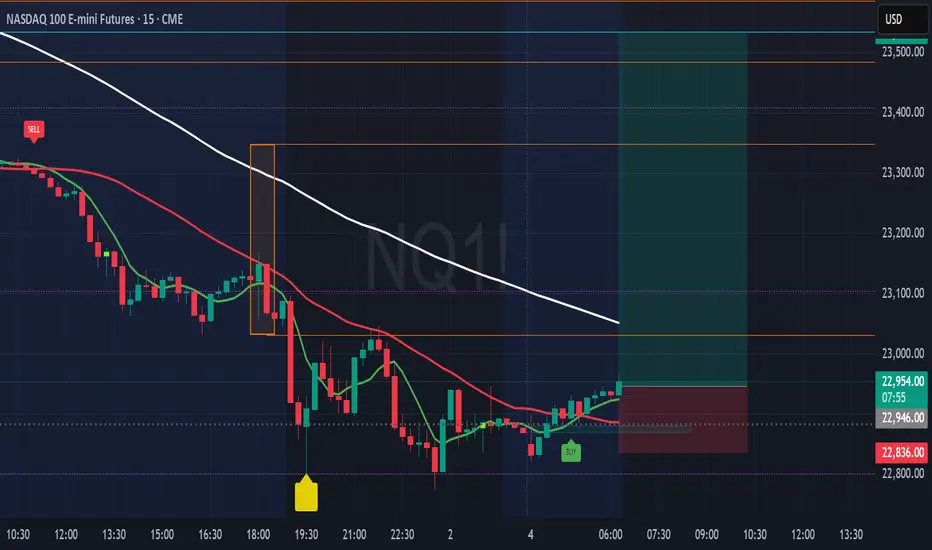
NQ100 - Eyes Long Towards 23531📌 NQ100 Futures 15-min — Buy Signal After Momentum Exhaustion & Trap Zone
Technical Structure Insights (15m):
🟡 A caution label printed near the evening session, highlighting a potential trap zone after short-term buyers were absorbed near the white moving average (trend resistance).
🔻 Price broke lower, completing a strong impulse leg to the downside.
🟢 BUY Signal has since appeared after price based out near 22,830 — coinciding with the purple reaction line.
📈 Current price is climbing back toward dynamic resistance levels (red and white moving averages).
🔍 Price must reclaim and sustain above 23,000 for upward continuation to remain structurally valid.
Otherwise, this may evolve into a lower high setup within the broader trend context.
Disclaimer: This chart is for educational purposes only and does not constitute financial advice. Always perform your own analysis and manage your trading risk responsibly
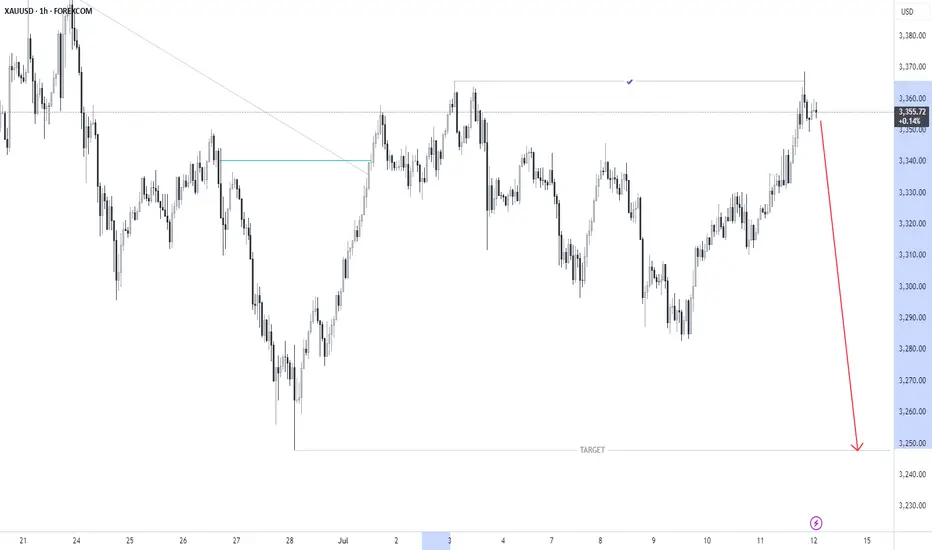
XAUUSD - 1H SHORT (GOLD)FOREXCOM:XAUUSD
Hello traders , here is the full multi time frame analysis for this pair, let me know in the comment section below if you have any questions, the entry will be taken only if all rules of the strategies will be satisfied. wait for more Smart Money to develop before taking any position . I suggest you keep this pair on your watchlist and see if the rules of your strategy are satisfied...
Keep trading
Hustle hard
Markets can be Unpredictable, research before trading.
Disclaimer: This trade idea is based on Smart money concept and is for informational purposes only. Trading involves risks; seek professional advice before making any financial decisions. Informational only!!!
Bollinger Bands: How to Stop Being a Slave to the Markets.Bollinger Bands: How to Stop Being a Slave to the Markets.
Bollinger Bands are a technical analysis indicator widely used in trading to assess the volatility of a financial asset and anticipate price movements. Created in the 1980s by John Bollinger, they consist of three lines superimposed on the price chart:
The middle band: a simple moving average, generally calculated over 20 periods.
The upper band: the moving average to which two standard deviations are added.
The lower band: the moving average to which two standard deviations are subtracted.
These bands form a dynamic channel around the price, which widens during periods of high volatility and narrows when the market is calm. When a price touches or exceeds a band, it can signal an overbought or oversold situation, or a potential trend reversal or continuation, depending on the market context.
What are Bollinger Bands used for? Measuring volatility: The wider the bands spread, the higher the volatility.
Identifying dynamic support and resistance zones.
Detecting market excesses: A price touching the upper or lower band may indicate a temporary excess.
Anticipating reversals or consolidations: A tightening of the bands often heralds an upcoming burst of volatility.
Why is the 2-hour time frame so widely used and relevant?
The 2-hour (H2) time frame is particularly popular with many traders for several reasons:
Perfect balance between noise and relevance: The H2 offers a compromise between very short time frames (often too noisy, generating many false signals) and long time frames (slower to react). This allows you to capture significant movements without being overwhelmed by minor fluctuations.
Suitable for swing trading and intraday trading: This timeframe allows you to hold a position for several hours or days, while maintaining good responsiveness to take advantage of intermediate trends.
Clearer reading of chart patterns: Technical patterns (triangles, double tops, Wolfe waves, etc.) are often clearer and more reliable on H2 than on shorter timeframes, which facilitates decision-making.
Less stress, better time management: On H2, there is no need to constantly monitor screens. Monitoring every two hours is sufficient, which is ideal for active traders who don't want to be slaves to the market.
Statistical relevance: Numerous backtests show that technical signals (such as those from Bollinger Bands) are more robust and less prone to false signals on this intermediate timeframe.
In summary, the 2-hour timeframe is often considered "amazing" because it combines the precision of intraday trading with the reliability of swing trading, providing superior signals for most technical strategies, especially those using Bollinger Bands.
To summarize
Bollinger Bands measure volatility and help identify overbought/oversold areas or potential reversals.
The 2-hour timeframe is highly valued because it filters out market noise while remaining sufficiently responsive, making it particularly useful for technical analysis and trading decision-making.
EURUSD SHORT - 15M/1HFOREXCOM:EURUSD
Hello traders , here is the full multi time frame analysis for this pair, let me know in the comment section below if you have any questions, the entry will be taken only if all rules of the strategies will be satisfied. wait for more Smart Money to develop before taking any position . I suggest you keep this pair on your watchlist and see if the rules of your strategy are satisfied...
Keep trading
Hustle hard
Markets can be Unpredictable, research before trading.
Disclaimer: This trade idea is based on Smart money concept and is for informational purposes only. Trading involves risks; seek professional advice before making any financial decisions. Informational only!! !

GBPUSD - 15M OUTLOOKFOREXCOM:GBPUSD
Hello traders , here is the full multi time frame analysis for this pair, let me know in the comment section below if you have any questions, the entry will be taken only if all rules of the strategies will be satisfied. wait for more Smart Money to develop before taking any position . I suggest you keep this pair on your watchlist and see if the rules of your strategy are satisfied...
Keep trading
Hustle hard
Markets can be Unpredictable, research before trading.
Disclaimer: This trade idea is based on Smart money concept and is for informational purposes only. Trading involves risks; seek professional advice before making any financial decisions. Informational only!!!

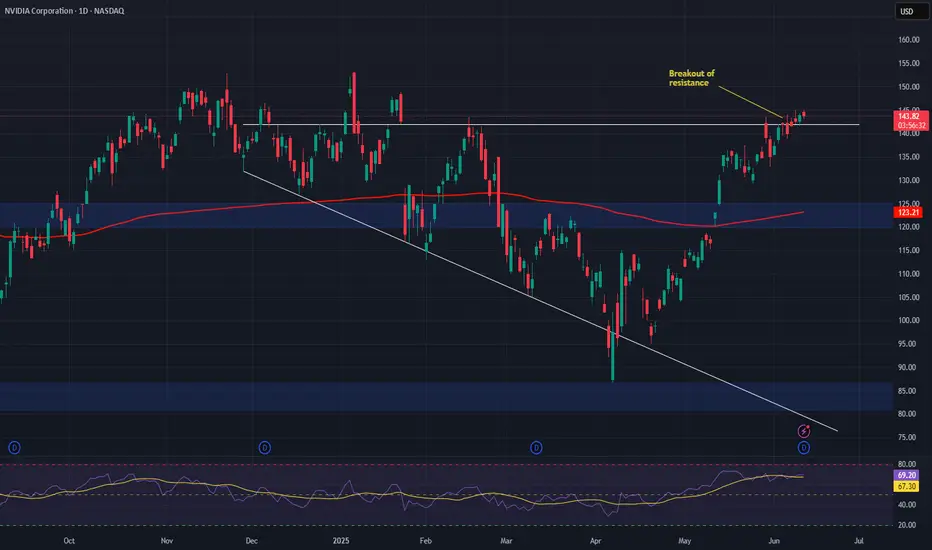
Nvidia (NVDA) – Building the AI Wave, Not Just Riding ItCompany Overview:
Nvidia NASDAQ:NVDA remains the undisputed leader in AI, high-performance computing, and now increasingly software infrastructure. With growing exposure to agentic AI, healthcare AI, and autonomous systems, Nvidia is redefining its growth story beyond semiconductors.
Key Catalysts:
🧠 Software Ecosystem Expansion
AI Blueprints, Llama Nemotron, and NIM microservices fuel adoption of agentic AI
High-margin, recurring revenue from software complements GPU hardware growth
Moves Nvidia closer to a platform-as-a-service model
🏥 Healthcare AI Momentum
Siemens Healthineers adoption of MONAI Deploy accelerates Nvidia’s footprint in diagnostics & imaging
Opens the door to pharma, life sciences, and clinical AI markets—a multi-billion-dollar TAM
🔧 Physical & Agentic AI Enablement
Positioned at the frontier of robotics, autonomous machines, and next-gen interfaces
Nvidia's tech stack is becoming foundational to the next wave of machine intelligence
Investment Outlook:
✅ Bullish Above: $120.00–$125.00
🎯 Target Price: $220.00–$230.00
📈 Thesis Drivers: AI platform leadership, expanding software revenue mix, and key vertical growth in healthcare & robotics
🧩 Nvidia isn’t just enabling AI—it’s defining its future. NASDAQ:NVDA #AIStocks #AgenticAI #Semiconductors
Belong AnywhereABNB - CMP - 140.64
This is just to boost my confidence. No Suggestions for buying. I will keep checking and updating my mistake if last post gone wrong...
Disclosure: I am not SEBI registered. The information provided here is for educational purposes only. I will not be responsible for any of your profit/loss with these suggestions. Consult your financial Adviser before making any decisions.

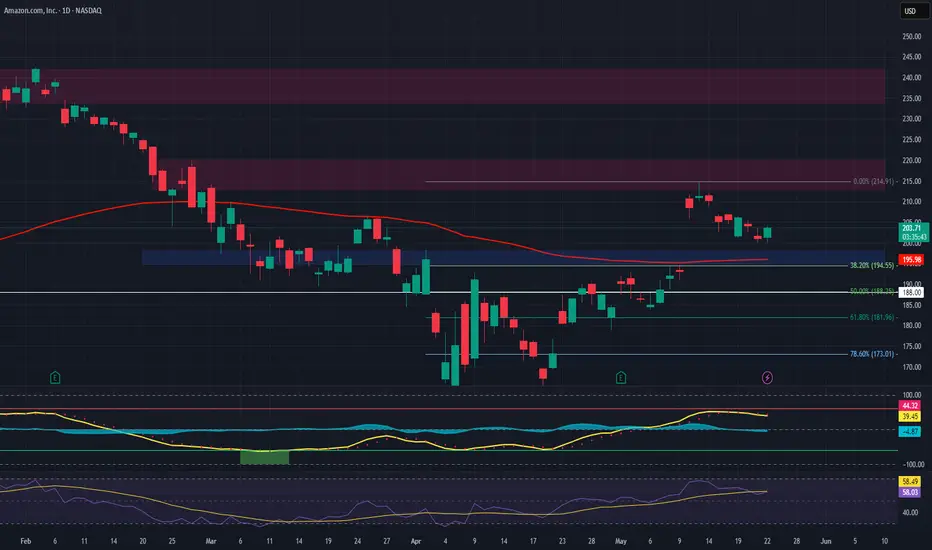
AMZN – Long Spot Trade Setup at Key SupportAmazon NASDAQ:AMZN is currently retracing into a major support level near $195, offering a solid long opportunity as broader market momentum holds up. This level has previously acted as a strong base, and price could now be positioning for a bullish continuation.
🔹 Entry Zone:
Around $195 (major support area)
🎯 Take Profit Targets:
🥇 $213 – $220 (previous resistance, aligns with local Fibonacci extension levels)
🥈 $234 – $242 (macro target zone if the broader market continues to rally)
🛑 Stop Loss:
Just below $188 (clear invalidation if key support breaks)