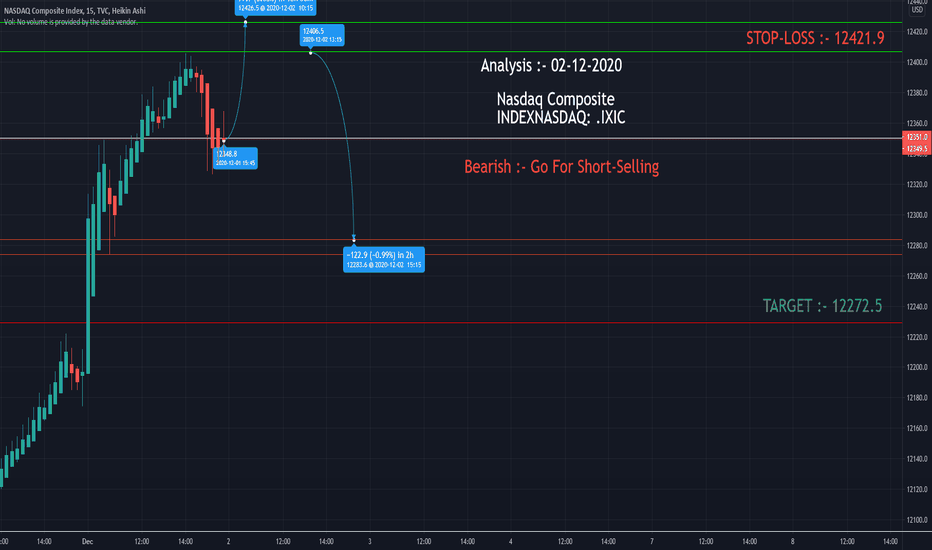
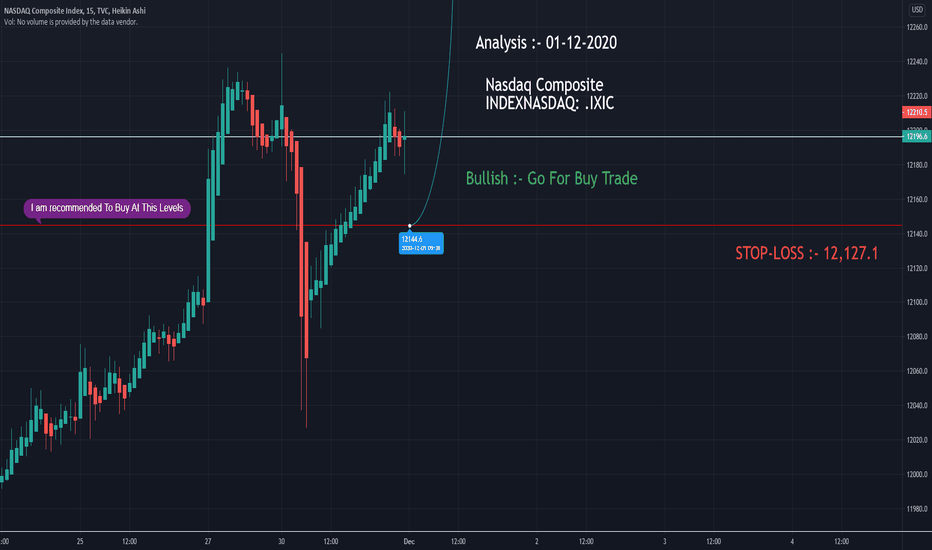
Nasdaq
Cup & Handle Formation in Dow Jones HourlyThe US index Dow Jones has formed a Cup & Handle pattern on hourly charts.
Breakout is awaited.
A valid upside breakout will lead to further upside but previous swing high may act as a supply zone.
Best time to buy KAVA's Hard token. KAVA's Hard token's mainnet would be integrated on binance, it's ready to take off and moon. Fill your bags right away !
Bitcoin / US Dollar : trading near its swing highBitcoin's previous swing high was at 13880. For fresh buying it is only recommended when it breaches this level and retests.
Momentum is very strong but if BO comes it might not sustain much as it requires some consolidation to breach such resistance.
Note : This idea is for only educational purpose. Dont make any position based on this analysis.
ALL TARGET ACHIEVED ON IEX , CHECK IDEAS 2 DAYS BACK SHARED CHECK THE ANALYSES SHARED ON TRADING VIEW AND SEE HOW THE ANALYSES WERE DONE WHICH GAVE HANDSOME RETURN
CLICK THE LINK TO SEE THE IDEA I DISCUSSED FEW DAYS BACK ON TRADING VIEW
.
IEX GAVE RETURN AS DISSCUSED BACK AND IT CAN ALSO BE HELD FOR MEDIUM TO LONG TERM
1. STRONG STOCK
2.STRONG FUNDA
THE BIG FIVE...CORRELATIONOCT. 7 and OCT. 19. (in purple)
NASDAQ : USDYEN : EURUSD : DXY : SILVER
These BIG FIVE have consistent direct and inverse relationships with each other
(for example: the USDYEN predicts the movement of the US-indices)
AND on these two(2) dates their EW-WAVES area ALL lining up.
According to my count which has been unfolding since last Friday
Nasdaq fall & the road aheadOn Sep 4, 2020, the first day after massive fall, Nasdaq touched the lows of 11,146 (5.3% low from the previous day closing), the low price however faced rejection and market closed at 11,622.10, down by 1.27%. The close was at the support line connecting the pre-COVID fall highs on Feb 19 with the lows of Aug 21 (Shown as B line in charts). Traders and analysts were eagerly waiting to see the next move after a long weekend due to the Labour Day holiday. This was because even after heavy fall on Sep 3, upward channel formed since March 23 was still seen intact and there was lower price rejection observed immediately after the day of fall, making revival hopes alive.
On Sep 8, Nasdaq broke the above support line at opening itself, it also broke the next most crucial support line of upward channel formed since March 23. (shown as A - green line). This closing can be seen even more negative as there was clear price rejection at upper level, leaving the only solace that it closed just above DMA50 levels of 11,066.20, which now remains its immediate support point. The key challenge is re-entry in upward channel i.e to close above 11,366 (level for Sep 9). On downside around 10,850 is the next support level which is also the lows of Aug 2020 (shown as Line C), followed by 10,485 at line D.
Fibonacci level of 61.8% stands at 10,274 and 50% retracement level is at 9605 (line F) which has played support and resistance at multiple occasions in the past and is also crucial point of pre COVID fall.
- Rajesh Ramchandani
USDINR breakout for Long with Good R:RUSDINR has been consolidating since one week and tried to form a base (at the demand zone). In Previous day session it broke its resistance (73.65), and sustained above it. At current level it is looking good for long with good R:R, Minor hurdle at 73.9.
Nasdaq...Where will the bullet train stop ?Last Close : 10854.8
For the week 13-17 July 2020
Any pull back near 10661 will be bought into.
Targets for bulls i have marked in the chart.
Below 10538... Bears will be in control
Will review this again in the next week.
Like... Share.. Follow... Stay tuned.


