S Chand & Company Ltd. ---- Deep Analysis (On Subscriber's Demand)
S Chand & Company Ltd. ----Deep Analysis (Weekly & Daily Outlook) + Fundamental Outlook
===========================================================
1. Technical Outlook---------
This analysis is made on Higher Time frame Combined (Weekly & Daily)
I have used Weekly Time Frame chart for showing analysis (I will update Daily chart on Note.)
My Observation ----
1. Market Structure Shift (MSS) --
--Clear Shift from bearish to bullish around late 2020, with break of sturcuture (BOS)
and formation of idm (Inducement)
-- there we saw a trendline liquidity sweep and Institutional BUying Zone near 148-160 levels.
2. Current Price Acttion ---
-- Price currently reacting around 209-210 as former resistance and now becoming potential support.
-- Price has entered previou supply zone, targeting for High Probability POi zone near 260-300 levels.
3. Long Term Institutional Accumulation Zone --
-- Accumulation range and Institutional buy Zone are identified (you can check, i have marked in bold grey.)
-- The Bullish FVG(Fair Value Gap) and Order Blocks zone are respected buy price which means it follows Smart Money.
Short Term Bias (3-4 weeks ) ---- Bullish Outlook
Entry ZOne -- CUrrent Price zone around 210 can act as a base for short term long.
Immediate Target -- 270-280 Levels (A Minor Supply ZOne)
Pullback Possibility -- If market needs liquidity then it may test back towards 200-205 zone (Demand Flip Zone)
SL Zone -- If price breaks below 195-200 on strong volume then it voids the Bullish move for short run.
Mid term Bias (1-3 Months) --- Same Bullish Outlook
Price is gearing up to revisit the High Probability POI around 300-320 levels (Marked in Bold)
Weekly Sturcture is clean and following --
Accumulation >> Expansion >> Pullback >> Re-accumulation >>> Expansion
For Entry module --- Always follow lower time frame and check the Structure shift and displacement for Entry purpose.
IMP --- I will also share (on Note) Daily Time Frame chart and Lower Time Frame chart for Entry module Education purpose. Just Check that also on time when price reaches the demand zone marked in bold.
======================================================================
2. Fundamental Outlook ----------- (Source - Screener)
-- Company is engaged in publishing educational books with products ranging from schools books
, higher academic books, competition and reference books etc.
-- S chand & company is on 2nd position according to Market Cap in its peers and key competitor is Navneet Education.
-- Company has a diverse portfolio with over 11000 titles and has sold over 50 million books in past year.
-- Latest News on S chand reports Highest 5-year revenues.
---Compounded Sales Growth
10 Years: 4%
5 Years: 11%
3 Years: 14%
TTM: 9%
---Return on Equity
10 Years: 3%
5 Years: 4%
3 Years: 5%
Last Year: 6%
FY25 Projections ---
1. The Company Expects their Operating Revenues to grow in double digits.
2. EBITDA margin band upgraded to 17%-19% (up from 16%-18% in the last year).
3. Company aims to remain net debt-free for at least three quarters during FY25.
(Source -- Screener website for Fundamental information)
==========================================================================
(Traders and Analysts or Anyone, Your views or observations and comments are most welcome.)
Disclaimer -- This analysis is made for Educational purpose only. Do not consider it as any Investment idea. Consult your financial advisor before any investments.
Navneeteducation

Navneet - Padhega India Tabhi toh Badhega India!!Excellent quarterly numbers and perfect breakout on charts. Looking good on all time frames. Hold tight for easy 2x in 2-3 years.
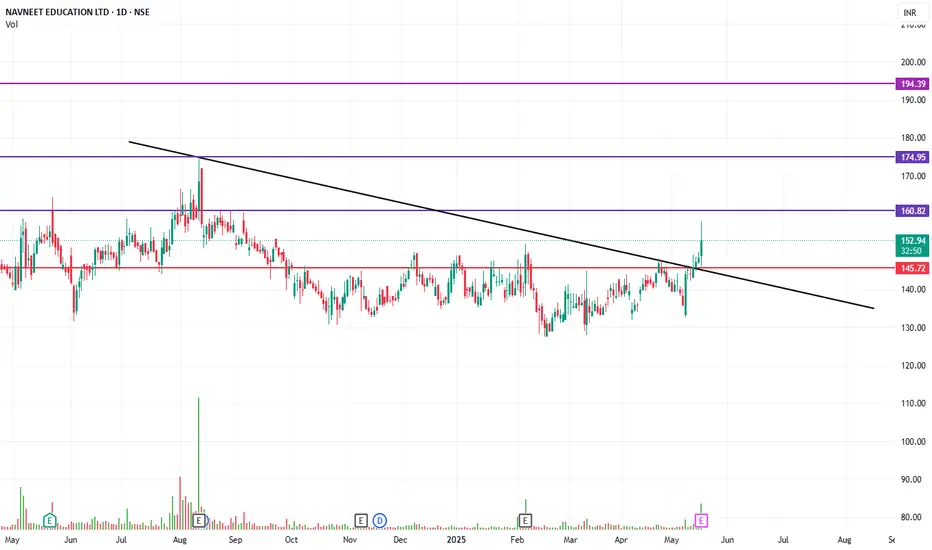
Navneet Education cmp 145.38 by Monthly Chart viewNavneet Education cmp 145.38 by Monthly Chart view
- Resistance Zone at 153 to 161 Price Band
- Weekly Support at 128 > 107 > 91 with Resistance at 161 > 175 > ATH 193.50
- 5+ odd years long timeframe Bullish Cup & Handle with tad bit higher neckline at Resistance Zone
- Price trading within 132 to 168 range with one dip below 132 and few spikes towards ATH 193.50 but breakouts failed

NAVNEET EDUCATION -SWING TRADE1. Good consolidation of 9 months
2. Strong breakout candle
3. Volume Pop
4. Good risk-reward setup

NAVNEET EDUCATIONCompany has reduced debt.
Company is almost debt free.
Company has been maintaining a healthy dividend payout of 38.2%
Navneet Education Limited is primarily into manufacturing and trading of education books, reference books, technical & professional books in paper form and e-learning form, and also paper and non-paper based stationery products
Co. has a dominant market share of ~65% in western India. The company serves 5 Mediums/Languages for State Board Publications including CBSE/ICSE
Co. has 600+ SKUs for 30+ countries. Out of this, 60% of the total stationery exports are from the US market making it the most important market. Walmart is a preferred client.

NAVNEET EDUCATION - 57% RETURNS!!!BUY - NAVNEET EDUCATION
CMP - Rs. 91
Target - 1: Rs. 125
Target - 2: Rs. 145
.
.
Technicals - 1) Harmonic Patterns - Bullish Bat
2) Fibonacci Retracements to identify potential targets.
.
.
Comment: 1) Stock is in consolidation.
2) Target 2 will be achieved after 1 year.
.
Follow me for more!

NavneetEducation#NavneetEDUCATION
Massive Volume breakout
In Stage 2 as per stage analysis
Retest done candidate
Inside Bar on weekly chart
low volume retest
Good fundamentals growth
Entry on CMP
with SL of 95
Targets: 138/153/165


Volume is cooking but price isn't. Volume increasing, but no movement in stock price.
Smart money is being invested.
Invest and sit. 😋

NAVNEET EDUCATIONNote:
1. Views are personal and for educational purposes only. Recheck and take the trade as per your RR.
2. Always remember SL is your lifeline, not the big target...
3.Follow us for more patterns and like, share so that we feel it is helpful to many and share more patterns...
3. Views given here is not a tip rather it is for educational purpose... Aftermarket opens, the condition might change so learn to handle different conditions...
4. To learn more about patterns, Psychology behind the trade, and price action trading... contact us... Thanks...
Keep an eye ladies and gentlemen. Cheers and Happy Trading

