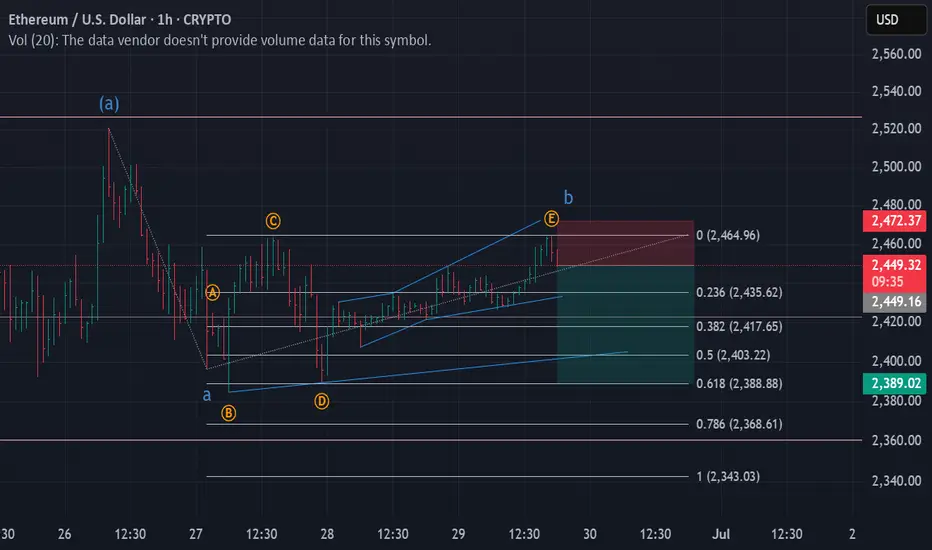
ETHUSD | SHORTEthereum seems to have completed Wave B and currently going to start Wave C of a ZigZag.
Current Price -> 2450
Stop Loss ~> 2475
Target 1 -> 2400
Neo Wave
Bitcoin | ShortBTC seems to have completed Wave B and now entering Wave C for a downside.
SL -> 108,550
Target1-> 107,400
Current Price -> 108,100

INFY | DOWNTRENDInfosys seems to have completed Wave B on a larger timeframe
and we have now entered Wave C to the downside.
Recommended to stay away from this stock for long term investment

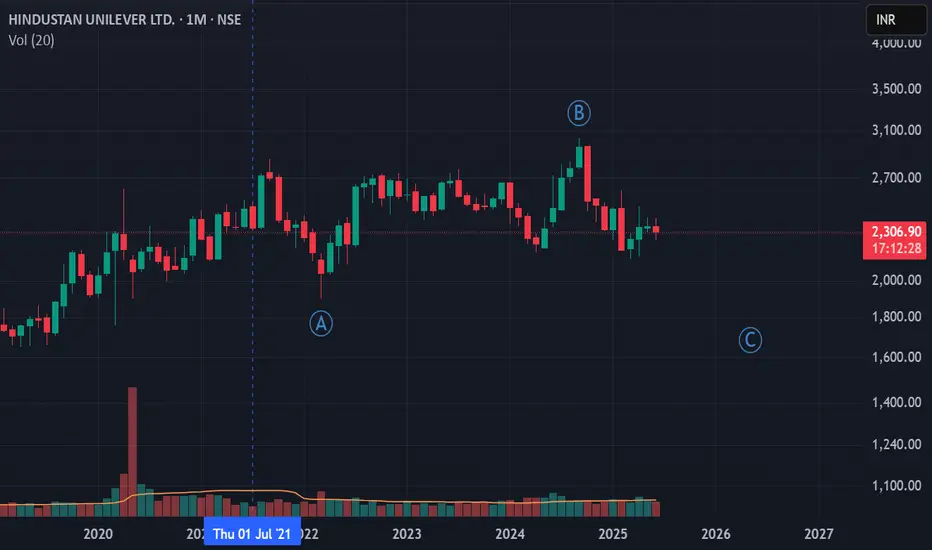
HINDUNILVR | In a downtrendHindustan Unilever seems to have completed Wave B on a monthly timeframe and has entered Wave C.
It's better to stay away if planning for long term investment
EURUSD Chart Analysis : An Elliott Wave Approach Hello friends, welcome to RK Charts!
Today, we'll analyse the EURUSD chart using Elliot Waves. This study is based on Elliot Wave theory and structure, which enables multiple possibilities. Please note that the possibilities outlined here are not definitive predictions, but rather potential scenarios.
The provided information is for educational purposes only and should not be considered trading advice. There is a risk of being completely wrong, and users are warned not to trade or invest solely based on this study.
We are not responsible for any profits or losses incurred. Individuals should consult a financial advisor before making any trading or investment decisions.
Now, let's dive into the analysis. According to Elliot Wave principles, we're currently in a corrective pattern, which consists of ((A)), ((B)) and ((C)) patterns. We've completed ((A)) and ((B)) and are now unfolding ((C)).
Within ((C)) we expect five sub-divisions, labeled as intermediate waves (blue bracketed): blue (1), (2), (3), (4) & (5). Almost four of these sub-divisions are completed, and we've just begun the (5).
We've set an invalidation point at 1.1065, which is the recent low. If this low is not breached, we'll likely continue unfolding the (5) wave of ((C)), which should break above the high of wave (3).
However, if the low is breached, it's possible that wave (4) is undergoing a double correction.
Both scenarios are possible, and we'll continue to monitor the market's unfold.
Scenario 1
Scenario 2
This study is a deep dive into Elliot Wave counts, aligned with the rules and principles of Elliot Wave theory, as well as higher time frame and higher degree analysis.
I hope this analysis based on Elliot Wave theory has helped you understand the chart better and learn something new. Please keep in mind that this is for educational purposes only.
I am not Sebi registered analyst.
My studies are for educational purpose only.
Please Consult your financial advisor before trading or investing.
I am not responsible for any kinds of your profits and your losses.
Most investors treat trading as a hobby because they have a full-time job doing something else.
However, If you treat trading like a business, it will pay you like a business.
If you treat like a hobby, hobbies don't pay, they cost you...!
Hope this post is helpful to community
Thanks
RK💕
Disclaimer and Risk Warning.
The analysis and discussion provided on in.tradingview.com/u/RK_Charts/ is intended for educational purposes only and should not be relied upon for trading decisions. RK_Charts is not an investment adviser and the information provided here should not be taken as professional investment advice. Before buying or selling any investments, securities, or precious metals, it is recommended that you conduct your own due diligence. RK_Charts does not share in your profits and will not take responsibility for any losses you may incur. So Please Consult your financial advisor before trading or investing.

STAY AWAY FROM LIC HOUSING FINANCELIC Housing Finance is in down trend since July 2024. It has form a downward sloping triangle. we are in Big Wave E of a triangle and we are going to see one more triangle within a triangle, Once the small triangle which is forming in last leg of E is completed we will see uptrend, but the confirmation will come only after we close successfully above 600. Remember Stock movement is not linear, what that means is after the cross over above 600 we will see a pullback which will be the time to go long, till then need to keep patience.
Disclaimer: This Idea is for educational purpose only and its not a buy or sell recommendation. you guys do your own analysis and decide.

RELIANCE INDUSTRIES IN LAST LEG OF CORRECTION ??Reliance Industries has seen a lot in last few months. Its time for Reliance industries to complete its last leg of correction and then resume its upward journey.
2 possibilities in last leg of correction.
1) It can be an impulsive move which will be in 1-2-3-4-5, which will be overall Wave C
2) It could be a triangle in which case the downfall and so the correction will be limited but boring.
Check out my previous chart on Reliance Industries.

POWER GRID CORPORATION SHOWING POWERWe have completed the Corrective waves and Impulsive waves have begun.
I can think of 2 possibilities as of today:
1) We are in 5th wave which should get truncated and soon the corrective phase which will be either simple or complex will start
2) If we are still in wave 3 continuation then we will reach 339++.
In any case we are in uptrend and there is still long way to go.
First Immediate target expected it to be 315 and if we are in 2nd possibility then we will reach 330++ soon.
Disclaimer: I am not SEBI registered member. This Idea is only meant for Educational Purposes.

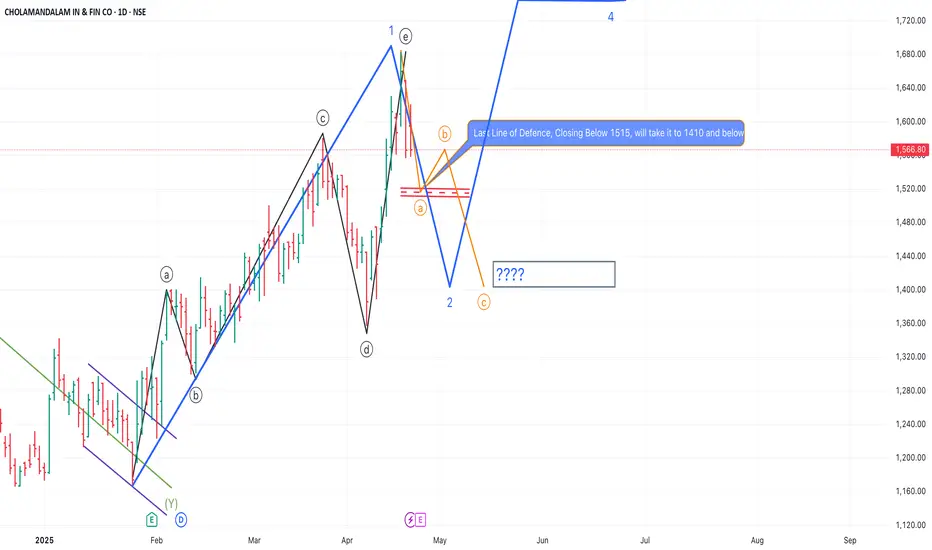
CHOLAMANDALAM NEEDS BREAK After a good run up any stock needs break. Cholamandalam Investment and Finance Company is no different. What you see on the chart is the completion of the Leading Diagonal, what's coming next is correction a-b-c. Now the question stands is how many days of break is needed before it could resume its upward Journey. If its closes below 1515, then the vacation is long.
Watchout for the levels in chart. when its ready it will be difficult to stop Cholamandalam's upward journey.
Please refer my earlier chart, hope you guys have benefited.
Disclaimer: This is only for Educational Purpose. I am not an SEBI registered member.
Gold Long Term Neowave ForecastHello Everyone
FX:XAUUSD In this we are going to talk about gold in detail
## As long as we are above 2771, gold will bullish till May-June. But to confirm this we will need to wait for 2 or 3 more weeks, so buy in parts.
## Inner stucture is in correction of traditional ABC structure and still in developing phase. But i have remove them so that who dont understand neowave wont be confused.
## Apart from this i am adding Live link for fast updates. so if you have any query. Kindly leave a comment. I will be happy to guide you further more.
Live Link- in.tradingview.com

ZOMATO WILL IT KISS 234 or WILL THE DOWNWARD JOURNEY RESUMEI can see 2 possibilities in Zomato:
1) It will reach 234 and resume the downward trend
OR
2) Wave e will get truncated and will resume the downward journey
If it turns out to be 2 possibility get ready for the sharp fall.
Disclaimer: I am not SEBI registered member, these ideas are meant only for educational purpose.

TWO POSSIBILITIES IN ICICI BANKI could think of 2 Possibilities in ICICI Bank. Its still in complex correction
1) The last wave (Wave C) of the W-X-Y correction could be a triangle in which case we will see 3 more waves
OR
2) It could be an Expanded/Regular flat. In this case only wave C has to be completed.
In either case the correction is still on-going and its not yet done.
Disclaimer: I am not SEBI registered member and this idea is meant only for educational purposes

TATAMOTORS ONLY BENEFICIAL FOR SHORTS ???So Far in Tata Motors Only shorter's have benefitted. How long the shorter's will continue to benefit, not for very long time. Wave 4 is going to end soon and we are about to complete wave 5 of 5.
Possibilities:
1) Wave 5 will get truncated and we will see the upward trend soon
2) Wave 5 will take its own time to complete it and will end around 600-605.
if I have to short I will be very cautious and will go only with very strict stop loss.
Disclaimer: I am not SEBI registered member. This is only for educational purposes, please do your own analysis before taking any trades.

NLC buy above 275 for target of 307 plusLook at the NLC chart, you will see that the downside it will go to 214-210 to complete the C wave in which e-wave will reach 214-210 to complete the triangle. However there are chances of truncation and it might start moving up. The strategy is to let it move conclusively above 275 rs, post which it will reach 307 plus in matter of few days
if you are impatient then you can purchase now, but also consider the downside before taking any decision.
Disclaimer: I am not SEBI registered member and this idea is only for educational purpose, do your own analysis and then take a call.

WHERE DOES RELIANCE INDUSTRIES STAND AS OF 13th MARCH 2025we are about to complete Wave e of Wave 4 and we still have long way to go before we see some sunshine, what this means we still have wave 5 to complete. Please refer the below charts which I posted in the past.
Disclaimer: I am not SEBI registered member and these ideas are meant only for educational purposes only

Elliott Waves Insights: Tesla’s Roadmap to SuccessHello friends, let's analyze Tesla's chart using theory. This is a 4-hour chart where we can clearly see that the higher degree, primary degree wave ((3)) in black has been completed. Currently, we're on the verge of completing wave ((4)) in black of the primary degree, which has three subdivisions marked in blue as (A), (B) & (C).
(A) and (B) are completed, and (C) is near completion. Within (C), we have five subdivisions in red, of which 1, 2, 3, & 4 are completed, and the 5th is also more than 60% complete. Once the red fifth is complete, it will mark the end of blue (C) and primary degree wave ((4)) in black.
As soon as wave ((4)) is complete, we can expect a reversal, which should be wave ((5)). Which should cross the high of wave ((3)) which is ATH, So, we're expecting wave ((5)) to start move upwards.
Now, friends, what's the invalidation level for this view? It's $139.20. This is a level that wave ((4)) should not cross, as it's the low of black wave ((2)). According to theory, wave 2 cannot retrace more than 100% of wave 1, wave 3 cannot be the shortest in impulse, and wave 4 cannot enter the territory of wave 1, which is here we’re witnessing in current scenario, which is considering we’re in any diagonal or triangle of higher degree.
If wave ((4)) crosses $139.20, it will invalidate our view. We might be missing some dots to join or create the picture perfectly. Currently, the price is around $222, and we might see a small bounce before making a lower low possibly around $200. If we witness a divergence there, it could lead to a reversal.
Please note that this study uses theory and structures, involves multiple possibilities, and focuses on one potential scenario. There's a risk of being completely wrong. This is for educational purposes only, and users should not trade or invest solely based on this study.
I am not Sebi registered analyst.
My studies are for educational purpose only.
Please Consult your financial advisor before trading or investing.
I am not responsible for any kinds of your profits and your losses.
Hope this post is helpful to community
Thanks
RK💕
Disclaimer and Risk Warning.
The analysis and discussion provided on in.tradingview.com/u/RK_Charts/ is intended for educational purposes only and should not be relied upon for trading decisions. RK_Charts is not an investment adviser and the information provided here should not be taken as professional investment advice. Before buying or selling any investments, securities, or precious metals, it is recommended that you conduct your own due diligence. RK_Charts does not share in your profits and will not take responsibility for any losses you may incur. So Please Consult your financial advisor before trading or investing.

Possible Elliott Waves Counts of BITCOINHello friends, today we're analyzing the Bitcoin chart based on Elliott Wave Theory. We're using a 4-hour chart, where we can clearly see that we've completed the intermediate degree 3rd, 4th, and 5th waves means the completion of the primary degree ((3)) wave marked in black. After that, we completed another primary degree ((4)) wave marked in black.
Currently, we're moving upwards, which should be the primary degree ((5)) wave, containing five sub-divisions marked in blue as (1), (2), (3), (4) and (5) We've almost completed the (1) sub-division and are nearing the completion of the (2) sub-division.
According to Elliott Wave Theory, if the recent low wave ((4)) at around $70,200 holds and doesn't break below, the price has the potential to reach new highs towards $110,000 to $120,000. This analysis is entirely based on Elliott Wave Theory and its structure.
In this study we used Elliott Wave Theory & Structures, here we have plotted possible wave counts on daily time frame chart of DXY Dollar Index, it involves multiple possibilities, and the analysis presented focuses on one potential scenario. The provided information is for educational purposes only, not trading advice. There's a risk of being completely wrong.
I am not Sebi registered analyst.
My studies are for educational purpose only.
Please Consult your financial advisor before trading or investing.
I am not responsible for any kinds of your profits and your losses.
Hope this post is helpful to community
Thanks
RK💕
Disclaimer and Risk Warning.
The analysis and discussion provided on in.tradingview.com/u/RK_Charts/ is intended for educational purposes only and should not be relied upon for trading decisions. RK_Charts is not an investment adviser and the information provided here should not be taken as professional investment advice. Before buying or selling any investments, securities, or precious metals, it is recommended that you conduct your own due diligence. RK_Charts does not share in your profits and will not take responsibility for any losses you may incur. So Please Consult your financial advisor before trading or investing.

Cholamandalam Next Immediate Target Expect to be1465Cholamandalam was in correction for a long time, it has just now wakeup. As per the Analysis I am expecting the first wave to end at 1465.
Will keep on updating the chart as we move ahead.
Disclaimer: I am not SEBI registered member, this Idea is only for educational purposes.

Bitcoin Analysis Bitcoin Analysis
Its Looking like bullish and bulls are trying to control the market but, wave analysis is saying its should come one more down than final up

DLF mine favorite stock, its time againDLF was in sideways moves for quite a long, however it was trying to finish the contracting triangle. What more we are at the right time.
Possibilites:
1) we can have another small contracting triangle in which leg e will be the leg a and so on.
2) we will see a sharp move towards 944-945 considering the triangle is completed.
Its a little wait and watch situation for few more days before we see any conclusive move.
Disclaimer: This is for educational purpose only. I am not authorised to give buy/sell recommendation. please do your own analysis and then take a decision.

Cipla Update after the Correction
Please refer the earlier chart of Cipla. Correction is over, we are seeing a big move up after the end of correction at wave e, remember there might be a pull back but overall the uptrend has just began. I am expecting that Cipla to move at 1675-1679 by Mid March to End of March.
First Immediate move to 1580 and then the rest will unfold slowly.
Disclaimer: I am not SEBI registered member and these Ideas are meant only for educational purposes.

DR REDDY GAP DOWN IN 3rd WAVEwe clearly see GAP DOWN in 3rd wave of the 5 waves of the C wave. What does this indicates? A fall to complete the 3rd wave was quick. we are done with 3rd wave and in the process to complete the 4th wave.
Possibilities:
*) Downward it can go to 1148-1160 to complete the 5th wave.
*) It may close the 3rd wave Gap before resuming its downward Journey to complete the 4th wave. (Less Probability)
In Either case I would prefer not to enter any new position and wait for the right opportunity.
Disclaimer: I am not SEBI registered Member. This is Strictly for educational purpose only.

Diametric pattern near completionNifty should show a Fall towards 22600 levels once g-wave of the Diametric pattern ends.
Looking out for reversals near Daily Central Pivot
