GOLD hits a new all-time high at $4,200 for the first time ever.🚨JUST IN: GOLD hits a new all-time high at $4,200 for the first time ever.
Now here’s the real question:
Will Gold retrace back to the $3,000–$2,500 zone soon?
That region aligns perfectly with the 0.382 Fibonacci retracement, a level where Gold has historically cooled off before launching its next major bull rally.
Eyes on the golden pullback before the next explosion.
NEWS

BTCUSD RAINING BLO*D🩸 BTC slapped our sell-limit like it owed it money 💀 The setup looked clean — until the bulls said “Not today.” We’re running in drawdown, but structure still holds hope ⚔️
📉 Current View:
BTCUSD 1H — Price rejected around 115.9K–116.8K liquidity zone after a market structure shift (MSS) at 113.0K. Structure remains bearish unless daily closes above 116.8K.
📊 Key Levels:
🔴 Resistance/Sell Zone: 115.8K–116.8K (OB / liquidity)
⚫ Structure Break: 113.0K → below = continuation
🟢 Buy Re-entry/Demand Zones: 112.4K–111.7K | 109.8K–108.9K (golden pocket)
🧠 Trading Plan:
• Bearish bias holds while below 116.8K → Target 113.0K then 109.8K
• Bullish flip only if daily candle closes above 117K → Next target 119.5K–121.2K
📰 BTC Update:
ETF inflows slow mid-October; CPI data due this week could spark volatility. Derivatives funding rates mildly positive — short-term long bias possible, but liquidity still favors downside traps.
💬 Trader’s Humor: “Sell-limit triggered, stop-loss flirting, and patience getting margin-called — just another day in crypto.” 😂
#BTCUSD #BitcoinAnalysis #CryptoTraders #SmartMoneyConcepts #PriceAction #ForexCommunity #CryptoSetup #TradingLife #TraderHumor #BitcoinForecast #CryptoAnalysis #LiquidityHunt #PriceActionTrading #CryptoCommunity #BTCSetup #ForexAndCrypto #alphatechfinances

Gold’s Medium-Term Play: From Momentum Peaks to Reload Zones!!Gold’s rally has been relentless, breaking out of ranges and pressing higher into the 3750s. That strength reflects the macro backdrop where the Fed is walking a fine line: inflation is sticky, growth signals are uneven, and market expectations are already pricing a deeper rate-cut cycle. Yields have softened, the dollar has lost some shine, and capital continues to flow into safe-haven trades. All of this leaves gold well supported in the medium term, though the path forward will not be a straight line.
Target Zone (3827–3840):
The immediate stretch for bulls sits higher around 3827–3840. This is where the rally could stall as momentum traders lock in profits. A clean break and hold above this zone would open the door to new all-time highs, but the market could just as easily treat it as a ceiling before pulling back.
Hidden Bounce Zone (3720–3680):
Sitting just under the current price is a pocket that often acts as a liquidity trap. Markets can bounce sharply from here or slice through with equal speed. For active trades this zone will give the first clue whether momentum is running out of steam.
High-volume Zone (3630):
This level is the backbone of the current structure. Holding above it keeps the broader trend intact. A decisive break below, however, signals that the correction phase has started and the market is hunting for deeper liquidity.
Correction Band (3600–3560):
If gold slips into this range, expect chop and sideways action as weak longs get flushed out and new buyers gradually step in. This zone isn’t where the story ends, but where the market catches its breath.
Medium-Term Reload Zone (3440–3480):
This is the level that matters for swing trades. If a deeper washout comes, this area offers the opportunity to reload positions for the next major leg up. The medium-term backdrop still favors higher prices, with rate cuts, a weaker dollar, and central bank demand forming a strong tailwind.
Macro Picture
Fed Outlook: Committee members are split, but the overall tone is tilting toward easing as growth cracks widen. Powell may sound careful, yet markets are already betting on more cuts ahead.
Dollar and Yields: The dollar index remains pressured while U.S. yields edge lower, creating a supportive base for gold.
Global Flows: Central banks remain steady buyers, and geopolitical tensions continue to underpin safe-haven demand.
In short, gold has room to push into the 3827–3840 zone, but trades should prepare for corrective phases along the way. The hidden bounce pocket and HVZ will decide the near-term path. Should the market wash down into the 3440–3480 reload zone, it should be seen not as weakness, but as a prime setup to load into the medium-term bullish story. Trade safe!

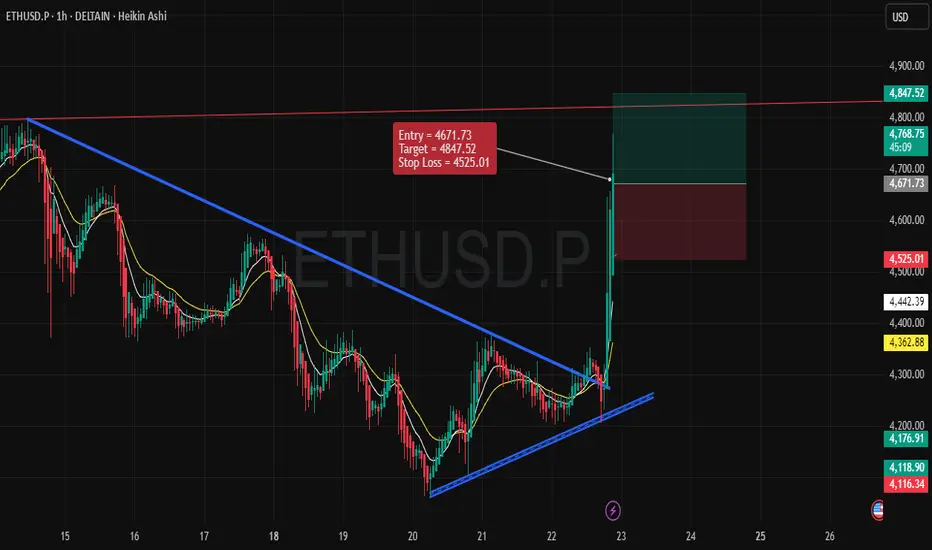
Bullish Scenario for ETH/USD (1-Hour Time Frame)Entry Point: 4671.73
Stop Loss: 4525.01
Target (Take Profit): 4847.52
1. Price Structure and Trend:
The price has been moving within a well-defined downtrend, but there has been a noticeable shift. The recent breakout above the blue trendline signals a potential reversal from a bearish to a bullish trend.
This breakout indicates increased buying interest, suggesting that ETH/USD might continue its upward momentum in the short term.
2. Key Levels:
Support Level: The price has recently bounced off a support zone near 4525, which acts as the stop loss level. A strong bounce from this point further validates the bullish outlook.
Resistance Level: The target price of 4847.52 is placed near a resistance zone, which represents the next major hurdle for ETH/USD.
3. Entry Strategy:
The entry point is placed at 4671.73, just after the breakout above the blue trendline, where the price is gaining upward momentum.
The market seems to have found new buying strength after consolidating, which strengthens the case for a potential move to the target level.
4. Risk-to-Reward Ratio (RRR):
The risk-to-reward ratio for this trade is favorable, with a potential gain of around 175 points (4847.52 - 4671.73) against a risk of approximately 146.72 points (4671.73 - 4525.01). This results in a solid 1:1.2 RRR, which is a reasonable expectation for this bullish trade.
5. Indicators and Confirmation:
The chart features moving averages (yellow and white lines) indicating a shift from a bearish trend to a bullish phase.
The price action shows strong buying pressure, especially with the recent candlestick pattern, confirming the breakout and trend continuation.
6. Conclusion:
With a confirmed breakout, an entry at 4671.73 offers a great opportunity for a bullish move towards the target of 4847.52. The stop loss is safely placed at 4525.01, considering recent support.
This trade setup appears well-aligned with the current market conditions and technical indicators, making it a logical and worthwhile trade idea.
Monstrous Volatility following Tariffs and NFP ForecastsHello Traders, It's that time of the month! :D Not what you are thinking.. But It's NFP Week! What an eventful week it's been already for the Euro. 450 Pips and we still have 3 more trading sessions to complete. I looked back two years and still did not find a week of matched volatility. A Major upside push has seen EurUsd tear it's way back from the depths of near Par (1.04) to well back inside the Monthly range between 1.104 and 1.056.
Trump Tarriff speeches, and fueled further by weak U.S. ADP data on Wednesday has given the Euro a monstrous exscuse to gain more value than it's seen in Years aginagst the dollar. Prepare for a wild end of the week with Jobs data forecasted to improve slighlty across the past data point.
What prices do we like moving into NFP day?
-Bullish targets are a tap into 1.08740, Weekly Resistaance Level
-Bearish targets could be 1.074
Otherwise we have some 1hr and 4hr Zones in the middle which could provide good risk/reward trade ideas.
Please leave a Rocket if you enjoyed and Follow for more Analysis.

What is the Producer Price Index (PPI) ?
🔍 Definition: Producer Price Index (PPI)
📍 Measures the average price change over time received by domestic producers for their goods and services.
📍 Indicates inflation trends at the wholesale level.
🚨 C ompilation:
📍 Based on thousands of price indexes categorized by industry and product types.
📌 Data Collection:
✅Relies on ~100,000 monthly price quotes provided voluntarily by 25,000 producer establishments.
⚠️ Release Timing:
📍 Published monthly by the U.S. Bureau of Labor Statistics (BLS) during
the s econd week of the month .
📌 Economic Significance:
🟢 Rising PPI: Suggests increasing production costs, potential inflationary pressures.
🔵 Falling PPI: Implies reduced cost pressures and possible deflationary signals.
🔥 How Many Moment Expected in Gold : 100-150 PIPS
( EASY TO TRADE BECAUSE FOLLOW TECHNICAL)
📚 Learn more about trading strategies and market insights!
💡 Follow for more educational content to boost your trading knowledge. 🚀

What Is NON-FARM PAYROLL (NFP) ?Non-Farm Payroll (NFP)
The Non-Farm Payroll (NFP) is a crucial U.S. economic indicator that tracks changes in the total number of paid workers, excluding farm workers, federal employees, private household workers, and nonprofit staff. It is released on the first Friday of every month and significantly impacts the forex market due to its implications for economic growth and inflation.
________________________________________
Key Points:
What is NFP?
Tracks the total number of paid workers in the U.S., excluding certain sectors (e.g., farms, government, private households, nonprofits).
Indicates labor market health and economic trends.
⚠️Release Schedule:
Published on the first Friday of each month .
Provides monthly updates on U.S. employment changes.
📊Market Impact:
Causes significant rate movements in the Forex Market.
Anticipated by traders, analysts, and investors for market forecasting.
📊Economic Implications:
Increasing NFP Numbers:
Signals economic growth and currency value appreciation.
Can raise concerns about inflation risks.
Decreasing NFP Numbers:
⚠️Indicates potential economic slowdown or broader issues.
NFP serves as a barometer for the U.S. economy and is closely monitored for decision-making in financial markets. 📊
🔥 How Many Moment Expected in Gold : 160-200 PIPS
📚 Learn more about trading strategies and market insights!
💡 Follow for more educational content to boost your trading knowledge. 🚀

XAU/USD 4H Analysis: Bullish Momentum Towards $2,780📊 XAU/USD 4H Chart Analysis – Bullish Momentum 🚀💰
📌 Key Observations:
🔹 Current Price: $2,754.16 (+0.19%)
🔹 Support Zone: $2,740 - $2,750 (Previous resistance turned support ✅)
🔹 Resistance Zone: $2,780 (Next potential target 🎯)
🔹 200 EMA: $2,687.43 (Price is above = Bullish signal 📈)
🔹 Breakout Confirmation: Price has broken past a key level and might retest before moving higher 🔄📊
📉 Potential Scenarios:
✅ Bullish Case: If price holds above $2,750, we could see a rally towards $2,780+ 🚀
❌ Bearish Case: If price drops below $2,740, we might see a correction back to $2,720 ⚠️
🔥 Conclusion:
Gold is showing strong bullish momentum and may continue its uptrend towards $2,780+ if it sustains above the breakout level! Keep an eye on support at $2,750 for confirmation. 👀💎
Tell me in Comments Would you like further indicators or a different timeframe analysis? ⏳📊

Part 1: How to Analyze Events in the Forex Market?
The forex market is one of the most dynamic and volatile financial markets in the world. It is deeply influenced by global events, economic data, and geopolitical developments. Traders who understand how to analyze these events can make informed decisions and capitalize on market movements.
Influence Of the Global Events:
The forex market is directly linked to global economic health. Since currencies represent the economies of their respective countries, any significant event like an interest rate decision, inflation data, or geopolitical conflict. It can cause major fluctuations in currency prices. Here’s global events play important role:
- Central Bank Policies: When the Federal Reserve (Fed) or European Central Bank (ECB) changes interest rates, it impacts global liquidity and investment flows.
- Economic Data Releases: GDP growth, inflation, and employment reports provide insights into economic stability, affecting investor confidence.
- Geopolitical Events: Wars, elections, trade agreements, and diplomatic conflicts impact currency demand and risk sentiment.
What Happens When News Is Published?
When a major economic event or news release occurs, the forex market reacts instantly. Here’s the typical stages of events:
Stage 1: Market Expectations: Before the news release, traders anticipate the outcome based on forecasts. The market often prices in expectations.
Stage 2: Immediate Volatility: If the actual data differs from the forecast, there’s a sharp price movement in the affected currency pairs.
Stage 3: Liquidity Fluctuations: Spreads widen, and liquidity dries up momentarily as traders rush to execute orders.
Stage 4: Short-Term Correction: After the initial reaction, the market stabilizes, and price action follows the broader trend.
Major Events:
Central Bank Meetings – Institutions like the Fed, ECB, BoJ, and BoE set monetary policies. Interest rate hikes strengthen a currency, while rate cuts weaken it. Forward guidance also plays a role in shaping long-term trends.
Inflation Reports (CPI & PPI): These measure inflation levels, influencing central bank decisions. Higher inflation often leads to interest rate hikes, strengthening the currency, while lower inflation may result in monetary easing, weakening it.
Employment Data (NFP & Job Reports) – The US Non-Farm Payrolls (NFP) report is a key indicator. Strong job growth supports a stronger USD, while weak employment data signals economic trouble.
GDP Growth Reports –:A higher-than-expected GDP growth rate boosts investor confidence and strengthens the currency, while economic contraction leads to depreciation.
Political & Geopolitical Events: Elections, government policies, trade wars, and conflicts create uncertainty, often pushing investors toward safe-haven currencies like the USD, JPY, or CHF.
One's Loss, Another's Win:
When the U.S. releases strong economic data, such as higher-than-expected GDP growth, strong job reports (NFP), or an interest rate hike by the Federal Reserve, The demand for the U.S. dollar increases. This leads to USD appreciation against other currencies, including the euro.
For example,
---> EUR/USD falls : USD is gaining strength, it takes fewer dollars to buy 1 euro, causing the EUR/USD exchange rate to drop.
---> USD/EUR rises : USD is now wortth more, the inverse exchange rate (USD/EUR) increases, meaning 1 USD can now buy more euro.
Key strategies for trading events:
•Stay Ahead with an Event Calendar: Keep track of important economic events and central bank meetings to anticipate potential market-moving news.
• Gauge Market Expectations: Understand forecasts and market sentiment before the event to predict how the market might react.
• Implement Stop-Loss Orders: Protect your trades from excessive risk by setting stop-loss orders to cap potential losses during volatile moves.
• Wait for Market Stability: Allow the market to settle after the event to avoid getting caught in the initial volatility and better assess the trend.
• Evaluate the Market’s Response: Assess the immediate market reaction to the event to identify if the initial price move is sustainable or a short-term spike.
Drawbacks of Trading News:
High Volatility & Whipsaws: Prices can spike in both directions before settling on a trend, leading to stop-loss hunting.
Widened Spreads: During news releases, brokers often widen spreads, increasing trading costs.
Slippage: Rapid price movements can lead to orders being executed at unexpected prices.
Emotional Trading: Sudden market swings can trigger impulsive decisions, leading to losses.
Market Manipulation: Big players and institutions often move the market unpredictably before major news releases.
In the next part, we will focus on the specific events and strategies.

Panacea Biotech-A high risk, huge reward stock!Panacea biotech is in news for developing Dengue vaccine.
Technically, stock has bounced from support trendline and is looking strong to test ATH levels once again which can be around 2x from CMP.
Keep in watchlist. A very risky volatile stock and is not a recommendation.

Idea purely on technical basis + NewsThis idea is purely basis current price action + volume and news. No other factors considered.
NSE:DHANI has shown promising signs of a potential turnaround, indicating a shift in sentiment following a period of indecision or stabilization.
The Diamond Bottom pattern emerges amidst a downtrend, characterized by the formation of higher highs and lower lows within a widening pattern.
Over time, this pattern evolves as the highs reach a peak and the lows begin to ascend, leading to a gradual narrowing of the trading range.
Upon the breakout above the boundaries of the diamond pattern, there's a notable indication of a substantial reversal, marking the onset of a fresh uptrend.
Other things to consider at current situation
- Volume is increasing
- Trading above 10 EMA, 50 EMA and 100 EMA
News
Dated: March 18, 2024
- Submitted the building plans to the Directorate of Town and Country Planning (DTCP) for approvals of 60 lac sq ft of residential development saleable area in Sector 104, Gurugram located on 8 lane Dwarka Express way. The Project is proposed to be launched in July’
- Submitted the building plans for development of saleable area of 2.6 lac sq ft of office space in Worli, Mumbai. The Project is expected to be launched in August’ 2024.
PLEASE NOTE THAT:
This chart analysis is only for reference purpose.
This is not buying or selling recommendations.
I am not SEBI registered.
Please consult your financial advisor before taking any trade

XAUUSD DOWNTRENDIntro Gold
Gold price continues to draw support from bets for a 50 bps Fed rate cut in September.
Falling US bond yields and softer USD also act as a tailwind for the non-yielding metal.
Bulls, however, seem reluctant and await the release of the US NFP report on Friday.
Price Tag
Sell at 2526 - 2530 SL at 2533
TP at 2440

Silver (XAGUSD) and Gold- Important UpdateIt is important not to just focus on the analysis, but also combine it with important news.
It is expected for Silver as well as Gold to rise. But all depends on the Fed-Cut-rate data.
Lest wait, be optimistic and enter at the right point.
I have a long position open, but i won't recommend you take a position for now.
Wait and watch.
Do you own analysis before taking a trade.
BEST OF LUCK !!! :)

DECCAN GOLD MINES!!!Deccan gold mines is rebounding,
It has an support level of @103.5
The stock should be bought @107
For the TGT @128

HERANBAMarket Cap
₹ 1,594 Cr.
Current Price
₹ 398
High / Low
₹ 426 / 278
Stock P/E
46.2
Book Value
₹ 211
Dividend Yield
0.31 %
ROCE
6.72 %
ROE
4.17 %
Face Value
₹ 10.0
Debt to equity
0.20
Debt
₹ 165 Cr.
OPM
6.12 %
Promoter holding
74.9 %
Sales growth
-4.68 %
Profit growth
-66.8 %
CMP / FCF
Industry PE
39.2
Pledged percentage
0.00 %
Reserves
₹ 803 Cr

BUY TATA POWER!!!Tata power should be bought @415RS, as the stock is on the support.
for the TGT of @460RS.

Kotak Mahindra Bank HammeredNSE:KOTAKBANK shares have tumbled after RBI banned the private lender from taking on new clients digitally, due to IT-related deficiencies, raising concerns about the potential impact on the lender that relies heavily on online banking.
The current levels may act as a support but this firm stance by RBI is in line with the recent past actions on various other companies as well. This sector has the maximum headwinds currently and one should be careful of investing in these companies specially when opportunities elsewhere exist.
However, long term investors can start to accumulate this share if they want to have Kotak Mahindra Bank in their portfolio.

Bank Nifty for the coming week.....Hello Friends!!
I hope all of you are doing well!!!!
If Bank Nifty comes in green and the matter is sought out between Iran and Israel... then the drawn line shall be the resistance for the Bank Nifty or it will be easily breakable .....
Pl. provide your views.....
Keep Learning with NG!!

BIG Bounce Or Fall? Banknifty Simple Analysis for tomorrowRecap:
As mentioned yesterday's analysis Bank nifty started with fake break out after firing 2 strong bullish candle on 15min & then a sudden dip trapped many players. But still strong support 46900 helped saved bulls to reach again for a breakout but failed & BN closed at support 46900.
Analysis for Next Day:
Bears have started dominating as seen today bulls failed to break 47200-47300 level twice also confirms bears presence more then bulls. Again mentioning bullish presence is strong above 47300.
Trend line support has also been broken in last 30 min session today & closed at support. if BN open below 46900 this can be bearshish move. Keep eyes on opening print.
Bulls can bounce from daily resistance if gap up opening is seen & for momentum they need to cross 47300.
Looks like may be it will a sideways day tomorrow.
Support : 46900,46700
Resistance : 47100,47300
Note : Do your own analysis before making any trade decesions.

Gold Price Looks for UPTREND
* Gold Price Movement: Gold prices are uncertain and fluctuating.
* Upcoming Data Release: The market is waiting for the US core PCE price index data for November.
* Fed Bostic's View: Atlanta Fed President Bostic sees no urgency for interest-rate cuts, emphasizing the strength of the US economy.
* Fed Barkin's Approach: Fed's Barkin is data-dependent for rate cuts in 2024.
* Current Gold Price: Gold is trading around $2,040.
* Inflation and Interest Rates: Inflation is expected to soften with higher interest rates by the Fed.
* Investor Optimism: Investors are optimistic about future rate cuts in 2024, despite warnings from the Fed about maintaining restrictive interest rates.
* Divergence in Projections: Bostic's view contrasts with the median projection of three rate cuts, creating uncertainty in the market.

VEDL Stock Analysis and Big Demerger NewsHi Friends,
I'm getting queries from many people and so many traders are in panic who are holding VEDL shares. We observed that VEDL looking week since Jun'23 specifically after declare dividend.
I'm already shared levels of 205 to our clients and accumulated more qty yesterday.
What you should know:-
Big News
Vedanta announces demerger to split business into six listed entities
Vedanta announced creation of independent verticals through demerger of underlying companies, mainly its metals, power, aluminum, and oil and gas businesses to unlock potential value.
As stated, the company plans six separate listed entities, namely:
Vedanta Aluminum
Vedanta Oil & Gas
Vedanta Power
Vedanta Steel and Ferrous Materials
Vedanta Base Metals
Vedanta Limited
Vedanta added that the de-merger is planned as a vertical split, for every 1 share of Vedanta Limited, the shareholders will additionally receive 1 share of each of the 5 newly listed companies.

NAVAWait And Watch ??
Look for Low risk, High reward, and High Probability setups-
Things to Remember while Trading with the Trend
1. Know what the trend is.
2. The best trades are made in the direction of the trend.
3. Assume that the main trendline or moving average will hold.
4. The longer the moving average is, the better it defines the trend.
5. Wait for the pullback.
6. Don’t chase the market.
7. Don’t fight the market.
8. Even in the strongest trends there should be some retracement.
9. The closer the market is to the trendline, the better the risk/reward ratio is.
10. Use ADX to determine the strength of the trend.
11. Higher the level of ADX , the stronger the trend, below 20 consider the market to be choppy
12. Hold trades longer in a strong trend.
13. Wait for confirmation of a trendline breaking before reversing position.
14. Know where the Support levels are.
15. Place stops outside the Support levels.
Thank You..

Thomas Cook ready for good profitMy personal view go long with thomas cook. After 15 days consolidate second swing ready for target 160 ++.
Buy cmp @120-123
Target 160 ++
