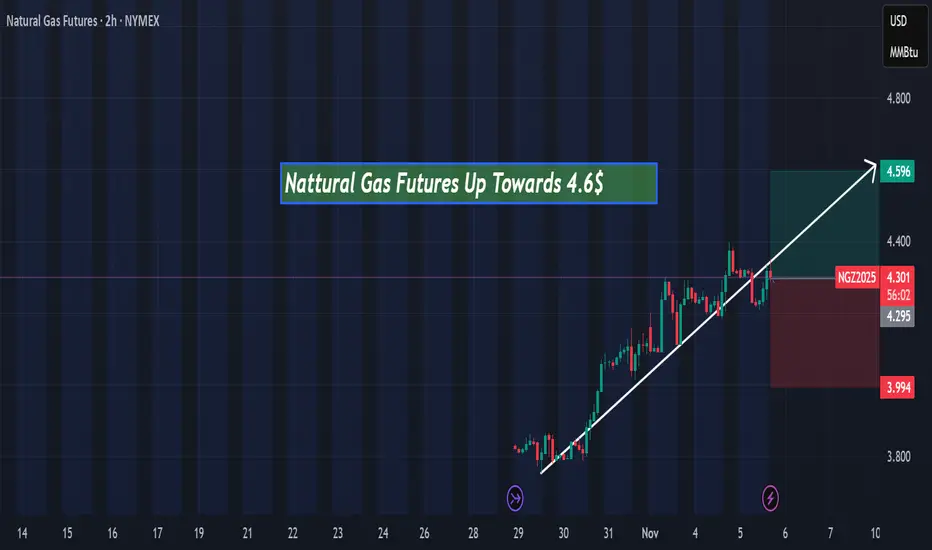
Natural Gas Futures Up towards 4.6$Hi everyone, today Natural Gas Futures is expected to rise toward $4.60 in the next few hours according to my technical analysis.
Natural Gas
Natural Gas Levels For October 2025Important support and Resistance Levels For Natural Gas.
When Market touches the level, the price action plays important roles.
For More Learning Reach out to us.
Natural gas - Matches the exact moves, posted on 24th AugNatural gas - Matches the exact moves, posted on 24th. August
Points gained- 229.5 to 264.8 = 35.3 points
1 Point = ₹1000 (35.3*1000= ₹35300.0)
Holding it, next is 300 & 320 target🎯
Natural gas analysis Monthly Time frameNatural gas markets are influenced by a complex interplay of supply, demand, weather, geopolitical events, and technical factors. Below is a concise analysis based on recent trends and data as of August 24, 2025, covering key aspects of the natural gas market
Price Trends and Market Dynamics
Spot and Futures Prices: The Henry Hub spot price recently fell from $2.92/MMBtu to $2.81/MMBtu, and the September 2025 NYMEX futures contract dropped from $2.828/MMBtu to $2.752/MMBtu. The 12-month futures strip (September 2025–August 2026) averaged $3.501/MMBtu, reflecting a bearish near-term outlook but expectations of tighter balances later.
Supply and DemandSupply: U.S. natural gas production has risen, with a 3% increase in marketed production in 2025, particularly from the Permian (2 Bcf/d), Haynesville, and Appalachia (0.9 Bcf/d each). However, production is expected to stabilize in 2026 as associated gas from oil declines.
Storage: U.S. storage inventories are projected to reach 3,927 Bcf by October 31, 2025, 174 Bcf above the five-year average, due to higher-than-average injections (20% above the five-year average). This surplus is pressuring prices downward.
Demand: Cool weather forecasts for August 2025, potentially the coolest in 50 years, have reduced demand, contributing to bearish price sentiment. However, LNG exports are rebounding, with Freeport LNG operations resuming, providing some support.
LNG Exports: Maintenance at U.S. LNG terminals earlier in 2025 reduced exports, but recovery and new contracts (e.g., ConocoPhillips’ 4 Mt/y from Port Arthur LNG Phase 2) signal growing export potential.
Technical AnalysisBearish Signals: Technical indicators suggest a "strong sell" for Natural Gas Futures across multiple timeframes (daily, weekly, monthly), driven by a head-and-shoulders pattern with prices breaking below the $3.050 neckline, targeting $2.220–$2.000.
Indicators: RSI, MACD, and stochastic oscillators indicate oversold conditions, but negative momentum persists below key resistance levels like $3.100–$3.320. Pivot points and moving averages reinforce bearish trends, with potential support at $2.200.
Geopolitical and Structural FactorsEurope: The 2022–2023 Russian supply shock shifted Europe to rely on LNG, increasing price volatility. Market reforms have boosted trading volumes (7,300 bcm in 2024, 15x demand), but derivatives trading by physical players dominates, limiting speculative impacts.
Weather Impact: Cooling in the Midwest and Northeast (highs of 60s–80s°F) contrasts with hotter conditions elsewhere (80s–100s°F), driving regional demand differences. Weather models (ECMWF, GFS) forecast continued impacts on heating and cooling degree days, affecting prices.
Energy Transition: Natural gas is increasingly vital for electricity generation as coal phases out, linking gas and power markets and amplifying price sensitivity to weather and demand.
Forecast and OutlookShort-Term (1–6 Weeks): Bearish due to high storage, weak demand from cool weather, and technical indicators. Prices may test support at $2.220–$2.080,
Long-Term: Growing U.S. electricity demand (31% over 15 years) and constrained global supply (e.g., limited OPEC spare capacity) suggest bullish prospects for natural gas as a reliable fuel.
Trading ConsiderationsRisks: High volatility, weather-driven demand shifts, and geopolitical uncertainties (e.g., Russia-Ukraine tensions) pose risks.
Strategies: Traders may consider short positions targeting $2.80, but oversold conditions suggest caution for potential reversals. Long-term investors might accumulate near support zones ($2.220–$2.080) for 2026 upside.
Data Tools: Monitor EIA storage reports, weather forecasts (NatGasWeather.com), and technical indicators (RSI, MACD) for real-time insights.
Note: Trading involves high risks, and past performance does not guarantee future results. Always conduct your own research.
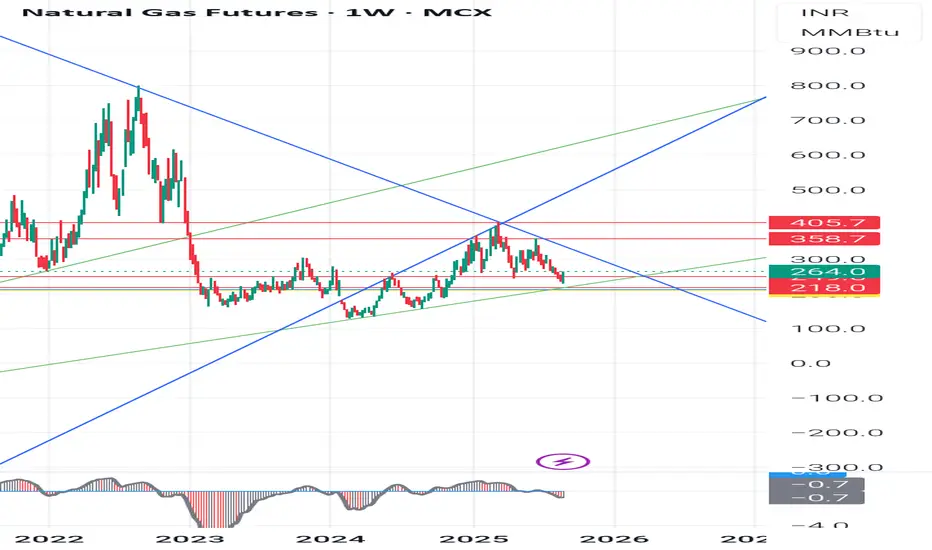
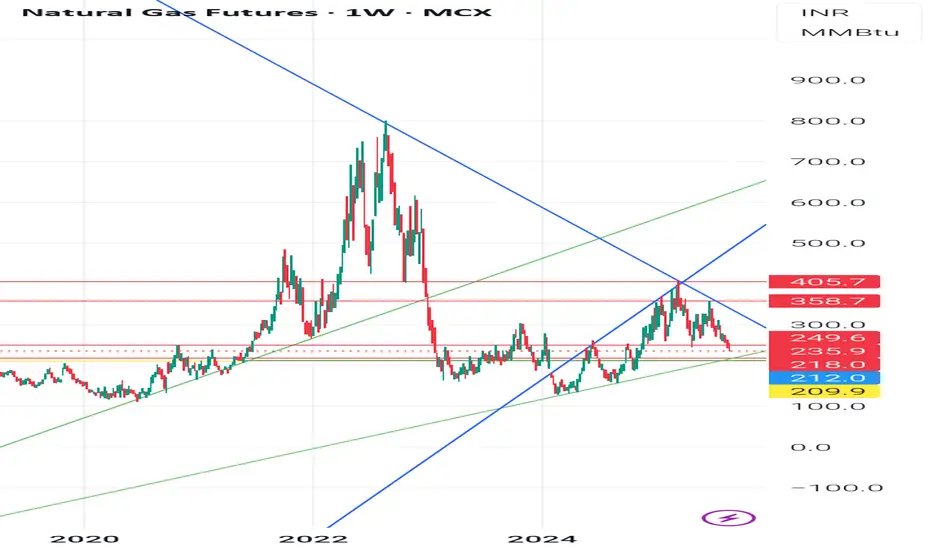
Natural Gas Futures (INR) Weekly Chart pattern analysisNatural Gas Futures (INR) Weekly Chart pattern analysis.
For the students, We will include chart structure, patterns, demand-supply zones, and precise support/resistance levels based on what is seen on the charts :
- Chart OverviewTimeframe: Weekly (1W)Current Price: 244.7 (down -5.30%)Price is near an important ascending trendline support (green line) after a strong correction from recent highs. Structure shows earlier breakout above descending trendline (blue) followed by a retest and rejection.
🧭 1. Trend Analysis- Long-Term Trend:From 2022 highs (900+), Natural Gas was in a sharp downtrend (blue descending trendline).Downtrend broke in late 2023, initiating a mid-term uptrend within an ascending channel.
Short-Term Trend:Since the 405.7 high (early 2025), prices are in a correction phase.Price now testing demand zone near 244-212.
📈 2. Chart Patterns,Ascending Channel: Price has been moving between parallel green lines since late 2023.Breakdown Risk: Price is testing the lower channel line; breakdown could trigger more downside.Head & Shoulders Possibility: The highs around 405-358 resemble a left shoulder-head-right shoulder formation, with neckline near 249-244. A confirmed break below could accelerate selling.
Supply Zone Rejection: Strong selling emerged from 358-405, marking it as a supply zone.
3. Key Technical Levels: Rejection Level: High Significance 405.7
-Major Supply 2025 high, strong rejection point 358.7
Secondary Supplying- Recent swing high before sell-off
249.6-244.7
- Current Zone - Channel support & neckline zone
218.0 - Demand Zone Past consolidation & buying interest
212.0 - Strong Support Historical demand zone floor
209.9
- Critical Support
If broken, opens path to 180-160⚖ 4. Demand & Supply ZonesDemand Zones:218-212 (weekly accumulation area)180-160 (last major base before rally)
Supply Zones:358-405 (heavy selling area)280-300 (minor supply if bounce occurs)
5. Possible ScenariosScenario
1 Support Holds:If 244-212 holds, expect a bounce towards 280 and 300.A close above 300 could re-test 358.
Scenario
2 - Breakdown:A close below 212 could lead to a quick drop towards 180-160.
👉 Disclaimer:
This is for educational purposes only, not trading advice. Futures & commodities are highly volatile; manage risk and consult a registered financial advisor.
#naturalgas #technicallevels #chartpatternabalysis #commoditytrading
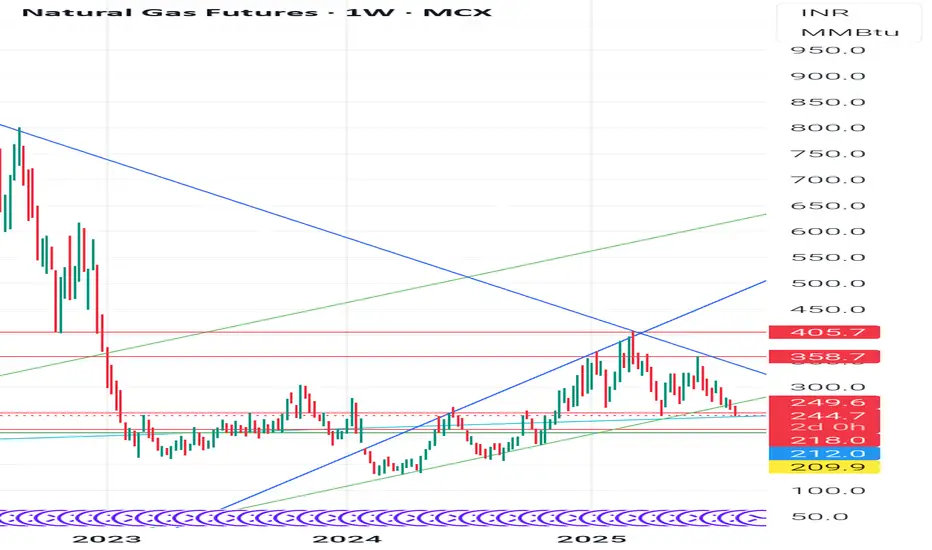
Natural gas: Chart AnalysisLet’s break down the Natural Gas Futures (INR) Weekly Chart step-by-step.
This will include chart structure, patterns, demand–supply zones, and precise support/resistance levels based on what I can see on the charts :
🔍Chart OverviewTimeframe: Weekly (1W)Current Price: ₹244.7 (down -5.30%)Price is near an important ascending trendline support (green line) after a strong correction from recent highs. Structure shows earlier breakout above descending trendline (blue) followed by a retest and rejection.
🧭 1. Trend AnalysisLong-Term Trend:From 2022 highs (₹900+), Natural Gas was in a sharp downtrend (blue descending trendline).Downtrend broke in late 2023, initiating a mid-term uptrend within an ascending channel.
Short-Term Trend:Since the ₹405.7 high (early 2025), prices are in a correction phase.Price now testing demand zone near ₹244–₹212.
📈 2. Chart Patterns,Ascending Channel: Price has been moving between parallel green lines since late 2023.Breakdown Risk: Price is testing the lower channel line; breakdown could trigger more downside.Head & Shoulders Possibility: The highs around ₹405–₹358 resemble a left shoulder–head–right shoulder formation, with neckline near ₹249–₹244. A confirmed break below could accelerate selling.
Supply Zone Rejection: Strong selling emerged from ₹358–₹405, marking it as a supply zone.📍
3. Key Technical LevelsLevel (₹) nType the:Significance 405.7
🔺 Major Supply 2025 high, strong rejection point 358.7
Secondary Supplying- Recent swing high before sell-off
249.6–244.7
⚠️ Current Zone Channel support & neckline zone
218.0 🛑 Demand Zone Past consolidation & buying interest
212.0 🛑 Strong Support Historical demand zone floor
209.9
🔻 Critical Support
If broken, opens path to ₹180–₹160⚖ 4. Demand & Supply ZonesDemand Zones:₹218–₹212 (weekly accumulation area)₹180–₹160 (last major base before rally)
Supply Zones:₹358–₹405 (heavy selling area)₹280–₹300 (minor supply if bounce occurs)
5. Possible ScenariosScenario
1 Support Holds:If ₹244–₹212 holds, expect a bounce towards ₹280 and ₹300.A close above ₹300 could re-test ₹358.
Scenario
2 – Breakdown:A close below ₹212 could lead to a quick drop towards ₹180–₹160.
⚠ Disclaimer:
This is for educational purposes only, not trading advice. Futures & commodities are highly volatile; manage risk and consult a registered financial advisor.
NG trade idea for may expiryAs we can see downward trend line breakout, so we can plan short entry till monthly demand zone.
If price break the trend line upward and saty above the trend line atleast 1 day then we can plan long entry with trend line support and SL accordingly.

NATURALGAS BULLISH VIEWNATURALGAS Bullish View.
Ready For Upside 315-325.
CMP 303-304
Weak Below 295 ( on Closing Basis).
For Educational Purpose only.

Winter is coming! Natural Gas has consolidated very well over past few weeks, chart suggests chilling winter and increase in demand. Keep a watch!

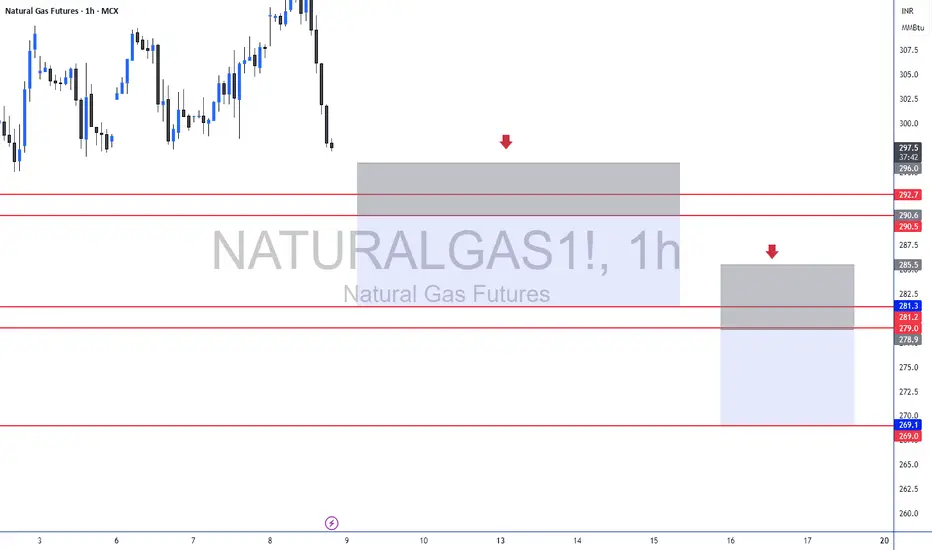
#Naturalgas important levelsMCX:NATURALGAS1!
This chart shows an analysis of Natural Gas Futures and gives us an idea of
where the price might go next:
1. Resistance Zones: There are areas around 283 and 287.5 where the price
struggled to go higher in the past. These are levels where sellers might
come in again.
2. Support Zones: The price has strong support at 271 and 267.4, which are
areas where buyers stepped in before to stop the price from falling
further.
3. Downward Trendline: The price is generally moving downward, shown by
the slanted line. If it can break above this line, it might signal the start of
an upward move.
4. Two Possible Scenarios:
Upward Move: If the price goes above the resistance and breaks the
trendline, it might head toward 287.5.
• Downward Move: If the price doesn't hold above support, it might
drop back to 267.4 or low
In simple terms, traders are waiting to see jf the price breaks above the
resistance (good for buyers) or falls below support (good for sellers) to decide
the next move.

NATURAL GAS BULLISH VIEWNatural Gas Bullish View.
Weak Below 465 on CLB.
Ready For Upside 300-310+
For Educational Purpose only.

A inverse HEAD & SHOULDERS Set-up - NATURAL GAS MCX:NATURALGAS1!
Good to long above 189. (Wait for 5mint candle to close above our Entry level)
Support (SL):- 184
Targets :-
Level 1, 193
Level 2, 195
Level 3, 197
Achievable targets are mentioned in chart as well
👉🏻thetradeforecast 🇮🇳

Bullish trade in Natural Gas ! Favourable Risk RewardNatural Gas is looking bullish for today
It is a buy above 185 and sl to 15 min swing low to a good target of 187/188++
It could be a high risk to reward trade and must be taken by beginners

Bullish Trade In Natural Gas - Dont Miss This !Natural gas has given a good breakout above 180.5 with a sl of 179 target minimum target of 183.5 and 185.
A low sl with good risk to reward of 1:3 is a must take trade for new traders

Natural Gas Levels For 12 August-14 AugustImportant support and Resistance Levels For Natural Gas.
When Market touches the level, the price action plays important roles.
For More Learning Reach out to us.

NaturalGas Crucial level Analysis Side base range: 131.6-159.5
currently It's trend is downtrend and 163 level is very crucial .if day closing below this range then it will be in side base range.


Natural Gas is getting ready for 100% move on the upsideNatural Gas has fallen 60-70% from the upside
Now NG is near long term support which is coming around 110-120
One should not miss this opportunity to BUY
Also RSI is also near to its weekly support
It is double confirmation from price wise and also from Indicator wise.
We can expect prices to rise upto 220-240 levels.
YES, That's almost 100% from current prices.

NG-Natural Gas - Bullish caseNatural Gas - COT reports turning Bullish. Waiting for DAILY Momentum to turn positive and Daily Close above 3.000. NG has potential to touch 4.4 in coming weeks and months. I will be looking for Buying Opportunities on 240/60 Mins TF after it does that.

natural gas to start upside trend MCX:NATURALGAS1! natural gas to move upside if gives green closing today, 3 possible targets as market on the chart , as long as natural gas stays above 235, dont short.

Breakout or Breakdown SoonThe triangle pattern is set to ng and make a strong movement n next few days

natural gas move and levels of buy sellMCX:NATURALGAS1! ng is moving along with parallel channel currently near important buy level if breaks out of channel and sustains above fresh sell zone then ng can change direction once again.

possible flag breakout in natural gas Pretty simple chart which shows the flag pattern being formed in the natural gas. It is just breaking out. Looks like there is a lot more to come in this commodity. This is also after forming an inclined head and shoulder reversal on the hourly timeframe. Makes it a high probability setup to trade.
