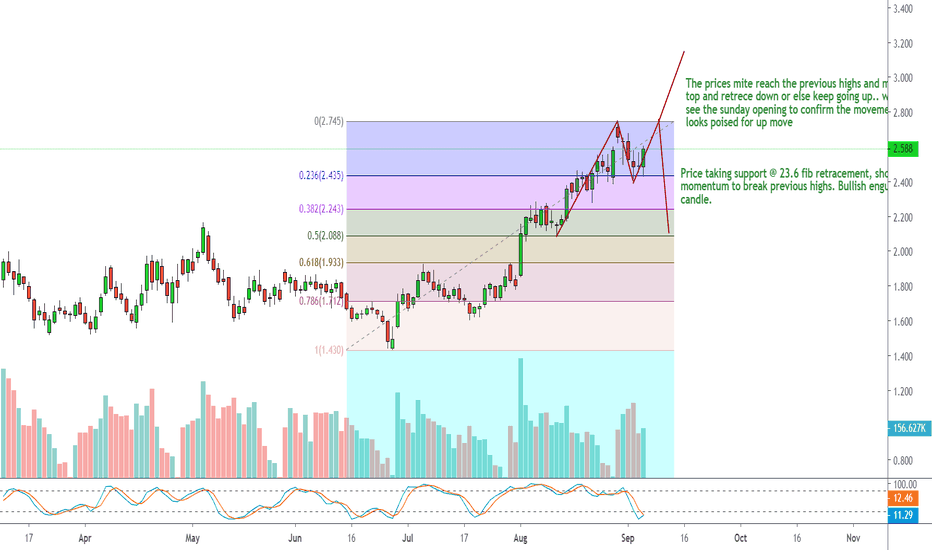
NATURALGAS ELLIOT WAVE COUNTSNATURALGAS has almost completed wave B of wave 2, possibly next wave C is ready to start unfolding soon, which can be confirmed by breaking support trendline, which could be aa good trigger point, Once it breaks support trendline then it can slide towards south directions near $ 7.500 zones, where wave C can complete equality with wave A.
Negative divergence in both rsi and macd on hourly time frame
Most investors treat trading as a hobby because they have a full-time job doing something else.
However, If you treat trading like a business, it will pay you like a business.
If you treat like a hobby, hobbies don't pay, they cost you...!
Disclaimer.
I am not sebi registered analyst.
My studies are for educational purpose only.
Please Consult your financial advisor before trading or investing.
I am not responsible for any kinds of your profits and your losses.
Ng1
Natural Gas buy on dips for the target of 9.525 any dip will be the buy opportunity and support will be treated as a stoploss as of now keep the position light
Naturalgas is almost near the upper trendlineNaturalgas was in uptrend previous week, and almost near its reversal zone.
Note: Always try to find a good price action patterns or any candle stick patterns in marked zones in smaller timeframe to take entry with small stop loss.
Disclaimer: Im not tip provider and this chart is not indented to take trade in my levels. It is all your own risk.
Natural gas level for 25-3-2022It is very good setup to buy on dip till upper trendline reach.
Note: Always try to find a good price action patterns or any candle stick patterns in marked zones to take entry with small stoploss.
Disclaimer: Im not tip provider and this chart is not indented to take trade in my levels. It is all your own risk.
Natural gas ( Bullish View)NG break above 5.221 can give breakout from the current level in short term trade according to the given level .
Natural Gas - 250 or 320 next week ??Natural gas is at crucial levels.
Rising wedge formation can be seen on weekly TF.
2 Doji weekly candles can be seen at resistance levels, if breaks 284 on daily candle close then can expect more upside, else looks probable to come down to 250 levels
P.S. Wait for Daily candle close breaching 260(downside) or 284(upside)
NG-Seems a shorting opportunityNatural Gas shorting around CMP
SL above today opening.
TGT near trendline around 3 points - will update if needed
Disclaimer: These are just my views, I am only SHARING my views - kindly do NOT trade blindly with these levels, please do your own research before entering/ or as per advice from your own financial adviser.
#naturalgas #commodities #mcx natural gas long as per trade setup for swing trade stop loss current swing low.
******whatever charts or levels sharing here are just for educational purpose only not a recommendation. please do your own analysis before taking any trade on them. we are not SEBI registered.
NATURAL GAS analysis current contractlevels mentioned in the chart.
just started commodity trading thats why I posting commodity chart
we can learn together guys.
I am also just started...u can ask me any doubts.if i know i will tell u okay
keep supporting guys
short term equity calls+multi bagger call are coming mean working in background.
will post.okay thanku guys
Short in Natural Gas for the target for 1.600 to .1570The price is taking considerable resistance against the dynamic resistance/trend line.
A strong price rejection can be seen in 4 hours time-frame. This could attract more sellers or even make the existing buyers to change side.
Overall a channel is formed. However, we can see more or less similar volume of buyers and sellers during both corrective and impulse waves.
The fib extension value comes around 1.565 zone. However its recommended to exit during the first opposing force (buying pressure) which can be expected around 1.600 to 1.570.
CMP 1.730
Note: Kindly do your analysis before taking any entries and the above is purely for educational purpose only.
Long in Natural Gas till 1.768 to 1.778The price is consolidating near the recent resistance zone of 1.685 to 1.705.
This implies buyers were able push the price till resistance; but sellers are not strong enough at the resistance point to push the price lower.
But, buyers are able to hold it higher. Anytime the price can burst to next resistance of 1.768 to 1.778.
Hence buying is recommended at current level of 1.684;
Kindly do your analysis before taking any trades.


