Nifty50 Chart Analysis | Watch 25026 & 24937 | Breakout or Dowwn📊 Nifty 50 Update | Key Levels to Watch! (May 27, 2025)
🚨 Technical Analysis:
Nifty 50 has formed a range after a sharp up move. We are currently seeing a consolidation between 24,937 and 25,026.
📌 Scenarios:
Bullish Breakout above 25,026 ➤ Target: 25,119
Bearish Breakdown below 24,937 ➤ Target: 24,841
Both movements are based on the range height of ~90 points, in line with the breakout structure from the previous pole-and-flag pattern.
🟢 Keep an eye on volume confirmation at the breakout/breakdown levels.
⚠️ Disclaimer:
This video is for educational and informational purposes only. I am not a SEBI-registered advisor. Please consult with your financial advisor before making any trading decisions.
Nifty50

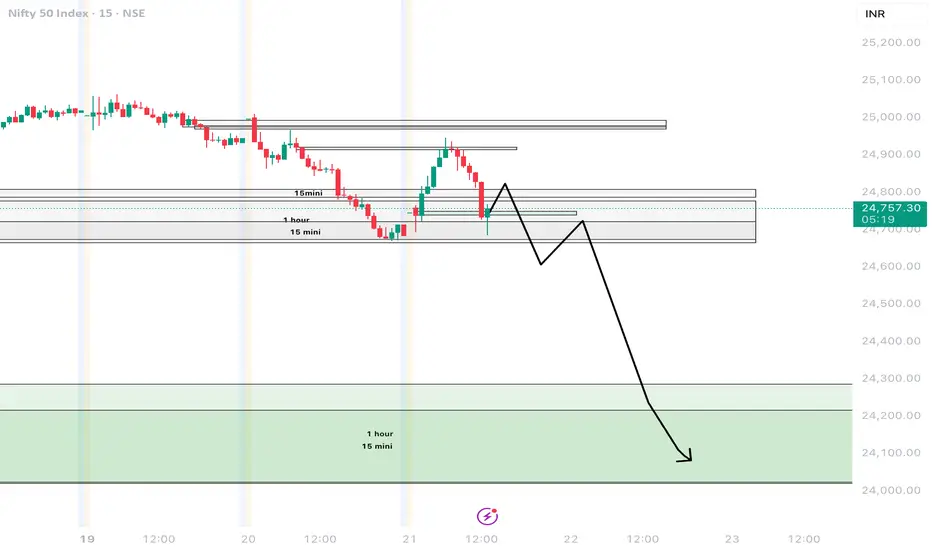
Nifty50 Intraday Setup – BO Above 24,905 or BD Below 24820Technical analysis of Nifty for 26th May - Summary with both breakout and breakdown scenarios
---
### 📊 **Nifty 50 (15-Min Chart) – Flag & Pole Pattern Analysis**
**Pattern**: Bullish Flag & Pole
**Pole Height**: \~442 pts
**Flag Range**: ₹24,820 – ₹24,905
---
### ✅ **Scenario 1: Breakout**
* **Breakout Above**: ₹24,905
* **Target**: ₹24,991
* **Stop Loss**: ₹24,905
* **Comment**: Valid **flag & pole continuation** only if price sustains above ₹24,905 with volume.
---
### ❌ **Scenario 2: Breakdown**
* **Breakdown Below**: ₹24,820
* **Target**: ₹24,735
* **Stop Loss**: ₹24,820
* **Comment**: Failure to hold the flag’s lower range can trigger a short-term **bearish move**.
---
📌 **Note**: Wait for **a decisive candle close** and **volume confirmation** above or below key levels before taking a position.
---

Nifty to Stay in Pause Mode Ahead of Expiry WeekAfter a strong run, the Nifty rally seems to be losing steam and has now slipped into consolidation mode. With the monthly derivatives expiry coming up next week, the market is likely to remain range-bound.
Options data suggests that Nifty has carved out a trading range between 24,500 and 25,100. Until we see a decisive move beyond either end of this 600-point band, don’t expect a strong directional trend.
A clear breakout above 25,100 could reignite bullish momentum, while a breach below 24,500 might invite fresh selling pressure. Until then, it’s all about sideways action and expiry-driven volatility.

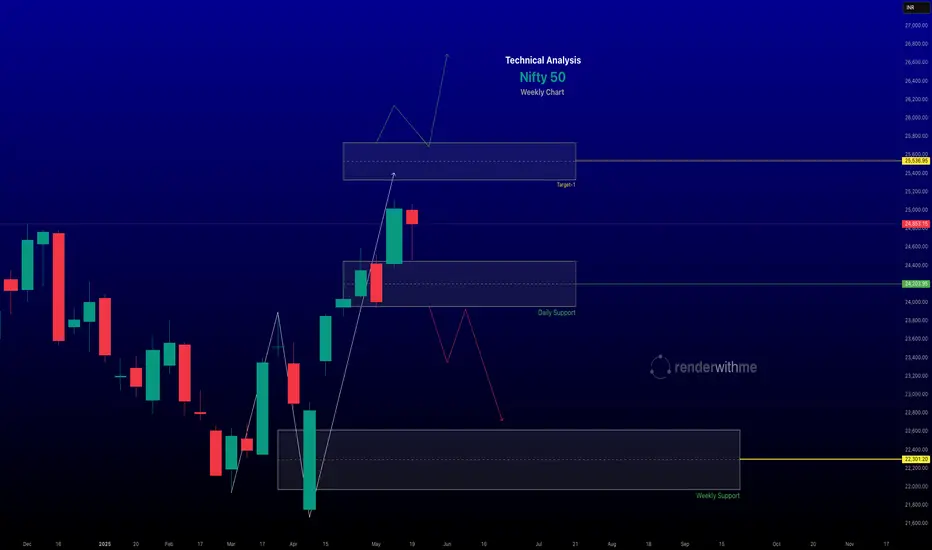
Nifty 50 Weekly Technical Analysis for May 26–30, 2025- Nifty 50 Technical Analysis for May 26–30, 2025 -
# Current Market Context
Recent Performance: As of May 23, 2025, the Nifty 50 closed at 24,853.15, up 243.45 points (0.99%), snapping a three-day losing streak. The index has shown resilience, supported by broad-based buying in financials, Pharma, and IT sectors.
- Market Sentiment: indicate a cautiously bullish outlook for the week targeting 25,300–25,700, driven by a positive weekly close and potential short covering. However, resistance near 25,000
# Key Technical Levels
- Support Levels:
Immediate support is at 24,400–24,000, aligning with the 20-day EMA and recent lows. A break and close below 24,000 could lead to further selling toward 24,099 or 23,500, a strong support level backed by put option open interest.
Weekly pivot support is at 23,559, with deeper support at 23,000.
- Resistance Levels:
Immediate resistance is at 25,000, with a confluence of weekly and monthly resistance at 25,297–25,575, reinforced by Fibonacci Retracement levels.
A sustained break above 25,100 could target 25,500–25,700, with potential for 26,161 by expiry if momentum persists.
-- Disclaimer --
This analysis is based on recent technical data and market sentiment from web sources and X posts. It is for informational purposes only and not financial advice. Trading involves high risks, and past performance does not guarantee future results. Always conduct your own research or consult a SEBI-registered advisor before trading.
E&OE
Nifty 50 Technical Analysis - May 23, 2025Nifty 50 Technical Analysis - May 23, 2025
Current Market Overview:
Closing Price: The Nifty 50 closed at 24,637, Down 203 points.
Day Range: Low: 24,500.00 | High: 25,000.00
Market Sentiment: The market exhibited strong bullish momentum, driven by positive global cues, including a ceasefire between India and Pakistan and optimism around US-China trade negotiations
Chart for your reference

Nifty 50 | Technical Analysis for week 19-23 May 2025Hi,
I am sharing my view on nifty 50 trend direction. It can fill the gap pending at 24200.
If you like my view then please like and share this post.
Disclaimer: This is only for education purpose.
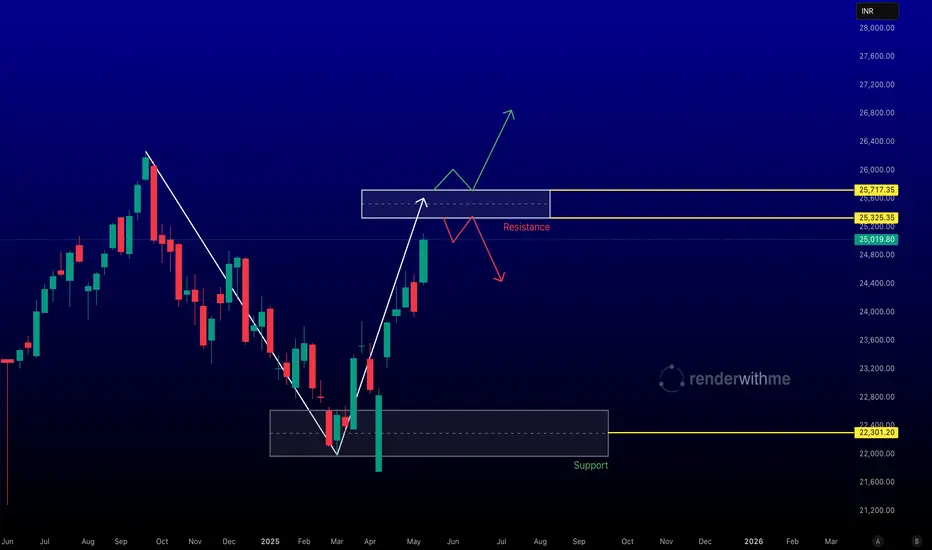
Nifty Breaks Past 25,000: Is a New High on the Horizon?Last week, Nifty broke above the psychological milestone of 25,000, shaking off market doubts and sparking fresh bullish momentum.
◉ Key levels to watch:
The zone between 24,750–24,850 now acts as immediate support, while 23,750–23,850 remains a major support.
This rally wasn't just a technical bounce — it was fuelled by meaningful tailwinds:
● India-Pakistan Ceasefire helped ease geopolitical concerns, calming the nerves of investors.
● Cooling inflation in both India and the U.S. sparked hopes of rate cuts, improving market liquidity.
● Strong corporate earnings from majors like Hero MotoCorp , HCL Tech , and Tata Motors lifted sentiment.
With continued FII inflows , the bullish momentum is expected to persist — potentially pushing Nifty toward its all-time high in the near term.

Nifty 50 outlook for the week of May 19–23, 2025
# The Nifty 50 index, a benchmark for the Indian stock market, has shown mixed signals recently, and the outlook for the week of May 19–23, 2025, depends on key technical levels, market sentiment, and global cues. Below is a technical analysis based on available data and trends, with a focus on price levels, support, resistance, and indicators.
Current Market Context
Latest Close (May 16, 2025): The Nifty 50 closed at 25,019.80, down 42.30 points (-0.17%).
Recent Performance: The index has shown volatility, with a strong rally of 550 points on May 15, closing above 25,000 for the first time in seven months, driven by FII buying (₹5,393 crore) and optimism around a potential US-India trade deal. However, it slipped slightly on May 16, testing the 25,000 mark.
Technical Analysis
Price Action and Trend
Current Trend: The Nifty is trading within an ascending channel on the daily chart, indicating a short-term bullish structure. However, it recently broke out of a descending channel on the 4-hour chart, suggesting potential for further upside if key levels hold.
Recent Volatility: The index experienced significant intraday volatility, closing at 25,062 on May 15 (up 395 points) but failing to sustain above 25,070 on May 16. This indicates profit-booking pressure at higher levels.
Sentiment: we suggest a cautious outlook, with some analysts pointing to a "breather-type chart pattern" for the upcoming week, indicating possible consolidation or a pullback before further moves.
Chart for your reference
Nifty 50 Technical Analysis - May 16, 2025Nifty 50 Technical Analysis - May 13, 2025
Current Market Overview:
Closing Price: The Nifty 50 closed at 25,035.30, Up 395.20 points.
Day Range: Low: 24,750.00 | High: 25,400.00
Market Sentiment: The market exhibited strong bullish momentum, driven by positive global cues, including a ceasefire between India and Pakistan and optimism around US-China trade negotiations
Chart for your reference

Nifty - Elliot Wave Update So, thankfully we have been aligning are views with the market and reviewing counts at the right time. Lucky much? :)
On May 2nd - We caught the top, when the breakout didn't look convincing
We got a good correction (Correction was even better in stocks) and booked out at around 24k on May 9th, and changed views, again as the fall wasn't as bad as it was expected after the end of 5th. Hence, it made sense to expect a 5th up.
This change in view helped us ride a good move of +1000 points in Nifty and multiple +10% moves in stocks (crazy moves there).
Now, while the view shared on May 9th still remains valid, there's an even more bullish view possible.
Ideally, I should have waited for more clarity, but thought that someone shouldn't book out of positions, if it's actually that.
So, there are two scenarios:
1. We are in 5th up/ which got done, is about to be done. In this case we head down to 23500 or so and then we review if this bounce was corrective or we are going to ATH.
2. We did 1 and 2 and have started 3 up. Within 3 we started the 3rd up today. If this is true, the run up should continue for next few days.
How to decide, I am keeping 61.8% of today's move as a deciding factor. So, if we come back to 24700, I'll be out of longs - will even book cash trades and wait for clarity to re-enter.
P.S.: You must be wondering, what the two Orange circles denote - Well they are for reminding me that this price action can be a trap, as it has happened in past. :D
Though looking at set-ups in stocks and the way they are moving after clearly defining a base - I am quite confident that the low has been made for this correction.
As usual, important to track closely and be nimble to change the view and humble to accept mistakes :)
All the best!
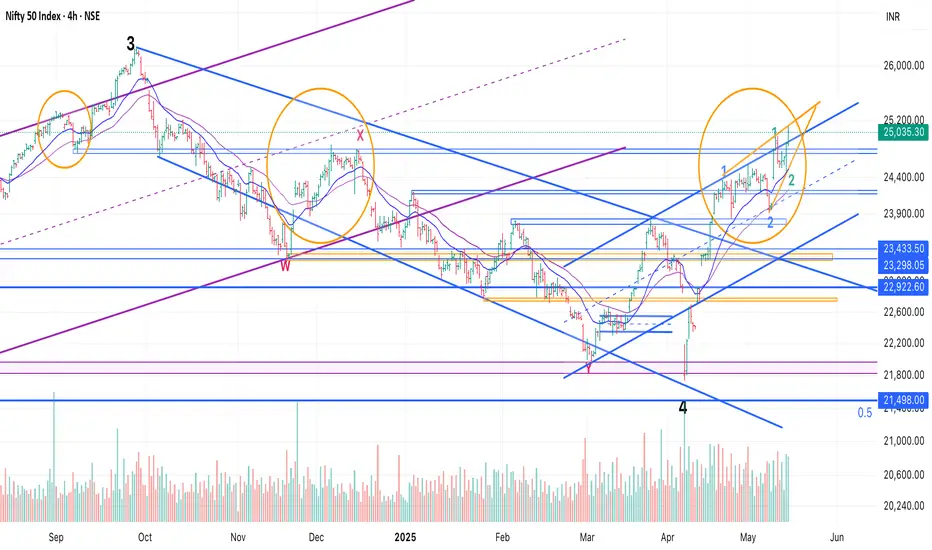
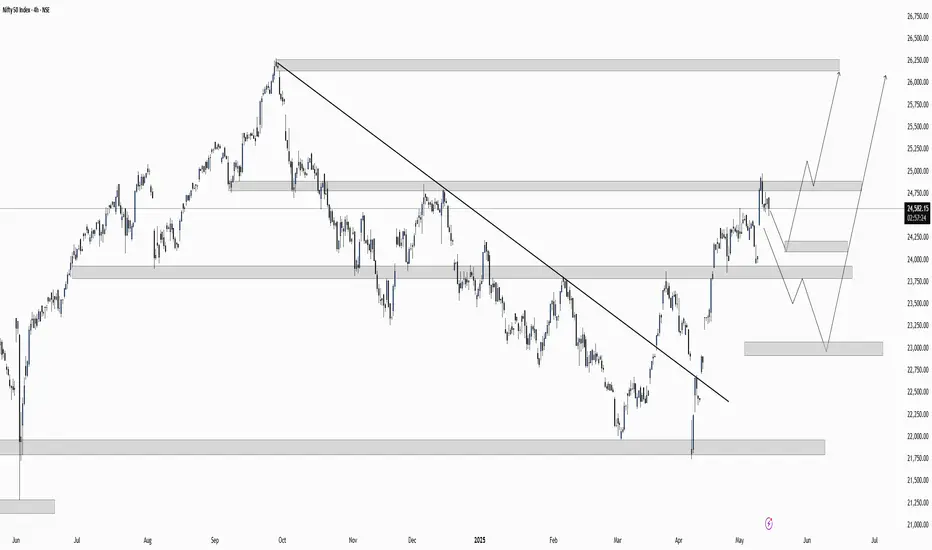
NIFTY 50 Index – 4H Technical Outlook🔍 Chart Overview
Index: Nifty 50 (NSE)
Timeframe: 4H
Current Price: 24,563.50
Bias: Bullish, but awaiting retracement
🧠 Market Structure Analysis
✅ 1. Trendline Breakout
Long-term descending trendline has been clearly broken, signaling a shift from bearish to bullish structure.
Strong bullish move post-breakout confirms momentum on the buy side.
🧱 2. Key Supply and Demand Zones
Zone Type Price Range Comment
Demand Zone 1 24,150 – 24,300 Strong structure zone, likely to hold on first retest
Demand Zone 2 23,500 – 23,750 Deeper retracement support, highly reactive
Demand Zone 3 22,900 – 23,100 Last stronghold; potential for swing reversal if tested
Supply Zone 25,000 – 25,300 Short-term resistance before bullish continuation
Target Zone 26,250 – 26,500 Next major upside target
🔄 Two Potential Bullish Scenarios Drawn
🅰️ Scenario 1: Shallow Pullback
Retrace to Demand Zone 1 (24,150–24,300)
Bounce and continuation toward 25,000 → 26,000+
Quick retest of structure support → higher high
🅱️ Scenario 2: Deeper Pullback
Break below Zone 1, retest Zone 2 or 3 (as deep as 23,000)
Strong demand and liquidity here could fuel a massive rally toward 26,000
This offers better risk-to-reward for long-term buyers
✅ Bullish Confluences
Signal Description
✅ Trendline Breakout Major signal for bullish reversal
✅ Higher High Formed Structure confirms bulls are in control
✅ Clean Demand Zones Zones are respected and visible
✅ Liquidity Grab Below Potential trap move below 24,000 to grab liquidity before continuation
✅ Fibonacci Confluence Likely overlap with 50–61.8% retracement (not shown, but expected)
❌ Invalidation Level
If price closes below 22,900, it may indicate a breakdown and trend reversal.
Watch for signs of bullish absorption around this level.
📊 Trade Idea: Buy on Dip
Entry Area Stop Loss Target 1 Target 2 Risk:Reward
24,150–24,300 23,950 25,200 26,250 ~1:3
23,500–23,700 23,200 25,200 26,250+ ~1:4
Disclaimer:
The information provided in this post/video/chart is for educational and informational purposes only. It should not be considered financial advice or a recommendation to buy or sell any security, financial product, or instrument.
I am not a SEBI-registered investment advisor. All trading and investing decisions are at your own risk. Past performance does not guarantee future results. Always consult with a qualified financial advisor before making any financial decisions.
NIFTY Intraday View For 15 May 2025Index is trading between 24800 and 24300. Index is behaving sideways since last sessions inside this 500 points range.
Directional traders should wait till range breaks either side.
I am Not SEBI Registered
This is my personal analysis for my personal trading. Kindly consult your financial advisor before taking any actions based on this.

Nifty 50 Technical Analysis - May 13, 2025Nifty 50 Technical Analysis - May 13, 2025
Current Market Overview:
Closing Price: The Nifty 50 closed at 24592.25, down 381.55 points.
Day Range: Low: 24,378.85 | High: 24,944.80
52-Week Range: Low: 21,281.45 | High: 26,277.35
Market Sentiment: The market exhibited strong bullish momentum, driven by positive global cues, including a ceasefire between India and Pakistan and optimism around US-China trade negotiations
Chart for your reference

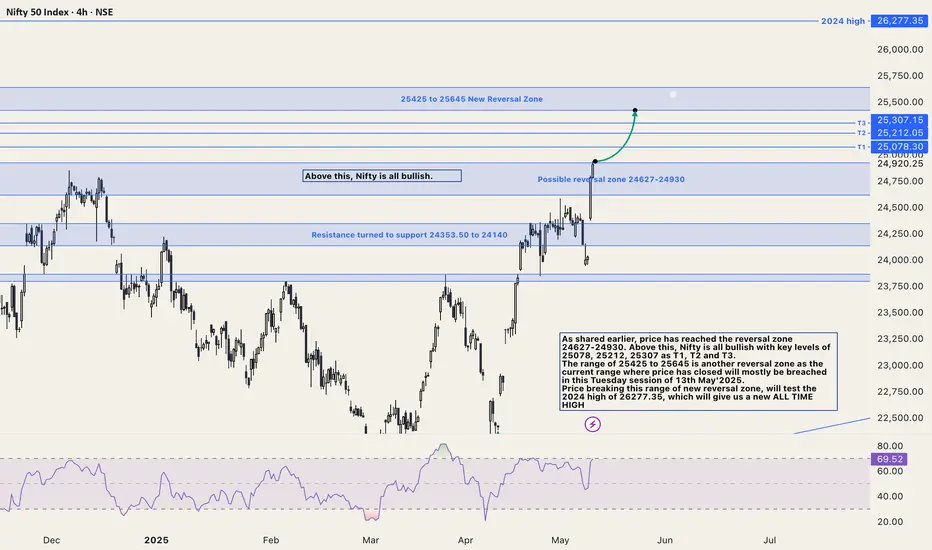
Nifty updated chart for Bullish view.As shared earlier, price has reached the reversal zone 24627-24930. Above this, Nifty is bullish, with key levels of 25078, 25212, and 25307 as T1, T2, and T3.
The range of 25425 to 25645 is another reversal zone as the current range where price has closed will mostly be breached in this Tuesday session of 13th May'2025.
Price breaking this range of new reversal zone, will test the 2024 high of 26277.35, which will give us a new ALL TIME HIGH
Nifty 50 Technical Analysis (as of May 12, 2025)Nifty 50 Technical Analysis - May 12, 2025
Current Market Overview:
Closing Price: The Nifty 50 closed at 24,924.70, up 916.70 points (+3.82%), marking its best single-day performance in four years.
Day Range: Low: 24,378.85 | High: 24,944.80
52-Week Range: Low: 21,281.45 | High: 26,277.35
Market Sentiment: The market exhibited strong bullish momentum, driven by positive global cues, including a ceasefire between India and Pakistan and optimism around US-China trade negotiations
Chart for your reference

Nifty Reversal Watch: Key Demand Zones & Moving Average in FocusAs a pure technical analyst, I rely solely on what the charts reveal, ignoring the noise of news and fundamentals. Charts tell the story in advance.
As a demand and supply zone trader, my primary focus is on identifying key areas where institutional activity is likely to drive price action. Today, we’ll analyze the Nifty 50 through the lens of demand zones and then complement it with traditional technical analysis using moving averages. This analysis aims to provide clarity on potential reversal zones and market behavior.
📊 Demand Zones: The Foundation of Analysis
Monthly & Quarterly Demand Zones : On the monthly timeframe, I’ve identified a critical demand zone. When we zoom into the quarterly timeframe, this zone aligns perfectly, creating a high-confluence area. These zones represent institutional footprints (Banks, mutual funds, etc. ), indicating where smart money is likely to step in. These are not just traditional lines or boxes on the chart; they are the footprints of institutions that control the market.
Significance of Demand Zones : Demand zones are areas where buyers are expected to dominate, often leading to price reversals. The confluence of monthly and quarterly demand zones increases the probability of a strong support level.
Current Price Action : Nifty is currently hovering near these demand zones, suggesting a potential bottom formation.
📊 Traditional Technical Analysis: Moving Averages
Now, let’s analyze the market through the lens of traditional technical analysts who rely on moving averages.
EMA 20 on Monthly Timeframe : The 20-period EMA on the monthly chart acts as a reliable support level historically. Since 2004, price reversals have consistently occurred near this moving average, marked by green circles on the chart.
EMA 20 as a Magnet : The EMA 20 on the monthly timeframe is equivalent to the 400-period EMA on the daily timeframe, representing the average price of almost 400 days. In trending markets, price always reverts to its average, making this a critical level to watch.
Historical Exceptions : While there are rare instances (marked by red circles) where Nifty has broken below the monthly EMA 20, the presence of demand zones adds an extra layer of support, reducing the likelihood of a significant breakdown.
Current Price Action : Nifty is currently near the monthly EMA 20, which coincides with the monthly and quarterly demand zones.
📊 Combining Both Approaches
High-Confluence Area : The alignment of monthly and quarterly demand zones with the monthly EMA 20 creates a high-confluence area. This increases the likelihood of a strong support level and a potential Bottom.
Risk Management : While the setup appears promising, it’s crucial to manage risk effectively. Always use strict stop-loss orders and avoid over-leveraging. Even high-probability setups can fail, especially when market sentiment is overwhelmingly negative.
📊 Conclusion
The Nifty 50 is at a critical juncture, with multiple technical indicators pointing towards a potential reversal or consolidation. The confluence of demand zones and the monthly EMA 20 provides a high-probability setup. However, always remember that no setup is foolproof, and risk management is crucial, it’s essential to remain cautious as markets can sometimes defy all technical setups.
This analysis is purely for educational purposes and is not intended as trading or investment advice. I am not a SEBI-registered analyst.
Lastly, thank you for your support.
"The market is a master of patience; trade with discipline, not emotion." 🚀📊

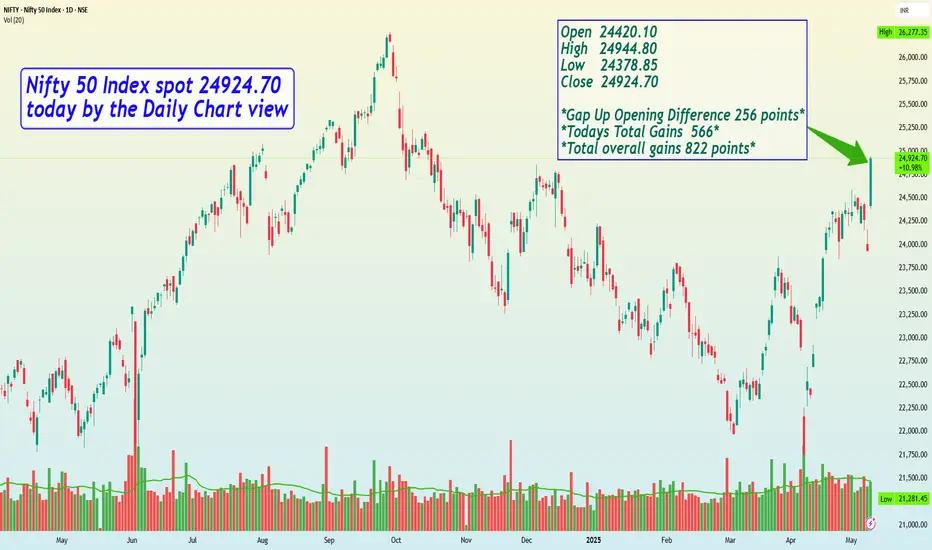
Nifty 50 Index spot 24924.70 today by the Daily Chart viewNifty 50 Index spot 24924.70 today by the Daily Chart view
Open 24420.10
High 24944.80
Low 24378.85
Close 24924.70
Gap Up Opening Difference 256 points
Todays Total Gains 565.95
Overall Total Points Gained 822 points 😃🙌🏼🤩🤝🏼😍👍🏼
* The Gap Up Opening today of 256 points will need to be closed sooner or later on for it might act as a vacuum created space to be filled in.
Nifty Holds 24k: FII Confidence Hints at Bullish Trend Ahead● Despite rising war tensions, Nifty held firm above the 24,000 mark last week, showing the strength and resilience of Indian market—bolstered further by strong Q4 earnings.
● While many are expecting a sharp fall, foreign investors (FIIs) have mostly continued buying, except for last session, which suggests confidence is still intact and a major crash seems unlikely.
● Meanwhile, India VIX spiked above 21, signalling that volatility is heating up.
● Option data shows heavy put writing at the 24,000 level, marking it as a strong immediate support zone.
● On the charts, 23,800 stands out as solid technical support, and as long as Nifty stays above it, the overall mood is likely to stay bullish.
● Given this setup, the market is likely to trade in a sideways to bullish range in the coming week, unless major negative news breaks.

Nifty - Elliot Waves - Another PossibilityWell, Nifty is at a place that there are so many possibilities :)
This one is in line with the previous one, where I had mentioned that 5 up is pending and 25k can come.
I saw a few stocks making an expanded ED and turning, which gave the idea that Nifty could also be doing that.
So, here it goes - we go up in an E - 24800 is top of the expanded ED - we might even see a throw over to 25k - but unlikely) and then roll over.
After that there will be 2 options:
1. Bullish Scenario - We are just doing a 1 and the retracement we get is 2 (23400 target). Once this retracement is over we head to all time high.
2. Bearish Scenario - This entire leg up was corrective and we head down breaking April's lows.
In both cases we should get a decent short opportunity aroun 24800-25000.
However, now we have a minor trade for long - I would usually trade this very light and mostly intraday.
Will wait for the end of move for short trades. All the best!
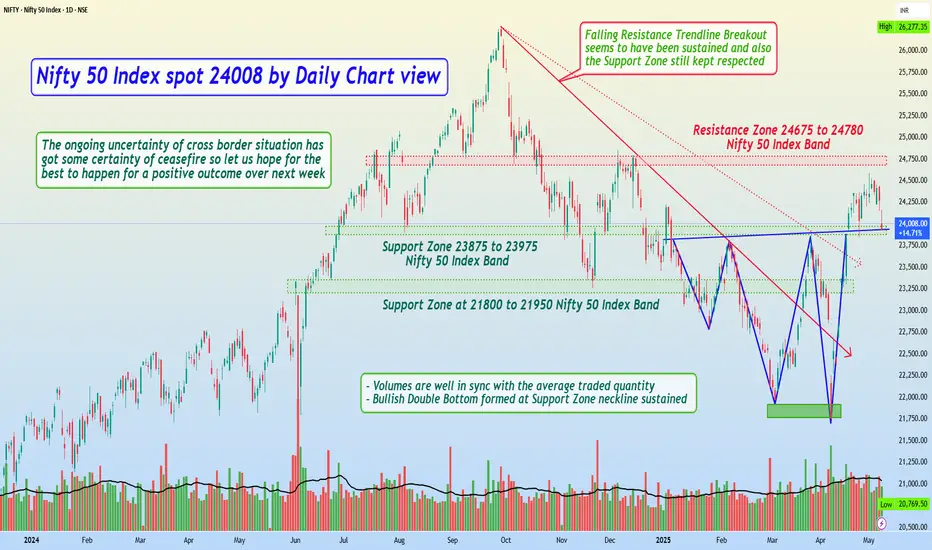
Nifty 50 Index spot 24008 by Daily Chart viewNifty 50 Index spot 24008 by Daily Chart view
- Resistance Zone 24675 to 24780 Nifty 50 Index Band
- Nifty is at Support Zone 23875 to 23975 Nifty 50 Index Band
- *Nifty having sustained above the Support Zone is bound to a bounce back by the cross border mellowed down situation*
- *The ongoing uncertainty of cross border situation has got some certainty of ceasefire so let us hope for the best to happen for a positive outcome over next week*
Nifty 50 Technical Analysis (as of May 9, 2025)
#Nifty50
Tomorrow Price Levels to Watch:
#RESISTANCE : 24,250- 24,350 A breakout above 24,500 could signal bullish momentum.
#support : 24,000 (recent low from May 8) and 23,850. A drop below 23,850 may indicate a bearish shift toward 23,500 or lower.
Trend Check: Look for a daily close above 24,400 to confirm bullish continuation or below 23,850 for bearish pressure. Use candlestick patterns (e.g., Doji, Hammer) to gauge indecision or reversal signals

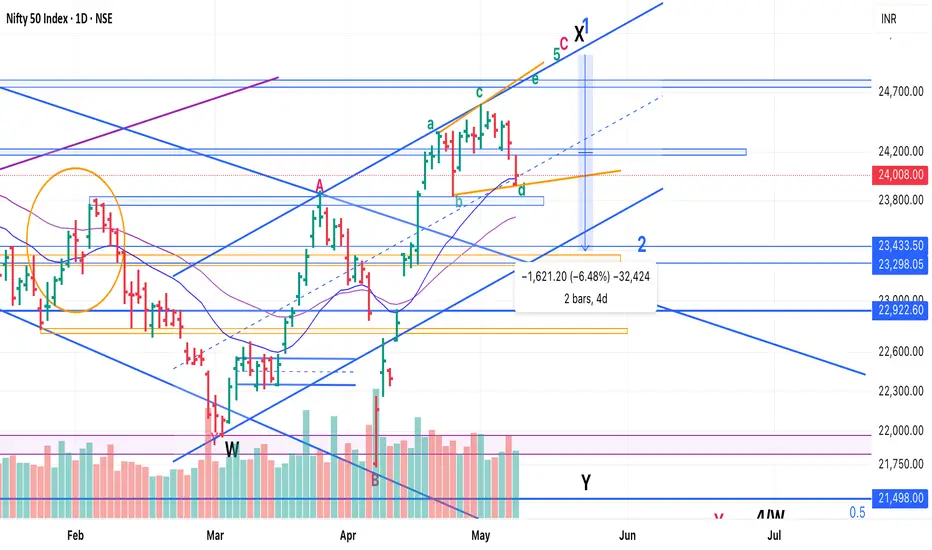
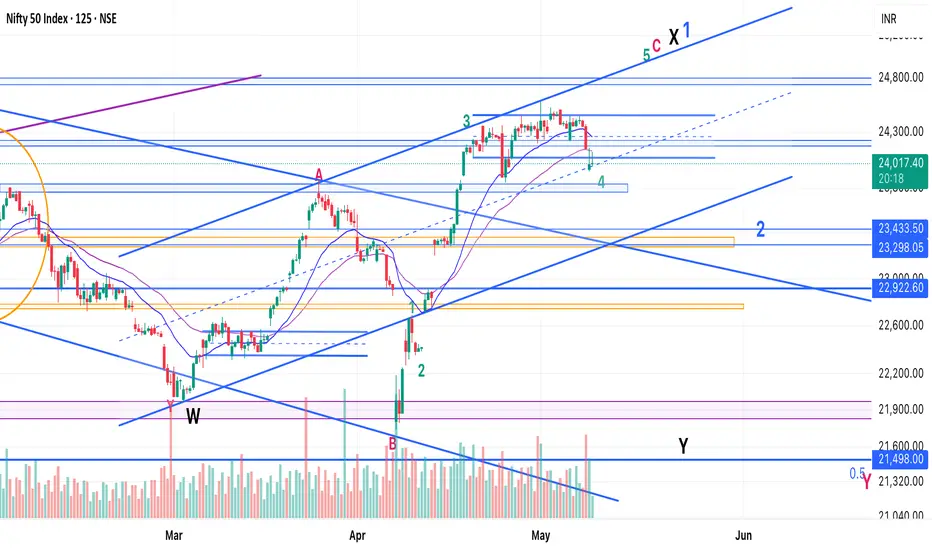
Nifty - Elliot Wave - Alternate counts - Bullish ScenarioI called a top on May 2nd as the buying looked like a trap - which usually acts as a good end of a trend move.
It worked out quite well, but we didn't get a selling momentum, that I expected.
So, contemplating if we are still in 4th and there's another leg up pending, which should be:
1. Bearish scenario - C of X - Y down should take us to new lows
2. Bullish Scenario - 1 of 5 (weekly) - We should have a 2 and then head up in waves 3 and 5 to 27-30k.
It's a tricky position to be in.
Plan: Keep position light and let the 5th up complete. In both bullish and bearish scenarios, we'll get a good retracement from there - Min 23500 (in 2) and can go till 21500 - 20500 in Y.
Ride the leg down and then take a call if it's bottoming out earlier or we are heading down?
For the time being, I have booked all of my shorts and awaiting clarity.
Cheers - All the best!
Master class Find the Top Watch out for strong stocks. As a trader you must identify strong and weak stocks. ...
Research well. ...
Focus on a small set of stocks. ...
Keep an eye on the news. ...
Focus on timing. ...
Use tools and indicators. ...
Find the right trading platform.
