Master class Find the Top Watch out for strong stocks. As a trader you must identify strong and weak stocks. ...
Research well. ...
Focus on a small set of stocks. ...
Keep an eye on the news. ...
Focus on timing. ...
Use tools and indicators. ...
Find the right trading platform.
Nifty50

Sunday Swings 4 May | Stocks and NiftyI make educational content videos for swing / positional trading
No calls, tips or future predications are done in this video .

Learn Intestinal Level TradingIf you're looking for a simple options trading definition, it goes something like this: Options trading gives you the right or obligation to buy or sell a specific security on or by a specific date at a specific price. An option is a contract that's linked to an underlying asset, such as a stock or another security.
Several factors contribute to this high failure rate: Lack of Knowledge and Education: Many traders enter the options market without a thorough understanding of how options work. Options can be complex financial instruments, and trading them without proper education can lead to significant losses
Option trading is largely a skill requiring knowledge of market trends, strategies, and risk management techniques. While there is an element of uncertainty in the markets, successful traders rely on analysis, planning, and discipline rather than luck.

Nifty Bias Simple
Bias: 24235
Expecting nifty to reach 24235 on Monday.... Will only be looking for shorts before that
Bearish Trade: Will wait for nifty to sweep 24413 then look for 24235...
Bullish Trade: Will wait for nifty to sweep 24207 then look for 24413....
Penguin speaks the draw..
Been awhile, trying to be more consistent

Nifty Outlook: Range-Bound Week Ahead?📈 Nifty wrapped up the week on a positive note, climbing about 1% and keeping the bullish sentiment alive.
🔍 However, the daily chart reveals some hesitation, as the index struggles to stay above the 24,400 mark.
📊 Looking ahead, Nifty is likely to move sideways between 24,500 and 24,000, with heavy call writing at the top and put writing at the bottom, creating a tight trading range.
⚠️ Adding to the caution, the India VIX closed above 18, hinting at increased market Volatility.
💡 Bottom line: Traders should gear up for a volatile and range-bound week ahead. Stay sharp, stay strategic!

Tata motor sign of correction.As per chart analysis stock is trading in LL & LH pattern. It is facing resistance at 78.6%.
Candle pattern showing evening star pattern which is sign correction. It may test 580 soon.

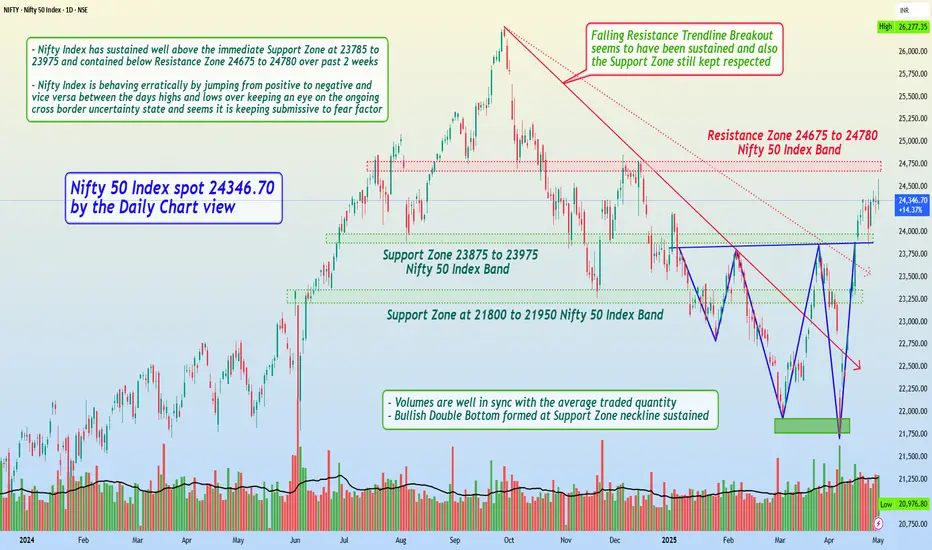
Nifty 50 Index spot 24346.70 by Daily Chart view - Weekly UpdateNifty 50 Index spot 24346.70 by the Daily Chart view
- Support Zone 23875 to 23975 Nifty 50 Index Band
- Resistance Zone 24675 to 24780 Nifty 50 Index Band
- Volumes are well in sync with the average traded quantity
- Nifty Index has sustained well above the immediate Support Zone at 23785 to 23975 and contained below Resistance Zone 24675 to 24780 over past 2 weeks
- Nifty Index is behaving erratically by jumping from positive to negative and vice versa between the days highs and lows over keeping an eye on the ongoing cross border uncertainty state and seems it is keeping submissive to fear factor
- Let us hope for the best to happen for a positive outcome over the coming days/weeks and foresee Nifty 50 Index to gradually and steadily progress towards the current ATH 26277.35 for a New ATH, in line with the Bank Nifty Index strides
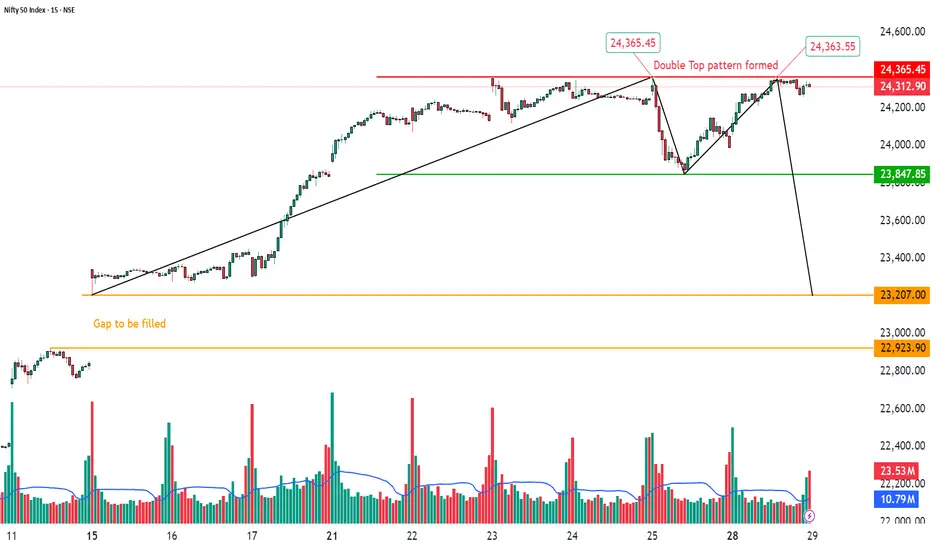
Double Top Pattern Formation with Gap Below | 15-Min Chart🏦 NIFTY 50 INDEX – Double Top Pattern Formation with Gap Below | 15-Min Chart
📅 Date: April 28, 2025
📈 Timeframe: 15-Minute
🔍 Index: Nifty 50 (NSE)
📌 Technical Overview:
Nifty 50 has formed a Double Top pattern on the 15-minute chart around the 24,365 zone, a classic bearish reversal structure.
The price faced rejection at the previous high, signaling caution. Immediate support lies at 23,847, and a breakdown below this level could open downside momentum toward the gap area visible on the chart.
🧩 Chart Pattern:
Double Top identified at 24,365 levels (marked in red).
Neckline support positioned at 23,847 (green line).
A black trendline breakdown already visible, strengthening bearish bias.
Below 23,847, focus shifts to the gap fill zone between 23,207 and 22,923 (orange highlighted).
🔍 Key Price Levels:
Resistance: 24,365
Immediate Support: 23,847
Gap Zone Support: 23,207–22,923
CMP: 24,312.90
A clear breakdown below 23,847 could accelerate the fall toward the gap area.
📊 Volume Analysis:
Increasing selling volume observed near the second top.
The breakout attempt was met with significant volume resistance, hinting at supply dominance.
🧠 Observational Bias:
As long as Nifty stays below 24,365 and breaches 23,847 decisively, bears may remain in control. Traders should watch for either a gap fill attempt or a possible bounce if price retests 23,847 from below.
Nifty CMP at 24335 At this level according to waves it can be preparing for final wave (v) but only if it crosses 24550, till then we should be only observe it as wave 4 correction phase,
No short OR EVEN No long in this range ,

#nifty50 ANALYSIS FOR TOMORROWNSE:NIFTY
#nifty50 ANALYSIS FOR TOMORROW 🔺
❇️ IMPORTANT LEVELS 🚀
❇️ Support: 24235-24086-23925-23807
❇️ Resistance: 24321-24450-24522
👉🏻 PURPLE LINE: 24235-24200 is a key level for buying and selling.
👉🏻 thetradeforecast 🇮🇳

Sunday Swings 27 April | Stocks and NiftyI make educational content videos for swing / positional trading
No calls, tips or future predications are done in this video .

Nifty’s Rally Faces a Hurdle at 24,400 — Volatility on the Rise● After successfully breaking out from the Double Bottom pattern, Nifty faced rejection near the 24,400 level, establishing it as the immediate resistance.
● While the index managed to close above 24,000, this level appears fragile and may not offer strong support. As long as Nifty holds above 23,800, the broader market sentiment is expected to remain positive.
● For the next bullish move to materialize, the index must decisively surpass and sustain above 24,400.
● It is also notable that India VIX rose sharply this week, climbing over 10%, indicating heightened anxiety among market participants.
● With ongoing geopolitical tensions, market volatility could remain elevated in the near term.
● Investors and traders are advised to exercise proper risk management when taking new positions to protect against potential large losses.

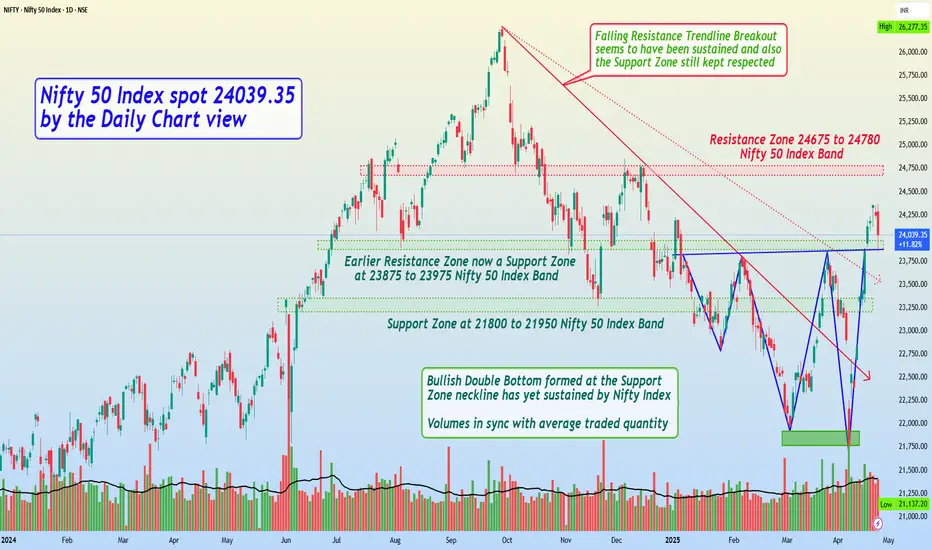
Nifty 50 Index spot 24039.35 by Daily Chart view - Weekly UpdateNifty 50 Index spot 24039.35 by the Daily Chart view - Weekly Update
- Resistance Zone 24675 to 24780 Nifty 50 Index Band
- Volumes are in good sync with the average traded quantity
- Both the Falling Resistance Trendlines have been decently maintained todate
- Earlier Resistance Zone now a Support Zone at 23875 to 23975 Nifty 50 Index Band
- Bullish Double Bottom formed at the Support Zone neckline has yet sustained by Nifty Index
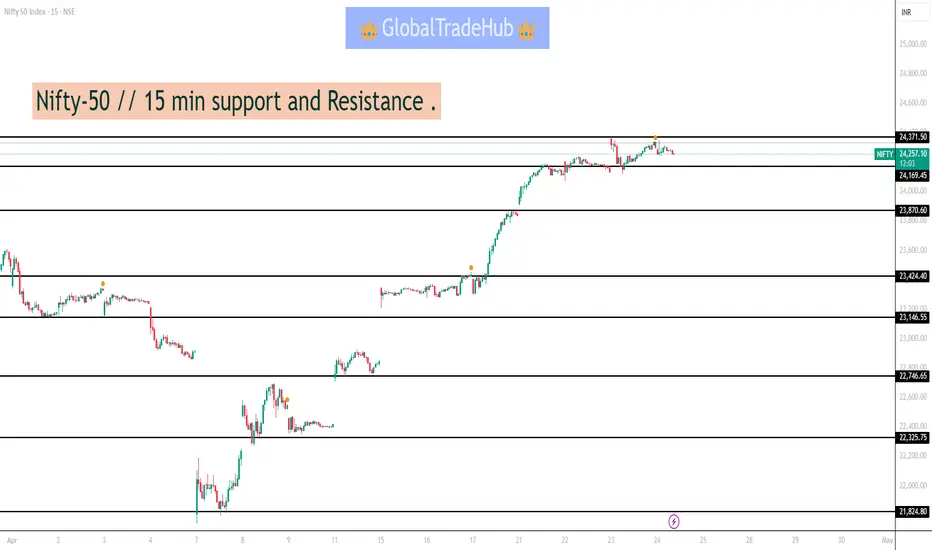
Nifty-50 // 15 min support and Resistance .NIFTY_50 Indicators & signals
Indicator MACD (12,26,9)
23420.22, 23191.53, 96.12
Indicator MACD is in positive zone
Indicator ADX (14)
31.57, 44.62, 23.21
Indicator ADX is indicating that momentum is weak.
Indicator ADX is showing that momentum is towards buying
Indicator RSI (14)
Current RSI is: 53
Indicator RSI is indicating buying momentum and stock might rise.
Nifty50 Index Analysis 22nd AprilNifty50 Index Analysis 22nd April
Current resistance is minimal important.
Importance of the today's candle and it's closing.
What would be the next step and level to observe.
How to manage your stock selection on resistance.
Use resistance to re-select your sector and stocks.
- All above points are discussed in the above Video Analysis.

Sunday Swings 20 April 2025 | Stocks and NiftyI make educational content videos for swing / positional trading
No Tips, calls or any future Predictions are done in the video, just sharing what the charts are talking .

MRPL is on bullish Reversal mode for 64% gain.MRPL:-
It is showing reversal from support level of 100. (100 is also a psychological level).
It forms Bullish engulf candle at fibbo level 78.6% which is sign of reversal.
This engulfs candle may convert soon in Inv. H&S pattern.
As per chart it may test minimum target of 230 soon which is 64% rise from here.
After cross and sustain above 150 it may take speed.

Banking Sector Boost Nifty to New Levels: What’s Coming Next?The Nifty has shown a clear turnaround with a double bottom pattern and has broken past the 23,800 level. This strong move is mostly thanks to the banking sector, especially with great Q4 results from HDFC Bank and ICICI Bank.
The Bank Nifty, now trading just below its all-time high, might struggle near 55,000—a zone that previously triggered a pullback, leading to consolidation in the broader market.
For Nifty, the immediate resistance is seen at the 24,000 level, where significant call writing activity may pose a hurdle. On the downside, a breach below 23,500 could signal a potential reversal, dragging the index into a downtrend once again.

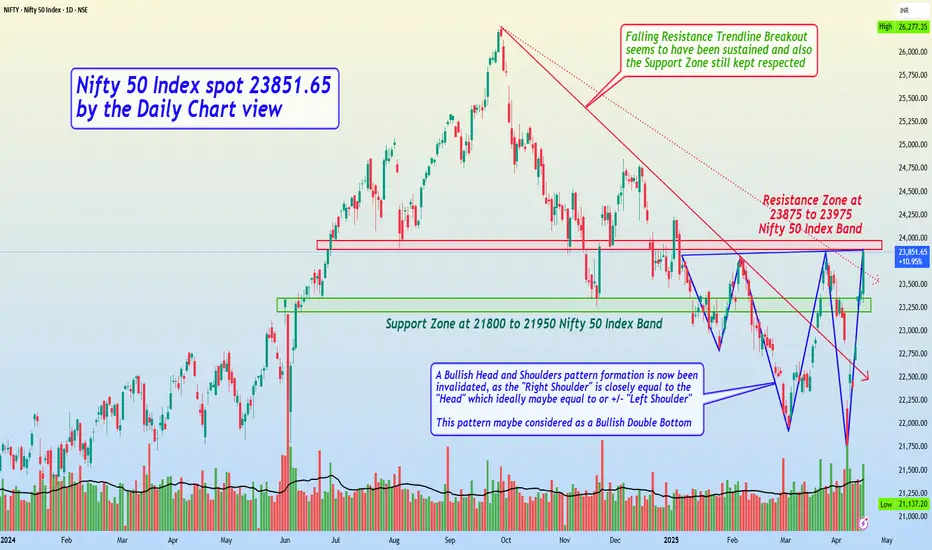
Nifty 50 Index spot 23851.65 by Daily Chart view - Weekly UpdateNifty 50 Index spot 23851.65 by the Daily Chart view - Weekly Update
* Support Zone at 21800 to 21950 Nifty 50 Index Band
* Resistance Zone at 23875 to 23975 Nifty 50 Index Band
* A Bullish Head and Shoulders pattern formation is now been invalidated, as the "Right Shoulder" is closely equal to the "Head" which ideally maybe equal to or +/- "Left Shoulder". This pattern maybe considered as a Bullish Double Bottom
Nifty50 Index Analysis by Stock EngineersNifty50 Index Analysis -
Trend analysis as per Dow theory.
Important candle at the bottom of swing.
Trump tariff news impact on the market.
Gap theory in the market.
Importance of the today's candle and it's closing.
What would be the next step and level to observe.
- All above points are discussed in the above Video Analysis.

Nifty Bottom Forming? “Be Greedy When Others Are Fearful”Hello Everyone, i hope you all will be doing good in your life and your trading as well. Let's discuss about nifty and analysis some next move.
Guy's after a sharp correction in Nifty, signs of a potential bottom are finally emerging. Yesterday’s price action, supported by strong volume and the appearance of an Abandoned Baby candlestick pattern , indicates that we might have witnessed a key reversal day. The price held firm near a crucial support zone, and with most stocks near 52-week lows, we could be staring at a solid bounce opportunity.
This is exactly when smart money starts accumulating — when fear is high and hope is low. A price rally towards the upper channel resistance looks probable, provided Nifty sustains above the breakout zone.
echnical Highlights:
Reversal Signal: Formation of Abandoned Baby pattern near support
Volume Spike: Indicates possible institutional buying near bottom
Support Zone: Price reversed from key area, aligning with earlier channel lows
Resistance Target: 23,200-23,300 – upper boundary of the falling channel
Market Outlook:
With the broader market showing deep corrections across sectors (some 30–35% down from highs), this zone could be a powerful accumulation range. From Banking, Pharma, Chemicals, to IT and FMCG , many sectors are offering long-term value. As global sentiment improves and short-term panic fades, we may see Nifty lead a recovery move supported by sector rotation.
Rahul’s Tip
Bottoms aren’t confirmed by green candles alone, but by conviction + price behavior near support. Stay calm, follow structure, and let the chart do the talking.
Disclaimer: This analysis is for educational purposes only. Please consult a financial advisor before making investment decisions.
If you Found this helpful? Don’t forget to like, share. And Do you think this was the bottom for Nifty? Drop your thoughts and let’s discuss below!

HINDUSTAN FOODS Swing Trade (Long)Strong buyers entered again trapping the sellers on monthly time-frame and making a liquidity pool.
On daily time-frame price is in up-trend and is going up by sweeping lows.
If Nifty holds current levels of 23000, (ie. if Nifty is not bearish) then there are high chances of
HINDUSTAN FOODS reaching the target levels.
1:5 Risk to Reward
Follow me for more such simple trade setups based on Trend and Liquidity.
Happy Trading!

GMBREW Sell Trade with 1:8 RRGMBREW Sell Trade with 1:8 Risk to Reward.
Simple buyer - seller psychology based trade.
Retail buyers got trapped, in a down-trending stock which can fuel next downwards move.
Follow for more such setups.
